Physical, chemical and mechanical properties of Pinus sylvestris wood at five sites in Portugal
iForest - Biogeosciences and Forestry, Volume 10, Issue 4, Pages 669-679 (2017)
doi: https://doi.org/10.3832/ifor2254-010
Published: Jul 11, 2017 - Copyright © 2017 SISEF
Research Articles
Abstract
The reduction of resinous species in Portuguese forest areas has caused constraints to wood industry supplies. Portugal represents the extreme southwest of Scots pine (Pinus sylvestris) natural distribution and large gaps exist in the knowledge of its wood-quality characteristics. Understanding the relationship between these traits is important for recognizing which combination of wood properties is the most suitable for specific uses. To address these questions, we assessed wood-quality traits, namely, wood-density components (microdensitometric analysis), chemical composition (NIR spectrometry) and mechanical properties (bending tests) of wood samples collected at five representative forest sites in Portugal. Our results showed that Portuguese Pinus sylvestris has good radial growth and denser wood, higher extractive content and higher stiffness and strength than northern European provenances. The lignin content was within the range attributed to softwoods. Among the Portuguese stands, trees growing at lower-altitude sites exhibited denser wood and higher mechanical properties, while trees from high-elevations showed higher amounts of lignin. Ring density was more strongly correlated with earlywood than latewood density. A negative, non-significant correlation was found between ring density and width, supporting the assumption that the higher radial growth (ring width) does not negatively affect wood quality (density). In general, chemical properties had a weak relationship with physical and mechanical properties (MOE and MOR). Both mechanical traits were positively correlated with density and growth components, supporting the assumption that trees with high radial growth do not exhibit poorer mechanical performances.
Keywords
Bending Tests, Correlations, Mechanical Traits, NIR Spectrometry, Scots Pine, Wood-Density Components, Wood Quality, X-ray Microdensitometry
Introduction
Scots pine (Pinus sylvestris L.) has a wide natural distribution across Eurasia, from the sea level up to 2500 m of elevation, on different soil types and areas with mean annual precipitation ranging between 500 and 2000 mm and extreme temperatures from -40 to 35 °C. Such a large range of ecological conditions is reflected by the high variability of its timber in terms of density, strength, extractive content and wood appearance ([46], [29], [5]).
Portugal represents the outermost western limit of Scots pine’s natural range; however, large gaps in the knowledge of its wood characteristics exist in the country. Moreover, in recent years the reduction of resinous species in Portuguese forested areas has caused strong constraints to wood industry supplies. In this scenario, to meet timber demand a future increase of Scots pine stands in Portugal through reforestation of mountain regions is desirable, especially at the higher elevations, where other species such as Pinus pinaster show reduced vigor and profitability, and where the risk of pinewood nematode (Bursaphelenchus xylophilus Nickle) attacks is weaker.
Wood is a complex biological material whose characteristics depend on various internal and external factors, and consists of sets of flexible pipes of cellulose and hemicellulose connected and made stiff by lignin ([30]). However, wood is highly variable and anisotropic (i.e., its properties vary depending on direction) as the result of unequal cambial growth and orientation of wood fibres. Understanding such variability is of critical importance to improve the quality, processing and use of wood ([49], [20]). In particular, wood quality is defined as the specific combination of its properties that are most suitable for a specific final product ([49]), and depends on physical (e.g., wood density), chemical (composition and content of cellulose, hemicellulose and lignin), anatomical (morphology of the wood cell), and mechanical (modulus of elasticity and rupture) features of wood ([49], [41]).
Many wood properties such as stiffness and mechanical strength ([46]), retractility ([33]), resistance to biodegradation ([32]), and the derived paper quality ([36]) are strongly affected by intrinsic wood properties such as density (mass of wood cell wall material per unit volume), which is considered one of the most important indicator of wood quality ([49]), along with fibre and microfibril orientation. However, wood density can vary both within and among trees as a result of the combinations of various density components ([11]). In this respect, x-ray wood microdensity analysis can provide important information on the physiological process underlying wood formation, allowing the cambial activity to be analysed along the growing season in response to different environmental effects ([49]).
Chemical composition of cell-wall components has been proven to influence several wood properties and therefore the suitability of wood to specific purposes ([30]). In particular, the high resistance of wood to axial deformation is thought to be due to cellulose ([44]). Lignin serves as an aggregator agent between the cellulose microfibrils and adjacent cells of the cell walls, conferring to wood rigidity and resilience to impact and compression. Lignin also plays a protective role against external pathogens in trees and enhances the hydrophobicity of plant cell walls for water conduction ([30]). The most widely used method for determining lignin content is the Klason method, which consists of the hydrolysis of polysaccharides. However, near infrared spectroscopy (NIRS) is a simple, rapid and highly reproducible method which has recently relieved wet-chemistry techniques for the determination of the chemical composition of lignocellulosic materials ([37]).
Wood extractives are organic and inorganic non-structural components of the cell wall which contribute to color, smell, decay resistance, flammability, and density and can be removed by solvent extraction. In some species, these compounds provide resistance to decay and insect attack and sometimes affect the specific gravity, thus indirectly changing wood physical properties ([32]).
Due to its simplicity, the bending test is commonly used to assess the mechanical properties of wood compounds. The measure of wood stiffness when loaded by bending is expressed by the modulus of elasticity (MOE), while the maximal load capacity in bending is expressed by the modulus of rupture (MOR - [46], [4]). For P. sylvestris, MOE ranges from 11.6 to 13 Gpa and MOR from 64.2 to 85.6 MPa ([46], [17]).
Understanding the relationship between physical, anatomical, chemical and mechanical properties of wood is important to determine which combination of its properties is the most suitable for a specific final product. Phenotypic correlations between traits may be inherent (i.e., having a genetic basis), a response to the environmental conditions (i.e., due to acclimation), or a combination of both ([1]).
The aim of this study was: (i) to evaluate wood-quality traits (physical, chemical, and mechanical) of Pinus sylvestris growing in Portugal, and compare the results with other European provenances of the same species, as well as with other species; and (ii) to evaluate the relationship (correlations) between wood-quality traits in Portuguese Scots pine.
Materials and methods
In this study, we determined the wood-density components by microdensitometric analysis, chemical composition (in terms of macromolecules) using the NIR spectrometric method, and mechanical properties using three-point bending tests (radial modulus of elasticity - MOErad, and radial modulus of rupture - MORrad). The analysis was conducted on 100 adult Pinus sylvestris trees from five representative sites in Portugal.
Plant material
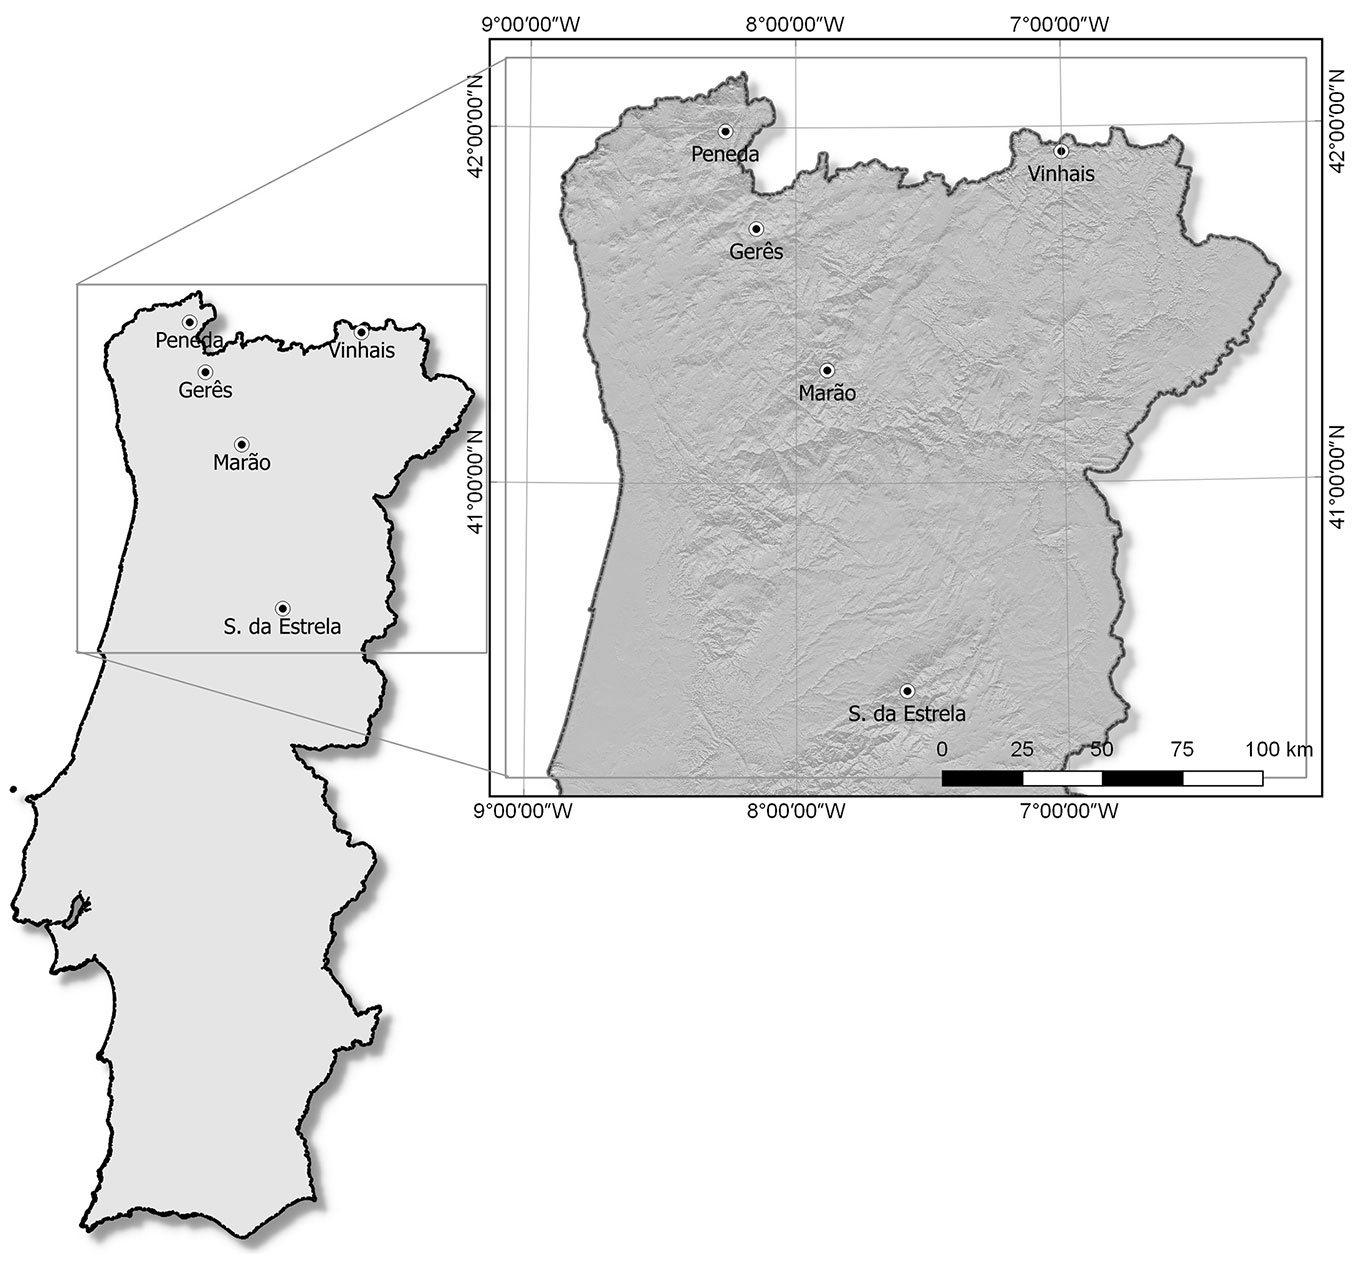
Five sampling sites were selected as representative of the whole range of Pinus sylvestris in Portugal (Fig. 1). The location, number of sampled specimens, and the main characteristics of the selected stands are reported in Tab. 1. At each site, 20 adult trees were randomly sampled, totaling 100 individuals. Trees that were isolated or at the border, bifurcated, not dominant, or having an apparent deficient sanitary condition were excluded from sampling.
Fig. 1 - Location of the sampled sites.
Tab. 1 - Geographical, climatic and stand characteristics of the 5 study sites.
| Characteristics | Marão | Vinhais | Peneda | Gerês | S. da Estrela |
|---|---|---|---|---|---|
| Sampled trees | 20 | 20 | 20 | 20 | 20 |
| Latitude (N) | 41°19′ 03″ | 41°55′ 44″ | 41°59′ 23″ | 41°42′ 56″ | 40°24′ 54″ |
| Longitude (W) | 07°53′ 03″ | 07°00′ 03″ | 08°15′ 54″ | 08°08′ 56″ | 07°35′ 33″ |
| Altitude (m a.s.l.) | 935 | 1128 | 1105 | 815 | 1424 |
| Average age (years) | 49 | 51 | 52 | 66 | 46 |
| Mean annual rainfall (mm) | 1131 | 855 | 1195 | 1205 | 1125 |
| Mean annual temperature (°C) | 14.0 | 11.6 | 14.9 | 14.4 | 13.5 |
| Köpen-Geiger climate classification | Csb | Csb | Csb | Csb | Csb |
| Stand density (trees ha-1) | 460 | 500 | 380 | 400 | 460 |
| Mean tree height (m) | 18.3 | 16.7 | 17.2 | 16.5 | 16.5 |
| Mean diameter at 1.3 m (cm) | 29.2 | 27.2 | 34.6 | 33.0 | 27.4 |
Wood samples were collected at breast height (1.3 m) by extraction of one increment core of 12 mm per tree, from bark-pith-bark, following the direction of the lowest pith eccentricity and as perpendicular as possible to the tree axis.
Microdensitometric analysis
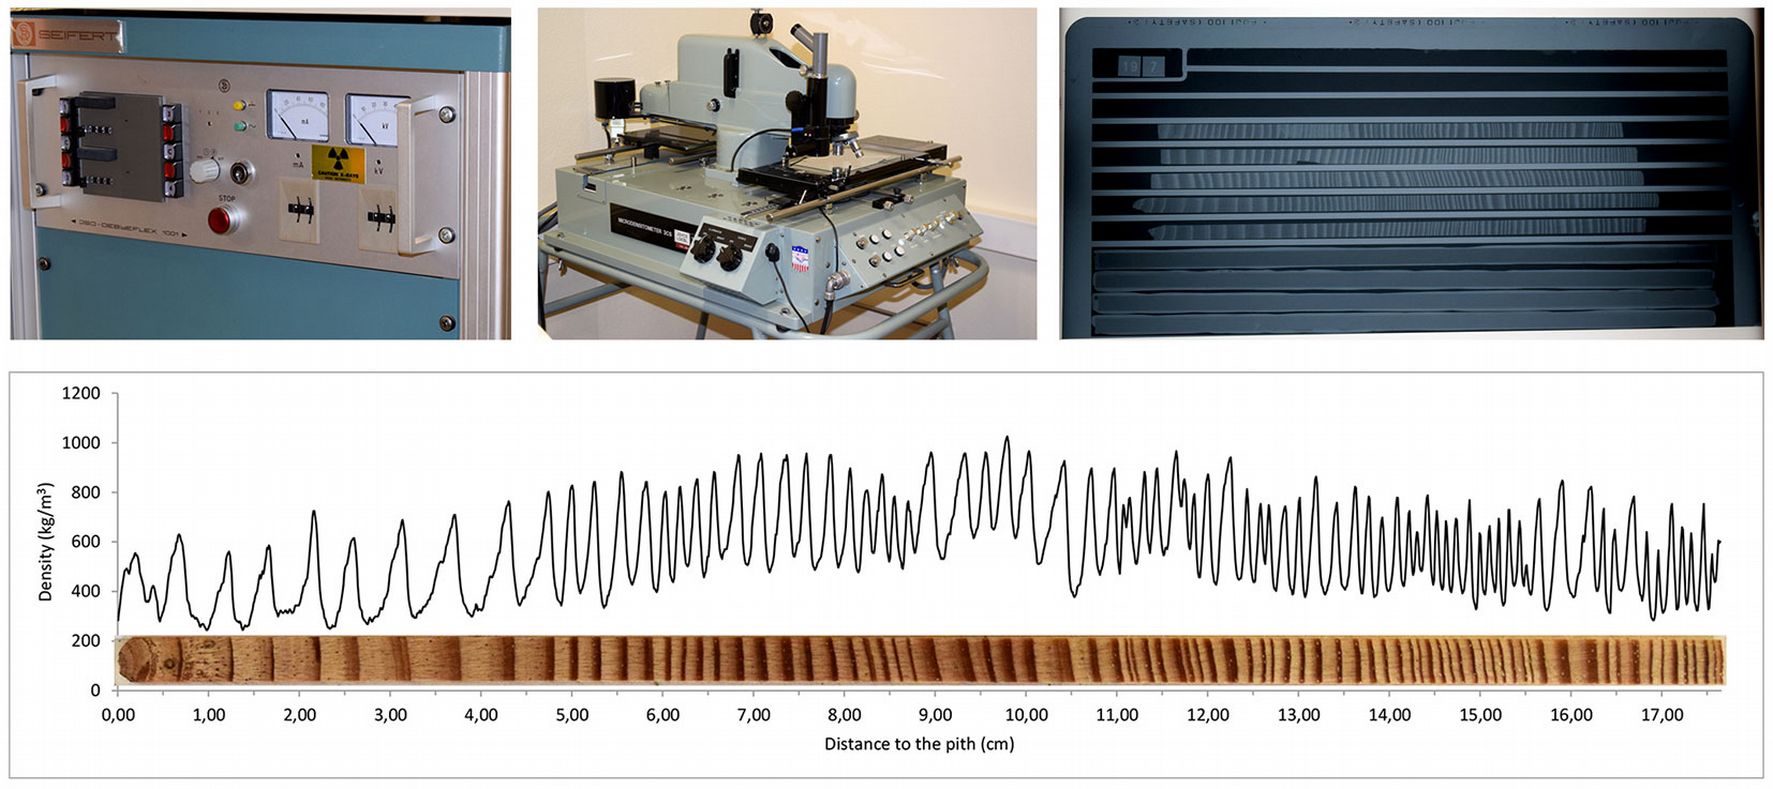
From the increment cores, 2-mm radial strip segments (from pith to cambium) were prepared. These strips were air-dried and conditioned to 12% moisture content. The radial samples were x-rayed perpendicularly to the transverse section, and their image was scanned by microdensitometric analysis ([25]). The time of exposure to radiation was 300 s, at an intensity of 18 mA and an accelerating tension of 12 kV, and the distance between the x-ray source and the film was 2.5 m. The data comprising radial density profiles were recorded every 100 µm with a slit height (tangential direction) of 455 µm. Along with the wood samples, standards of cellulose acetate of known thicknesses and real densities were also x-rayed. Because their x-ray affinity is similar to that of the wood, the conversion of optical density to real density could be obtained by linear regression. Through this process, it is possible to determine wood density in a step of 100 µm from pith to bark, which provides a continuous radial density record throughout the tree’s life (Fig. 2).
Fig. 2 - Microdensitometer and x-ray apparatus. An example of the data obtained by microdensitometric analysis is displayed in the bottom panel.
Using these data, several density components for each growth ring were determined: average ring density (RD), earlywood density (EWD), latewood density (LWD) and heterogeneity index (HI). In addition, other components related to tree growth were measured: latewood percentage (LWP), earlywood width (EWW), latewood width (LWW) and ring width (RW).
The growth ring boundaries on the radial profiles were identified by locating sharp density variations with cross-examination through visual observation of the macroscopic anatomical features. The earlywood-latewood boundary in each growth ring was determined by the average of the minimum and maximum density values within each ring ([35]). To determine the HI, we used the method proposed by Ferrand (1982, cited in [26]), which express the heterogeneity based on the standard deviation of all individual density values in each ring.
Near infrared spectroscopy
The material left from each increment core after removing the radial strip for x-ray analysis was preliminarily milled in a Retsch SM 100 cutting mill with a 6-mm sieve and further milled with a Retsch Ultra Centrifugal Mill ZM 100 with a 1-mm screen sieve. Aliquots of the milled wood were then Soxhlet-extracted with dichloromethane, ethanol, and water. The Fourier-transformed near infrared (FT-NIR) spectra were obtained in the wave number range of 12.000 to 3.800 cm-1 using a Bruker MPA spectrometer (Bruker Optics, Ettlingen, Germany) in diffuse reflectance mode with a spinning cup module. Each spectrum was obtained with 100 scans at spectral resolution of 8 cm-1, and zero filling of two was applied.
The Klason lignin content (based on extractive free oven-dry weight) and composition (H/G based on extractive free material) were estimated by NIR-based PLS-R models using the OPUS-Quant software (Bruker Optics, Ettlingen, Germany). The models had a prediction error of 0.26/ 0.35 (RMSEC/RMSECV) and 0.002/0.002 (RMSEC/RMSECV) for Klason lignin content and composition (H/G), respectively (unpublished data). The predictions of these models are more accurate than those of the PLS-R models previously reported for Pinus pinaster ([3], [6], [14]) and similar to those of the models for Picea abies ([38], [39]).
Radial mechanical properties
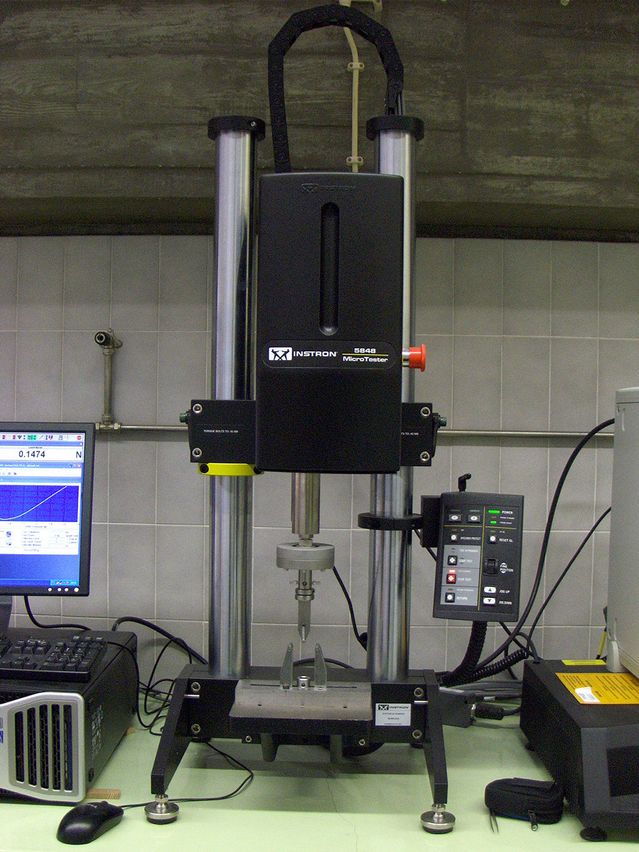
For this analysis, the same strips from the microdensitometric analysis were used. MOERad (modulus of elasticity in radial direction) and MORRad (modulus of rupture in radial direction) were evaluated through three-point bending tests ([14]). Before testing, the specimen dimensions (thickness and width) were measured with a digital calliper (0.01 mm resolution). Bending tests were carried out at room temperature by using an electro-mechanical testing machine (Instron 5848 MicroTester®) with a 0.5 mm min-1 displacement control and 40-mm span (Fig. 3).
Fig. 3 - The Instron 5848 MicroTester machine used for the bending tests.
Data analysis
The means of measured variables at each site were compared by the Duncan’s multiple range mean comparison test (p<0.05), and pairwise Pearson’s correlation coefficients among all traits were estimated. All the statistical analyses were performed using JMP statistical software (SAS Institute Inc.).
Results and discussion
Mean values wood-quality traits
The mean values of wood-density components, and chemical and mechanical properties at each site are summarized in Tab. 2 and Tab. 3, respectively. The results of this study and previous findings from other studies and regions were compiled in Tab. 4 and Tab. 5 to facilitate their comparison and the discussion of results. Tab. 4 contains data concerning density components.
Tab. 2 - Mean values (± standard deviation) and results of the comparison test for wood-density components. (RD): average ring density (kg m-3); (EWD): earlywood density (kg m-3); (LWD): latewood density (kg m-3); (LWP): latewood percentage (%); (EWW): earlywood width (mm); (LWW): latewood width (mm); (RW): ring width (mm); (HI): heterogeneity index (kg m-3). Different letters in the same column indicate significant differences (p<0.05) between sites after Duncan’s multiple range test.
| Site | RD | EWD | LWD | LWP | EWW | LWW | RW | HI |
|---|---|---|---|---|---|---|---|---|
| Marão | 548 ± 0.061b | 405 ± 0.054a | 841 ± 0.073c | 33.26 ± 4.68a | 2.52 ± 0.59b | 1.21 ± 0.37b | 3.72 ± 0.87b | 219 ± 0.026c |
| Vinhais | 544 ± 0.063b | 421 ± 0.059a | 774 ± 0.067b | 35.20 ± 4.45ab | 1.85 ± 0.33a | 1.00 ± 0.24a | 2.86 ± 0.49a | 183 ± 0.031b |
| Peneda | 534 ± 0.051b | 396 ± 0.041a | 741 ± 0.054b | 40.36 ± 3.82d | 1.91 ± 0.42a | 1.17 ± 0.29ab | 3.08 ± 0.65a | 184 ± 0.021b |
| Gerês | 621 ± 0.063c | 490 ± 0.060b | 834 ± 0.060c | 39.37 ± 4.33cd | 1.81 ± 0.38a | 1.08 ± 0.23ab | 2.89 ± 0.56a | 182 ± 0.021b |
| S Estrela | 497 ± 0.036a | 402 ± 0.040a | 672 ± 0.060a | 37.14 ± 4.22bc | 1.88 ± 0.36a | 0.99 ± 0.15a | 2.88 ± 0.45a | 140 ± 0.030a |
Tab. 3 - Mean values (± standard deviation) and results of the comparison test for chemical and mechanical properties. (Dichloro): extractives soluble in dichloromethane (%); (Ethanol): extractives soluble in ethanol (%); (Water): extractives soluble in water (%); (Total): total extractives (%); (Klason): lignin content (%); (H/G): lignin composition (%); (cP/cH): pentose/hexose ratio; (MOERad): radial modulus of elasticity (MPa); (MORRad ): radial modulus of rupture (MPa). Different letters in the same column indicate significant differences (p<0.05) between sampled sites after Duncan’s multiple range test.
| Site | Dichloro | Ethanol | Water | Total | Klason | H/G | cP/cH | MOERad | MORRad |
|---|---|---|---|---|---|---|---|---|---|
| Marão | 8.41 ± 2.30a | 2.19 ± 0.13a | 0.53 ± 0.15a | 11.12 ± 2.40a | 26.87 ± 0.68a | 0.042 ± 0.006a | 10.91 ± 0.63a | 1398.10 ± 564.74b | 34.93 ± 12.17c |
| Vinhais | 12.41 ± 4.90b | 2.18 ± 0.23a | 0.82 ± 0.20b | 15.41 ± 4.94b | 27.67 ± 0.62b | 0.048 ± 0.004b | 12.35 ± 1.34b | 909.45 ± 306.62a | 23.60 ± 5.62a |
| Peneda | 7.59 ± 3.77a | 2.24 ± 0.24a | 0.88 ± 0.33b | 10.72 ± 3.75a | 27.58 ± 0.56b | 0.047 ± 0.005b | 11.94 ± 1.24b | 969.49 ± 300.45a | 23.74 ± 5.55a |
| Gerês | 10.60 ± 6.99ab | 2.29 ± 0.19a | 0.81 ± 0.27b | 13.85 ± 7.16ab | 27.59 ± 0.56b | 0.048 ± 0.004b | 11.97 ± 1.56b | 1504.02 ± 307.74b | 30.76 ± 5.20bc |
| S Estrela | 11.96 ± 4.99b | 2.22 ± 0.22a | 0.81 ± 0.28b | 14.99 ± 4.91b | 27.81 ± 0.68b | 0.048 ± 0.004b | 13.23 ± 1.22c | 1046.18 ± 219.95a | 27.50 ± 4.78ab |
Tab. 4 - Comparison of the results of this study with data from literature regarding density components in softwoods. (X-ray md): X-ray microdensitometry.
| Species | Reference | Country | Altitude (m a.s.l.) |
Latitude (° N) |
Age (yrs) |
Measurement technique |
RD (kg m-3) |
EWD (kg m-3) |
LWD (kg m-3) |
HI (kg m-3) |
|---|---|---|---|---|---|---|---|---|---|---|
| Pinus sylvestris | Present study | Portugal | 815-1424 | 40-41 | 46-66 | X-ray md | 497-621 | 396-490 | 672-841 | 140-219 |
| Riesco-Muñoz et al. ([33]) | Spain | 500-700 | 42-43 | 28/44 | Basic density | 487 | - | - | - | |
| Rey-Prieto & Riesco-Muñoz ([32]) | Spain | 500-1100 | 42-43 | 20-32 | Density at 12% Mc | 491 | - | - | - | |
| Verkasalo & Leban ([46]) | France | - | 48 | 34 | Green density | 532 | - | - | - | |
| Tomczak et al. ([43]) | Poland | 100-200 | 53-54 | - | Basic density | 398 | - | - | - | |
| Aleinikovas & Grigaliûnas ([2]) | Lithuania | 50-120 | 54-55 | 85-110 | Density at 12 % Mc |
572-586 | - | - | - | |
| Auty et al. ([5]) | Scotland | 10-300 | 57 | 9-99 | Basic density | 423 | - | - | - | |
| Wilhelmsson et al. ([47]) | Sweden | 222 | 61 | 68 | Basic density | 398 | - | - | - | |
| Verkasalo & Leban ([46]) | Finland | - | 60-65 | 40 | Green density | 488 | - | - | - | |
| Karlman et al. ([18]) | Sweden | 100-200 | 60 | 100-145 | X-ray md | 502-506 | - | - | - | |
| Kilpeläinen et al. ([19]) | Finland | 145 | 62 | 15 | X-ray md | 410 | 330 | 640 | - | |
| Fries & Ericsson ([10]) | Sweden | 320 | 63 | 30 | X-ray md | 450 | - | - | - | |
| Peltola et al. ([29]) | Finland | 85 | 63 | 20 | X-ray md | 362-373 | 295-305 | 545-567 | - | |
| Pritzkow et al. ([31]) | Sweden | 350-450 | 68 | 50-339 | X-ray md | 460 | 270 | 660 | - | |
| Pinus brutia | Guller et al. ([16]) | Turkey | 90-350 | 36 | 30 | X-ray md | 495 | 388 | 620 | - |
| Picea mariana | Zhang & Jiang ([48]) | Canada | 100-300 | 46 | 15 | X-ray md | 405 | 380 | 550 | 58 |
| Abies balsamea | Koga & Zhang ([20]) | Canada | 200-300 | 47 | 38 | X-ray md | 351 | 317 | 564 | 79 |
| Pinus pinaster | Gaspar et al. ([11]) | Portugal | 30 | 39 | 17 | X-ray md | 474 | 386 | 618 | 120 |
| Louzada & Fonseca ([26]) | Portugal | 750 | 41 | 18 | X-ray md | 483 | 411 | 687 | 134 | |
| Louzada ([24]) | Portugal | 400-800 | 41-42 | 35 | X-ray md | 531 | 452-463 | 758-795 | 140-155 | |
| Louzada ([25]) | Portugal | 40-600 | 39-41 | 70 | X-ray md | 657 | 519 | 859 | 185 |
Tab. 5 - Comparison of the results of this study with data from literature regarding growth components in softwoods.
| Species | Reference | Country | Altitude (m a.s.l.) |
Latitude (° N) |
Age (yrs) |
RW (mm) |
EWW (mm) |
LWW (mm) |
LWP (%) |
|---|---|---|---|---|---|---|---|---|---|
| Pinus sylvestris | Present study | Portugal | 815-1424 | 40-41 | 46-66 | 2.86-3.72 | 1.81-2.52 | 0.99-1.21 | 33.3-40.3 |
| Verkasalo & Leban ([46]) | France | - | 48 | 34 | 3.57 | - | - | - | |
| Aleinikovas & Grigaliûnas ([2]) | Lithuania | 50-120 | 54-55 | 85-110 | 1.64-1.89 | - | - | 34.7-38.6 | |
| Wilhelmsson et al. ([47]) | Sweden | 222 | 61 | 68 | 1.64 | - | - | - | |
| Verkasalo & Leban ([46]) | Finland | - | 60-65 | 40 | 1.81 | - | - | - | |
| Auty et al. ([5]) | Scotland | 10-300 | 57 | 9-99 | 1.9-3.7 | - | - | - | |
| Karlman et al. ([18]) | Sweden | 100-200 | 60 | 100-145 | 1.11-1.58 | - | - | 39 | |
| Peltola et al. ([29]) | Finland | 85 | 63 | 20 | 3.0-3.6 | - | - | 24-28 | |
| Pritzkow et al. ([31]) | Sweden | 350-450 | 68 | 50-339 | 1.4 | - | - | - | |
| Pinus brutia | Guller et al. ([16]) | Turkey | 90-350 | 36 | 30 | 2.93 | 1.58 | 1.38 | 46.9 |
| Picea mariana | Zhang & Jiang ([48]) | Canada | 100-300 | 46 | 15 | 4.03 | 3.51 | 0.52 | 14.1 |
| Abies balsamea | Koga & Zhang ([20]) | Canada | 200-300 | 47 | 38 | 2.06 | 1.82 | 0.24 | 11.8 |
| Pinus pinaster | Gaspar et al. ([11]) | Portugal | 30 | 39 | 17 | 4.22 | 2.7 | 1.5 | 38.2 |
| Louzada & Fonseca ([26]) | Portugal | 750 | 41 | 18 | 5.13 | 3.8 | 1.3 | 25.9 | |
| Louzada ([24]) | Portugal | 400-800 | 41-42 | 35 | 3.51 | 2.4 | 1.1 | 32.8 | |
| Louzada ([25]) | Portugal | 40-600 | 39-41 | 70 | 2.21 | 1.3 | 0.9 | 40.5 |
Wood-density components
In this study, RD values ranged from 497 kg m-3 to 621 kg m-3 (Tab. 2, Tab. 4). Similar RD values for Pinus sylvestris were found in Spain ([32]), and Lithuania ([2]), ranging from 491 to 586 kg m-3 (Tab. 4). Lower wood-density values were found in northern countries, namely in Sweden and in Finland, ranging from 362 to 506 kg m-3 ([19], [18], [10], [29], [31]). Regarding the data of the remaining studies, their comparison with our results cannot be accurate, as the measurement techniques were different, namely, the basic density ([47], [33], [5], [43]) and green density ([46]).
According to these results, we can confirm a slight downward trend in the wood density of Pinus sylvestris with increasing latitude, as previously reported by Van Der Maaten-Theunissen et al. ([45]) and Rossi et al. ([34]). Some of the observed exceptions, such as the high density values observed in Lithuania ([2]) and Sweden ([18], [31]) may be due to the older age of the trees (more than 100 years) compared to the remaining stands, which had average ages between 30 and 50 years.
Lower wood densities were found for other resinous trees, namely Pinus brutia, Abies balsamea and Picea mariana, with values ranging from 351 to 495 kg m-3 ([48], [20], [16]). Although the Portuguese Scots pine stands are somewhat older (average of 55 years) than the remaining stands of other species (15 to 38 years), there is a tendency for Pinus sylvestris growing in Portugal to have slightly denser wood than resinous trees from other regions.
For Portuguese Pinus pinaster, Louzada & Fonseca ([26]) and Gaspar et al. ([11]) obtained values of 483 and 474 kg m-3 in 18/17-year-old trees, respectively. However, Louzada ([24]) found RD values in 35-year-old trees similar (531 kg m-3) to those obtained in this study. An even higher value of 657 kg m-3 was obtained by Louzada ([25]) in 70-year-old trees. Therefore, it is expected that in Portugal Pinus sylvestris wood has density values relatively lower than those of Pinus pinaster wood of similar ages.
EWD values ranged from 396 kg m-3 to 490 kg m-3 (Tab. 2, Tab. 4). For the same species, Kilpeläinen et al. ([19]) and Peltola et al. ([29]) found smaller EWD values in Finland, ranging from 295 to 330 kg m-3. An even lower value of 270 kg m-3 was found in Sweden by Pritzkow et al. ([31]) (Tab. 4). Lower EWD values were also reported for other resinous trees, namely, Pinus brutia, Abies balsamea, and Picea mariana, ranging from 317 to 388 kg m-3 ([48], [20], [16]). However, Portuguese Pinus sylvestris wood presented lower EWD values, as compared to Portuguese Pinus pinaster. Indeed, Louzada & Fonseca ([26]), and Gaspar et al. ([11]) found values of 411 and 386 kg m-3, respectively, although the sampled trees were only 18/17 years old. Higher earlywood densities ranging from 452 and 519 kg m-3 were found in older trees (35/70 years - [24], [25]).
As expected, higher density values were obtained in the latewood component (LWD), with values ranging from 672 to 841 kg m-3 (Tab. 2, Tab. 4). For Pinus sylvestris, lower LWD values were found in Sweden (660 kg m-3) by Pritzkow et al. ([31]) and in Finland (545 to 640 kg m-3) by Peltola et al. ([29]) and Kilpeläinen et al. ([19] - Tab. 4). LWD values of other resinous trees, such as Pinus brutia, Abies balsamea and Picea mariana, were also lower ranging from 550 to 620 kg m-3 ([48], [20], [16]).
For young Portuguese Pinus pinaster trees, Louzada & Fonseca ([26]) and Gaspar et al. ([11]) reported values of 687 and 618 kg m-3, respectively,which are relatively lower than the those obtained for mature Pinus sylvestris. Nevertheless, Louzada ([24]) and Louzada ([25]) found much higher values in older trees (781 and 892 kg m-3, respectively).
Concerning the density variability within the growth rings, the HI in this study varied between 140 and 219 kg m-3 (Tab. 2, Tab. 4). As for Pinus sylvestris, no data was found in literature, while a much lower HI was reported by Zhang & Jiang ([48]) for Picea mariana (58 kg m-3), and Koga & Zhang ([20]) for Abies balsamea (79 kg m-3 - Tab. 4). A lower HI was also found in 18/17-year-old Pinus pinaster (134 and 120 kg m-3, respectively) by Louzada & Fonseca ([26]) and Gaspar et al. ([11]). However, in older trees (35/70 years), the HI was higher, ranging from 140 to 185 kg m-3 ([24], [25]), similar to mature Pinus sylvestris.
The results obtained in this and other studies regarding growth components are compiled in Tab. 5. Regarding the ring-width components, RW varied between 2.86 and 3.72 mm in this study, while its components EWW and LWW ranged from 1.81 to 2.52 mm and from 0.99 to 1.21 mm, respectively (Tab. 2, Tab. 5). Similar RW values for the same species were found in France (3.57 mm - [46]), and Scotland ([5]), where RW values ranged from 1.9 to 3.7 mm (Tab. 5). In general, Pinus sylvestris wood from northern European countries presented lower RW values, ranging from 1.11 to 1.89 mm ([47], [46], [18], [2], [31]). The exception is reported by Peltola et al. ([29]) for Scots pine in Finland, with RW values of 3.0 to 3.6 mm, although in trees with only 20-year-old.
Comparing to other softwood species, the RW values of Scots pine wood obtained in this study were similar to those found in Pinus brutia, Abies balsamea, and Pinus pinaster, ranging from 2.06 to 3.51 mm ([24], [25], [20], [16]). Exceptions were found for Picea mariana (4.03 mm) and Pinus pinaster (4.22 to 5.13 mm) in younger trees with ages from 15 to 18 years ([48], [26], [11]). A similar pattern of variation was detected for EWW and LWW components (Tab. 5). Concerning LWP, values ranged from 33.3% to 40.3% (Tab. 2, Tab. 5). These values are similar to those reported in Pinus sylvestris, Pinus brutia, and Pinus pinaster, ranging from 24% to 46.9% ([24], [25], [26], [18], [2], [11], [29], [16]). Lower LWP values were found for Abies balsamea (11.8%) and Picea mariana (14.1%) wood ([48], [20]), as usual in these species.
Based on the above results, we can conclude that the observed differences in radial growth are mainly due to the geographic provenance and to the effect of age. Nevertheless, in comparison to Portuguese Pinus pinaster wood, Pinus sylvestris had similar or slightly lower growth than P. pinaster trees of similar ages.
Density and RW variations among species and sites have been thoroughly investigated in the past. Nevertheless, even today knowledge gaps in this sector hamper the establishment of a comprehensive theory to explain these differences. Zobel & Van Buijtenen ([49]) justify the wide variety of results by the fact that sites cannot be quantified biologically and by their dependence on the interaction of various factors (e.g., soil, nutrients, moisture, photoperiod, etc.), whose unique local combinations largely affects wood type and characteristics.
Chemical properties of wood
The average content of total extractives per site observed in this study (15.41 to 10.72% - Tab. 3) was outside the range of 2-5% attributed to softwoods ([40]). However, the comparison with literature data should be done with caution due to differences among different studies in extraction procedures, solvents used, time of extraction, and tree age. In Latvia, Sable et al. ([36]) found less total extractives (2.9%) in 27-year-old Pinus sylvestris. In young Pinus pinaster (17 years) values of 4.2% to 6.1% were found in Portugal ([8], [14]). For 14-year-old French Pinus pinaster, Da Silva Perez et al. ([6]) found 4.8% total extractives. The effect of tree age on extractive content is remarkable, since the nature and amount of extractives are dependent on the heartwood content and thus on wood age. There is a gradual increase with tree ageing in the resin content of the inner heartwood, mainly in the lower part of the stem. This means that mature trees contain more heartwood than younger trees, and therefore exhibit a higher extractive content. Although the sampled trees in this study (average age of 56 years) are older than those in the cited works, the obtained values are too higher to be explained only by differences in tree age. Hence, we can conclude that Portuguese Pinus sylvestris wood has a higher extractive content than other European softwoods.
In this study, dichloromethane removed a higher percentage of extractives (12.41 to 7.59%) than ethanol (2.29 to 2.18%) and water (0.53 to 0.96% - Tab. 3). Contrastingly, Fernandes ([8]), Da Silva Perez et al. ([6]), and Gaspar et al. ([14]) found that in Pinus pinaster, water extractives accounted for the largest part of total extractives (1.8% to 3.2%), followed by dichloromethane (1.6%) and ethanol (1.2%).
Klason lignin varied from 26.9 to 27.8% between sites (Tab. 3), within the range of 25% to 33% attributed to softwoods ([40]). For the same species, similar lignin content values were found for 27- to 30-year-old Pinus sylvestris in Latvia (27.1% - [36]) and Finland (18.8% to 26.6% - [42]). For Pinus pinaster, values ranging from 25.6 to 35.3% were reported for 12- to 14-year-old trees ([3], [8], [6], [14]).
Our results shows that there was a small variation in the H/G ratio between sites (0.042 to 0.048 - Tab. 3). Similar values were found for Pinus pinaster (0.041-0.113) by Alves et al. ([3]) and Da Silva Perez et al. ([6]). In fact, average lignin content of wood is less variable within species, often with a range of only a few percent ([40]), and seems to be under moderate genetic control ([14]). However, the earlywood within a tree tends to have a slightly higher lignin concentration than latewood ([7]). According to Donaldson ([7]), the middle lamella accounts for a slightly higher part of total cell-wall volume in earlywood than in latewood and has a higher lignin concentration than the rest of the wall. Changes in thickness of the S2 layer will induce differences in wall thickness between earlywood and latewood, which could account for the change in the cellulose/lignin ratio ([7]). Lignin content of inner wood near the pith is greater than that of outer wood. Latewood has thicker walls in mature wood ([7]), and there is higher latewood content in outer wood than in inner wood. Basically, changes in fibre morphology and cell-wall thickness account for the observed variation in chemical composition.
It is worth noting that, when data from different sources are compared, the differences between methodologies, harvest age, and the possible contribution of compression wood must be taken into account. Lignin content is influenced by this kind of wood since compression wood contains more lignin and less cellulose than normal wood ([44]). For this reason, special care was taken during the sampling process to avoid compression wood.
Mechanical properties of wood
MOERad and MORRad values ranged from 0.9 to 1.5 GPa and from 23.6 to 34.93 MPa, respectively (Tab. 3). Few studies of mechanical traits on radial direction were found in the literature. For Pinus pinaster, Fernandes ([8]) and Gaspar et al. ([14]) obtained similar average values for MOERad (1.37 and 1.10 GPa, respectively) but lower values for MORRad (14.1 and 13.7 MPa, respectively). Even lower MORRad values were reported by Ohbayashi et al. ([28]) for Pinus radiata (7.3-7.8 MPa), also in the radial direction. It should be noted that these results were reported in much younger trees (20 to 25 years) than those analyzed in this study (46 to 66 years). Nonetheless, Portuguese Pinus sylvestris wood seems to have high stiffness and strength as compared with other softwoods, although the available data is not extensive.
Comparisons among Portuguese sampling sites
Wood-density components
The largest differences in RD among sampling sites in Portugal were found between Gerês, with the highest value (621 kg m-3), and Serra da Estrela, with the lowest value (497 kg m-3). There were no significant differences in RD among the remaining sites, with values ranging from 534 to 548 kg m-3 (Tab. 2). Gerês also presented the highest EWD (490 kg m-3), standing out from other sites where the differences in EWD were not significant. EWD values varied from 396 kg m-3 in Peneda to 421 kg m-3 in Vinhais.
The highest LWD values were observed in wood samples from Marão (841 kg m-3) and Gerês (834 kg m-3) and were significantly different from values obtained at the other sites. Between Vinhais and Peneda, no significant differences were found, with LWD values of 774 and 741 kg m-3, respectively. Serra da Estrela presented the lowest LWD (672 kg m-3), which is significantly different from the LWD values of wood samples taken at other sites.
According to these results, no trends related to latitude were detected, as the sites with higher density (Gerês and Marão) are located at an intermediate position in respect to sites with lower density (Peneda and Serra da Estrela - Fig. 1). However, a decrease in wood density was observed with increasing elevation. Indeed, the sites with higher density (Gerês and Marão) are situated at lower altitudes, while the remaining sites with lower density are situated at higher altitudes.
Regarding RW, wood samples from Marão were significantly different from those sampled at the other sites. Marão exhibited higher RW (3.72 mm), mainly due to high EWW values. The differences among the remaining sites were not significant, with values ranging from 2.86 to 3.08 mm. The higher radial growth observed in Marão is manifested in both EWW and LWW. Relative to the other sites, significant differences were observed neither for EWW nor LWW.
In terms of LWP, Peneda and Gerês achieved the highest values (40.36% and 39.37%), which were significantly different from the other sites. The differences among the remaining sites were smaller, ranging from 33.26% to 37.14%.
Regarding HI, greater differences were observed between wood samples from Marão, which showed the highest value (219 kg m-3), and those from Serra da Estrela, which showed the lowest (140 kg m-3). Among the other sites no significant differences were observed for HI, with values of 182 kg m-3 to 184 kg m-3.
Greater differences in wood density and radial growth are expected when differences between sites are conspicuous, particularly in terms of latitude and altitude ([15], [45], [34]), which are inherently related to temperature, precipitation (quantity and distribution), and photoperiod ([49], [22]). Based on the results of this study, it can be highlighted that Marão reconciles high radial growth with high density.
Chemical properties of wood
Wood samples from Vinhais and Serra da Estrela exhibited the highest values of total extractives content (15.41% and 14.99%, respectively) while the lowest values were found in Peneda (10.72%) and Marão (11.12% - Tab. 3). This variation pattern among sites is mainly due to dichloromethane extractives; Vinhais and Serra da Estrela presented the highest values (15.41% and 14.99%, respectively), and Peneda and Marão presented the lowest ones (12.41% and 11.96%, respectively). For ethanol and water extraction, the differences among sites were very small and not statistically significant.
Concerning lignin content (Klason), its composition (H/G) and the pentosans/hexosans ratio (cP/cH), the range of values observed in our analysis was small. Marão samples presented the lowest values (26.87%, 0.042 and 10.91, respectively), which are statistically different from values from the other sites. No significant differences were observed among the remaining sites (27.58% to 27.81%, 0.047 to 0.048 and 11.94 to 13.23, respectively). These results confirm that the within-species variation of average lignin content of wood is fairly low ([40]).
The effect of altitude on Norway spruce wood was studied by Gindl et al. ([15]), who found that lignin content was higher at higher elevations. The authors hypothesized that trees growing at higher altitudes compensate for thinner cell walls by increasing the lignin content in order to maintain the mechanical integrity of the xylem. In fact, in this study samples from higher altitude sites (Serra da Estrela and Vinhais) presented a somewhat higher lignin content (27.81 and 27.67%) than those from low altitude sites.
Radial mechanical properties of wood
The high values of MOERad and MORRad obtained for Gerês (1504.02 and 30.76 MPa) and Marão (1398.10 and 34.93 MPa) are significantly different from those of the other sites (Tab. 3). No significant differences were found among the values of the remaining sites.
Such as for wood density, the results indicate that mechanical properties of wood are higher in sites located at lower altitudes. Similar results were also noted by Rossi et al. ([34]) for black spruce.
Correlations between wood-quality traits
The correlation matrix for wood-density components and chemical and mechanical properties is presented in Tab. 6.
Tab. 6 - Pearson’s correlation matrix between wood-density components and chemical and mechanical properties, computed at tree level (100 observations). Significance level (100 obs.): highly significant (r>0.321), very significant (r>0.254), significant (r>0.195).
| - | EWD | LWD | LWP | EWW | LWW | RW | HI | Diclor | Ethanol | Water | Total | Klason | H/G | cP/cH | MOERad | MORRad |
|---|---|---|---|---|---|---|---|---|---|---|---|---|---|---|---|---|
| RD | 0.915 | 0.780 | 0.419 | -0.208 | 0.175 | -0.079 | 0.243 | -0.049 | -0.068 | 0.073 | -0.047 | -0.140 | -0.063 | -0.199 | 0.482 | 0.323 |
| EWD | - | 0.557 | 0.357 | -0.347 | -0.054 | -0.269 | -0.123 | 0.030 | -0.015 | 0.167 | 0.039 | -0.019 | 0.038 | -0.073 | 0.410 | 0.254 |
| LWD | - | - | -0.069 | 0.219 | 0.249 | 0.255 | 0.743 | -0.061 | -0.154 | -0.183 | -0.077 | -0.344 | -0.182 | -0.307 | 0.499 | 0.443 |
| LWP | - | - | - | -0.480 | 0.304 | -0.222 | -0.231 | -0.134 | 0.072 | 0.257 | -0.115 | 0.159 | 0.037 | -0.068 | 0.074 | -0.097 |
| EWW | - | - | - | - | 0.590 | 0.947 | 0.489 | -0.092 | -0.143 | -0.404 | -0.119 | -0.355 | -0.337 | -0.036 | 0.098 | 0.283 |
| LWW | - | - | - | - | - | 0.818 | 0.404 | -0.036 | -0.127 | -0.280 | -0.056 | -0.247 | -0.276 | -0.013 | 0.146 | 0.224 |
| RW | - | - | - | - | - | - | 0.509 | -0.080 | -0.152 | -0.399 | -0.107 | -0.351 | -0.350 | -0.031 | 0.128 | 0.291 |
| HI | - | - | - | - | - | - | - | -0.131 | -0.164 | -0.318 | -0.155 | -0.369 | -0.241 | -0.337 | 0.267 | 0.297 |
| Diclor | - | - | - | - | - | - | - | - | 0.144 | 0.027 | 0.996 | 0.270 | 0.364 | 0.250 | -0.029 | -0.091 |
| Ethanol | - | - | - | - | - | - | - | - | - | 0.550 | 0.214 | 0.259 | 0.357 | -0.096 | -0.051 | -0.118 |
| Water | - | - | - | - | - | - | - | - | - | - | 0.105 | 0.633 | 0.557 | 0.187 | -0.057 | -0.239 |
| Total | - | - | - | - | - | - | - | - | - | - | - | 0.314 | 0.405 | 0.254 | -0.033 | -0.108 |
| Klason | - | - | - | - | - | - | - | - | - | - | - | - | 0.726 | 0.290 | -0.273 | -0.323 |
| H/G | - | - | - | - | - | - | - | - | - | - | - | - | - | 0.182 | -0.216 | -0.294 |
| cP/cH | - | - | - | - | - | - | - | - | - | - | - | - | - | - | -0.153 | -0.116 |
| MOERad | - | - | - | - | - | - | - | - | - | - | - | - | - | - | - | 0.779 |
Wood density and growth components
The results in Tab. 6 show highly significant correlations among the measured density components. The correlation between RD and EWD (r=0.915) was slightly stronger than between RD and LWD (r=0.780). Both earlywood and latewood densities were also positively correlated but to a lesser extent (r=0.557). The same behavior was verified by Peltola et al. ([29]) for Pinus sylvestris, where the correlation between ring density and earlywood density (r=0.85-0.79) was higher than between overall density and latewood density (r=0.75-0.66). There was also a moderate correlation between earlywood and latewood densities (r=0.51-0.45). Additionally, Koubaa et al. ([21]) found similar results in Picea mariana, where the correlation bewteen RD and EWD (r=0.87-0.91) was higher than the correlation between RD and LWD (r=0.58-0.54), and there was a moderate correlation between EWD and LWD (r=0.28-0.43). For Pinus pinaster, Louzada ([27]) also noticed a more important dependency of RD on EWD (r=0.959-0.960) than on LWD (r=0.521-0.708) and a moderate correlation between earlywood and latewood densities (r=0.291-0.507). On the other hand, Gaspar et al. ([12]), also for Pinus pinaster, found a higher correlation of RD to LWD (r=0.72) than to EWD (r= 0.67) and a weak but positive correlation between earlywood and latewood densities (r=0.19). Abdel-Gadir et al. ([1]) stated that for Pseudotsuga menziesii in the juvenile period, RD was positively, moderately, and equally correlated with EWD and LWD (r=0.56), but in mature wood, the correlation was slightly higher with LWD (r=0.72).
As expected, LWP was significantly highly correlated with RD (r=0.419 - Tab. 6). For Picea abies, Steffenrem et al. ([41]) also found similar positive correlations between these traits at the individual tree level (r=0.50). For Pinus pinaster, Louzada ([27]) and Gaspar et al. ([12]) found a much higher correlation of LWP to RD (r=0.955-0.972 and 0.90, respectively) as did Koubaa et al. ([21]) for Picea mariana for both plantations (r=0.93-0.88) and juvenile and mature wood (r=0.91-0.86). Further, Abdel-Gadir et al. ([1]) stated that for Pseudotsuga menziesii, RD had a very strong correlation with LWP (r=0.93-0.94), suggesting that variation in RD and LWP depends on almost the same set of factors.
LWP was also significantly highly correlated with EWD (r=0.357), but the correlation with LWD was small, negative, and not significant (r=-0.069). Contrary to our results, Louzada ([27]) found a positive correlation between LWP and LWD (r=0.575-0.794) and an even higher correlation between LWP and EWD (r=0.845-0.891). Similar results were found by Koubaa et al. ([21]). Abdel-Gadir et al. ([1]) also achieved moderate positive correlations of LWP to density-related components (r = 0.38 to 0.63). Gaspar et al. ([12]) also found a moderately positive correlation between these traits, although the correlation was slightly higher for LWD (r=0.59) than for EWD (r=0.49).
Concerning ring width components, LWP showed a highly significant correlation to LWW (r=0.304), but a stronger, negative correlation to EWW (r=-0.480). This means that an increase of LWP depends more on a EWW decrease, which is reflected in the negative correlation between RW and LWP (r=-0.222). For the same species, Peltola et al. ([29]) also found a strong negative correlation between LWP and EWW (r=-0.72), higher than the positive correlation with LWW (r=0.29), which led to a negative correlation with RW (r=-0.57).
For Picea mariana, Koubaa et al. ([21]) also found negative correlations of LWP to RW (r=-0.53 to -0.35) and EWW (r=-0.75 to -0.68) but strong positive correlations to LWW (r=0.71-0.83). Gaspar et al. ([12]) also found a positive correlation of LWP to LWW (r=0.87) and a negative correlation of LWP to EWW (r=-0.76). Similarly, Abdel-Gadir et al. ([1]) found positive correlations of LWP to LWW (r=0.65-0.59) and negative correlations of LWP to EWW (r= -0.14 to -0.67). However, the correlations of LWP to RW were positive in juvenile wood (r=0.15) and negative in mature wood (r=-0.11). On the other hand, Louzada ([27]) found a positive but very small correlation between LWP and RW (r=0.009 to 0.091).
For Pinus sylvestris wood, it has been demonstrated that the increase of LWP is more dependent on the decrease of EWW than on the increase of LWW. It is likely that the reported differences related to LWP may result from the different methodologies used to define the threshold value between EW and LW.
RW had a slightly higher correlation with earlywood width (EWW - r=0.947) than LWW (r=0.818), but both are highly significant (Tab. 6). Similar results were obtained by Peltola et al. ([29]) for Scots pine at two different sites for EWW (r=0.98-0.97) and LWW (r=0.60-0.75). Abdel-Gadir et al. ([1]) denoted the same behavior in both juvenile and mature wood of Pseudotsuga menziesii for EWW (r=0.96-0.80) and LWW (r=0.84-0.72). Koubaa et al. ([21]) obtained much higher correlations of RW to EWW (r=0.95-0.91) compared to the low values of LWW (r=0.14-0.19) for both plantations and for both juvenile and mature wood (r=0.95-0.96 and r=0.13-0.55, respectively). For Abies balsamea, Koga & Zhang ([20]) also reported a strong positive correlation between RW and EWW (r=0.96) but no correlation between RW and LWW (r=0.05), meaning that the larger radial growth was caused by an increase in EWW.
This significant influence of Pinus sylvestris earlywood on RW is then reflected in the negative correlation found between RW and LWP (r=-0.222) as well as RD (r= -0.079). However, since the latter correlation is one of the smallest observed and is not statistically significant, it can be deduced that higher radial growth (RW) does not have a pronounced negative influence on density. Peltola et al. ([29]), also for Pinus sylvestris, found a negative and very low correlation of WD to RW for one site (r=-0.05), and a stronger and negative correlation for the other site (r=-0.42). Further, Fries & Ericsson ([10]) found that for Pinus sylvestris, correlations of density with diameter were quite strong and negative, in accordance with the assumption that wide rings tend to have lower density than narrow rings. For other resinous trees, Abdel-Gadir et al. ([1]) reported a weak and negative correlation between RD and RW (r=-0.06 to 0.04) in Pseudotsuga menziesii. For Picea mariana, Koubaa et al. ([21]) found stronger negative relationships between growth rate (RW) and wood density (RD) in both plantations and for both juvenile and mature wood (r=-0.29 to -0.44). For Abies balsamea, Koga & Zhang ([20]) also noticed a negative correlation between RD and RW (r=-0.48). Steffenrem et al. ([41]) found similar results for Picea abies in all levels studied. On the other hand, Louzada ([27]) found a small but positive correlation of RW to RD (r=0.028 to 0.180) in Pinus pinaster. However, according to Karenlampi & Riekkinen (2004 - cited in [4]), an increased growth rate, which is generally associated with lower wood density, may not apply for Pinus sylvestris, since growth rate and density have been shown to be independent, with the density influenced more by cambial age than distance from the tree pith.
RD was also correlated negatively with EWW (r=-0.208) but positively with LWW although these correlations are not significant (r=0.175). This behavior has also been noted in other studies ([1], [21], [12], [29]).
Our review of the available literature highlighted a lack of consensus on the relationship between wood density and growth traits, as positive, neutral, and negative correlations can be found. In addition, Zobel & Van Buijtenen ([49]) compiled information on this subject, finding that all types of correlations between growth rate and specific gravity can be found in the literature. However, it is important to point out that to evaluate the real influence of growth rate on wood density, the analyses has to be conducted among homogeneous age classes. According to Zobel & Van Buijtenen ([49]) relating wood properties to RW for rings of different ages results in false and controversial ideas on the effect of growth rate and can be a factor that contributes to the multiplicity of results. Wide growth rings and low density are associated with juvenile wood, and narrow growth rings with high density are characteristic of mature wood. Therefore, a negative correlation between ring width and density is obvious if both juvenile and mature wood are included in the analysis. As Zobel & Van Buijtenen ([49]) stated, it is the occurrence of juvenile wood (age of growth ring) and not the growth rate by diameter (ring width) that produces lower quality wood.
In general, hard pines tend to show little or no meaningful relationships between wood density and growth rate ([49], [1]) although exceptions have been reported. Gaspar et al. ([13]) observed that larger trees tend to present higher values of RD, LWD, LWW, and LWP. They stated that a possible reason for higher or lower wood density in fast growing trees is that growth is due to an increase of LWW or EWW.
Regarding HI, it was found to be less dependent on low EWD values (r=-0.123) and more dependent on high LWD values (r=0.743), which in turn leads to a positive correlation between HI and mechanical properties (r=0.267 and r=0.297). A positive correlation was also observed between HI and RW (r=0.509), meaning that higher radial growth causes an increase in HI.
Louzada ([27]) also found similar results for the correlation of HI to EWD (negative) and of LWD to RD (positive), although the latter was very small. However, contrary to the results in this study, the author found a negative correlation of HI to RW and a positive correlation of HI to LWP.
Chemical properties of wood
In general, chemical properties of Scots pine wood were positively correlated in this study (Tab. 6). Among the solvents, highly statistically significant correlations were observed between total and dichloromethane extractive content (r=0.996) and between ethanol and water extractive content (r=0.550).
Klason lignin was highly significantly correlated to its ratio (H/G - r=0.726) and, to a lesser extent, cP/cH (r=0.290), although this was still very significant (p<0.01). The relation of H/G and cP/cH was not proven to be significant (r=0.182). Highly significant correlations of extractive contents obtained by different solvents to Klason lignin (r=0.259 to 0.633) and to H/G (r= 0.357 to 0.557) were found. Both lignin and its content were slightly more correlated to water than to dichloromethane or ethanol extractive content. Regarding the relation of solvents with cP/cH, the correlations were statistically less significant, with r values ranging from -0.096 to 0.254. These results clearly indicate that high amounts of extractives may be related to high lignin and its ratio (H/G).
It can be observed that chemical properties have, in general, a small relationship with physical and mechanical properties, whose correlations are generally low and not statistically significant (Tab. 6). Gaspar et al. ([14]) also found that Klason lignin was weakly correlated with most of the physical and mechanical characteristics of wood in Pinus pinaster.
Radial mechanical properties of wood
In this study MOERad and MORRad were correlated each other with high significance (r=0.779 - Tab. 6), confirming the results obtained by Gaspar et al. ([14]) for Pinus pinaster. MOE is a wood stiffness parameter which is highly and positively correlated with strength, and therefore it can be used to assess wood strength parameters such as MOR ([23]). In fact, the good correlation between strength and elasticity is a consequence of the cellular nature of wood; the mechanism leading to failure along the fibres involves partial cell-wall buckling, which is directly related to cell-wall elasticity. However, the correlation between MOE and MOR also depends on the specimen size, as wood samples of different dimensions may include different proportions of imperfections.
We observed that wood-density components and mechanical properties presented highly significant correlations (Tab. 6). These findings are consistent with those previously obtained by Gaspar et al. ([14]) for Pinus pinaster, Liu et al. ([23]) for Picea mariana, and Steffenrem et al. ([41]) for Picea abies. However, only the latter study evaluated wood mechanical traits in the radial direction.
Many researchers have stated that wood density (specific gravity) is one of the major determinants of wood stiffness and strength, where density may explain a large part of the variation in modulus of elasticity in clear wood ([49], [44]). In this study, the correlation of RD to MOERad (r=0.482) was slightly higher than to MORRad (r=0.323 - Tab. 6). Gaspar et al. ([14]) also found a higher correlation of RD to MOERad (r= 0.323) as compared to MORRad (r=0.182). On the other hand, Steffenrem et al. ([41]), in longitudinal mechanical tests, found that the correlation between density and MOE at the individual tree level was moderate (r=0.74) compared to the very strong correlation between density and MOR (r=0.91). Our results revealed that both mechanical traits had higher correlations with LWD (r=0.499-0.443) than with EWD (r=0.410-0.254 - Tab. 6). Mechanical traits also presented positive correlations to growth components (EWW, LWW, and RW), although MORRad was found to be more strongly related to ring width than MOERad (Tab. 6). Therefore, trees with higher radial growth do not cause a negative outcome in terms of their mechanical performance. Similar results were previously reported by Fernández-Golfin et al. ([9]).
Conclusions
Comparing our results to those reported in the literature, we observed higher values of wood-density components in Pinus sylvestris grown in Portugal as compared with those reported for the same species growing in other European regions, confirming a slight downward trend of wood density with increasing latitude. Some of the observed exceptions may be explained by the older age of trees analyzed in these studies. Regarding ring-width components, the differences were likely due to the effect of age, geographic location or species. Nonetheless, differences among geographic provenances are known more for wood density than for radial growth. Portuguese Pinus sylvestris wood exhibited slightly higher density values than the majority of European conifer species. Compared to Portuguese Pinus pinaster wood, Pinus sylvestris at similar ages presented lower densities, and identical or relatively lower growth.
Portuguese Pinus sylvestris wood has a higher extractive content than other European softwoods, and the amount of total extractives was outside the range attributed to softwoods. Contrastingly, Klason lignin was within the range attributed to softwoods.
Although the available data in the literature is not extensive, we can conclude that Portuguese Pinus sylvestris wood presents high stiffness and strength compared to other softwoods.
Among sampled sites in Portugal, no latitude effects were detected; however, our results revealed a significant effect of altitude on the studied wood-quality traits. Indeed, sites at a lower altitude presented higher density and mechanical properties, and lower amounts of lignin than those at higher altitude.
Regarding the qualitative characteristics of Portuguese Pinus sylvestris, wood from Marão shows good physical and mechanical properties and good growth rates, but presents high heterogeneity within the rings. Therefore, this wood is suitable for uses that require high mechanical resistance, such as lumber and timber beams. On the other hand, wood from Serra da Estrela shows low growth rates and density, but its high within-ring homogeneity makes it suitable for the production of highly valuable wood products such as plywood and veneer wood.
Regarding the correlations between wood-quality traits, our results revealed that RD is more strongly correlated with EWD than with LWD. LWP is more dependent on the decrease of EWW than on the increase of LWW. RW presented a slightly higher correlation with EWW (r=0.947) than with LWW (r=0.818), which is reflected in the negative correlation between RW and LWP (r=-0.222) as well as RD (r=-0.079). However, since the latter is not statistically significant, it can be deduced that a higher radial growth (RW) did not negatively affect wood density in Portuguese Scots pine wood.
Within-ring heterogeneity of wood, as expressed by the heterogeneity index (HI) was less dependent on low EWD values (r= -0.123) but more dependent on high LWD values (r=0.743), which, in turn, induces a positive correlation between HI and wood mechanical properties (r=0.267 and r= 0.297, respectively for MOERad and MORRad).
Total extractives were more strongly and positively correlated with dichloromethane content than with ethanol and water content. In general, wood chemical properties showed a low impact on physical and mechanical properties, as revealed by their low and not-significant correlation coefficients.
Both mechanical traits were well correlated with density components (namely LWD) although this was stronger for MOERad than for MORRad. Mechanical traits also presented positive correlations with growth components (EWW, LWW and RW), which support the assumption that trees with higher radial growth do not present poorer mechanical performance.
Considering the reduction of the forest area of resinous species, Portuguese Pinus sylvestris may represent an important resource for the reforestation of higher altitude areas, which are less favorable for Pinus pinaster, and may become an important resource both for local populations and the Portuguese forestry sector.
Acknowledgements
This work was partially supported by project PTDC/AGR-CFL/110988/2009 of the Portuguese Foundation for Science and Technology (Fundação para a Ciência e a Tecnologia, FCT) and co-financed by the European Fund of Regional Development (FEDER) under the scope of the COMPETE-QREN program. Cláudia Fernandes acknowledges the Portuguese Foundation for Science and Technology (FCT) for her Ph.D. grant (SFRH/BD/98777/2013), co-financed by the Social European Fund (FSE) under the POPH-QREN program. Ana Carvalho and Ana Alves acknowledge FCT Postdoctoral Research Grants SFRH/BPD/ 68932/2010 and SFRH/BPD/72781/2010 co-financed by the FSE under the POPH-QREN program. Rita Simões acknowledges her BI scholarship (RECI/AGR-TEC/0493/2012).
Author contributions
CF: microdensitometric analysis, mechanical tests, interpretation of the results and redaction of the manuscript; MJG: microdensitometric analysis, interpretation of results and text review; JP: sampling of tree cores and microdensitometric analysis; AA: chemical analyses; RS: chemical analyses; JCR: critical revision and interpretation of chemical analyses; MES: sampling of tree cores, microdensitometric analysis and statistical analyses; AC: interpretation of results and text review; JEB: supervision of the project assessing Pinus sylvestris wood (PTDC/AGR-CFL/110988/2009) and critical revision of the manuscript; JLL: sampling of tree cores, microdensitometric analysis, mechanical tests, statistical analyses, critical revision and supervision of the manuscript.
References
Gscholar
Gscholar
Gscholar
Gscholar
Gscholar
Gscholar
CrossRef | Gscholar
Gscholar
Gscholar
CrossRef | Gscholar
CrossRef | Gscholar
CrossRef | Gscholar
Gscholar
Gscholar
Authors’ Info
Authors’ Affiliation
Maria João Gaspar
Ana Carvalho
José Eduardo Brito
BioISI - Biosystems & Integrative Sciences Institute, Faculty of Sciences University of Lisboa, C8 BDG Campo Grande (Portugal)
José Eduardo Brito
Department of Genetics and Biotechnology (DGB), University of Tras-os-Montes and Alto Douro, 5001-801 Vila Real (Portugal)
Rita Simões
José Carlos Rodrigues
Centro de Estudos Florestais (CEF), Instituto Superior de Agronomia, Universidade de Lisboa, Tapada da Ajuda, 1349-017 Lisboa (Portugal)
José Luís Lousada
Department of Forestry Sciences and Landscape (CIFAP), University of Tras-os-Montes and Alto Douro, 5001-801 Vila Real (Portugal)
José Luís Lousada
Centre for the Research and Technology of Agro-Environmental and Biological Sciences (CITAB), University of Tras-os-Montes and Alto Douro, 5001-801 Vila Real (Portugal)
Corresponding author
Paper Info
Citation
Fernandes C, Gaspar MJ, Pires J, Alves A, Simões R, Rodrigues JC, Silva ME, Carvalho A, Brito JE, Lousada JL (2017). Physical, chemical and mechanical properties of Pinus sylvestris wood at five sites in Portugal. iForest 10: 669-679. - doi: 10.3832/ifor2254-010
Academic Editor
Giacomo Goli
Paper history
Received: Oct 18, 2016
Accepted: Mar 28, 2017
First online: Jul 11, 2017
Publication Date: Aug 31, 2017
Publication Time: 3.50 months
Copyright Information
© SISEF - The Italian Society of Silviculture and Forest Ecology 2017
Open Access
This article is distributed under the terms of the Creative Commons Attribution-Non Commercial 4.0 International (https://creativecommons.org/licenses/by-nc/4.0/), which permits unrestricted use, distribution, and reproduction in any medium, provided you give appropriate credit to the original author(s) and the source, provide a link to the Creative Commons license, and indicate if changes were made.

Web Metrics
Breakdown by View Type
Article Usage
Total Article Views: 61662
(from publication date up to now)
Breakdown by View Type
HTML Page Views: 49483
Abstract Page Views: 5027
PDF Downloads: 5784
Citation/Reference Downloads: 16
XML Downloads: 1352
Web Metrics
Days since publication: 3307
Overall contacts: 61662
Avg. contacts per week: 130.52
Article Citations
Article citations are based on data periodically collected from the Clarivate Web of Science web site
(last update: Jul 2026)
Total number of cites (since 2017): 37
Average cites per year: 3.70
Publication Metrics
by Dimensions ©
Articles citing this article
List of the papers citing this article based on CrossRef Cited-by.
Related Contents
iForest Similar Articles
Research Articles
Physical and mechanical characteristics of poor-quality wood after heat treatment
vol. 8, pp. 884-891 (online: 22 May 2015)
Research Articles
Density, extractives and decay resistance variabilities within branch wood from four agroforestry hardwood species
vol. 14, pp. 212-220 (online: 02 May 2021)
Research Articles
The physicomechanical and thermal properties of Algerian Aleppo pine (Pinus halepensis) wood as a component of sandwich panels
vol. 15, pp. 106-111 (online: 21 March 2022)
Research Articles
Mechanical and physical properties of Cunninghamia lanceolata wood decayed by brown rot
vol. 12, pp. 317-322 (online: 06 June 2019)
Technical Advances
Technical properties of beech wood from aged coppices in central Italy
vol. 8, pp. 82-88 (online: 04 June 2014)
Short Communications
Influence of thermo-vacuum treatment on bending properties of poplar rotary-cut veneer
vol. 10, pp. 161-163 (online: 13 June 2016)
Research Articles
Physical-mechanical properties and bonding quality of heat treated poplar (I-214 clone) and ceiba plywood
vol. 8, pp. 687-692 (online: 17 December 2014)
Research Articles
Characterization of technological properties of matá-matá wood (Eschweilera coriacea [DC.] S.A. Mori, E. odora Poepp. [Miers] and E. truncata A.C. Sm.) by Near Infrared Spectroscopy
vol. 14, pp. 400-407 (online: 01 September 2021)
Research Articles
NIR-based models for estimating selected physical and chemical wood properties from fast-growing plantations
vol. 15, pp. 372-380 (online: 05 October 2022)
Research Articles
Validation of models using near-infrared spectroscopy to estimate basic density and chemical composition of Eucalyptus wood
vol. 17, pp. 338-345 (online: 03 November 2024)
iForest Database Search
Google Scholar Search
Citing Articles
Search By Author
Search By Keywords


