Density, extractives and decay resistance variabilities within branch wood from four agroforestry hardwood species
iForest - Biogeosciences and Forestry, Volume 14, Issue 3, Pages 212-220 (2021)
doi: https://doi.org/10.3832/ifor3693-014
Published: May 02, 2021 - Copyright © 2021 SISEF
Research Articles
Abstract
Agroforestry practices like pruning trees to control the light flux to crops produce every year a large volume of branches which is valorized by farmers as mulching or energy fuel. However, according to the literature, the wood of branches shows higher rates of polyphenols than stem wood and this can open some new perspectives for branch exploitation. In this study, the wood properties (density, mechanical properties, extractive content and decay resistance) were determined on branches of different sizes from oak, chestnut, poplar and walnut trees collected in two agroforestry systems. These properties were evaluated according to the wood age and the sampling position along the radial and longitudinal axes of the branch. All samples were analyzed by NIR-Spectroscopy and a predicting model aimed to assess the branch wood properties has been developed. Wood characteristics largely vary between species and do not exactly follow the same trends from one species to another. Overall, hardwood density of branches is similar to that of trunks, the content in wood extractives follows similar evolutions, and the decay resistance of branch wood does not seem to be really impacted by its position along the branch. Reliable NIRS models were built to easily predict the wood density and extractives content of agroforestry branches. The extractives content and the decay resistance of branch hardwood appear to be substantially lower than those of trunks, which suggests a non-suitability of branch wood for developing high-valued green chemistry.
Keywords
Introduction
In many tropical countries, agroforestry systems provide both services for agriculture and for non-food economic sectors (housing and energy). Agroforestry is defined as any landscape use system associating trees or any other ligneous perennial plants with animal and/or vegetal productions on the same surface unit ([40]). Such a system provide not only environmental but also economic and social benefits to farming communities ([39], [46]). Agroforestry play an important role in pests and pathogens control (World Agroforestry Centre - [23]), food security ([19]), soil protection and natural amendment ([58]), biodiversity conservation ([34]) and above all in climate change mitigation ([21]). Agroforestry trees differ from forestry trees in two ways: their roots dig deeper ([37]), and they also grow faster and produce more biomass, most likely because there is less competition for the light and other resources ([12]). In addition, agroforestry trees usually grow in more fertilized soils than those of forest trees. In some cases, an agroforestry tree will produce about three times more biomass than a tree of the same age in a forest ([15]). This increased biomass enables agroforestry trees to potentially stock large amounts of carbon, thereby contributing to mitigate the effects of climate change and providing a highly valuable woody resource to be used for various purposes. Since six decades, European countries (including France) have massively excluded trees from the cropfields in order to intensify mechanized agriculture. However, the current agro-ecological transition is going to reverse this trend through the design of new agroforestry systems.
Besides agricultural products, the main product specific to agroforestry systems is wood. Trunks, branches and twigs all have different potential uses due to their diverse characteristics ([1]) which are summarized in Fig. S1 (Supplementary material). Throughout their life cycle, agroforestry trees mostly yield pruning wood from branches, which has the same wood orthotropic cylindrical organization as trunks (Fig. S1) and currently is mostly used as Ramial Chipped Wood (RCW) or animal litter ([31]).
Branch wood has been poorly investigated compared to stem wood, and currently there is a lack of data which could support any potential added-value of the branches for any production path.
Regarding the physical aspects, some studies reported that the mechanical characteristics of branches’ wood are usually reduced compared to those of the trunks ([20]). Other researchers investigated the density and anatomy of branches in several species ([11], [26]), finding that in most cases the wood density of branches seems to be higher than that of the trunks. Yet, this characteristic, as most of other wood characteristics, seems to be highly variable depending on the tree species considered. Such differences also appear when considering wood chemical properties, which strongly change moving from one tree organ to another. Tree knots along the stem have been particularly studied, resulting in most cases richer in extractives than trunks and branches both in hardwoods and softwoods ([27], [25]). Furthermore, branches seem to be richer in extractives than the trunk clear wood, although they are poorer than the knots ([57], [36]). They also present a higher durability than the trunks ([10]), due to the higher content of wood extractives. These are non-structural wood cell components of low molecular weight which act as natural chemical products mainly protecting lignocellulose from fungal and microbial attacks ([41]).
This study investigated the potential of branch wood from agroforestry practices as base material to develop green chemistry and/or to manufacture biomaterials. Farmers prune their trees every year to manage light reaching the ground, and the harvested biomass can help improve the economic model of agroforestry plots. To test the suitability of such a woody biomass to the above goals, wood physical and chemical characteristics were investigated on branches from four species of agroforestry hardwoods collected in interplot systems (oak and chestnut) and in alley-cropped system (poplar and walnut). The evolution of wood density, extractives content and durability with the age of wood along the radial and longitudinal axes of the branches was assessed. These properties were then compared to those of wood from the trunk of the same trees. Additionally, all samples were analyzed by NIR-Spectroscopy with the aim of developing a fast system to assess the branch wood properties directly in the field.
Material and methods
Tree selection
The selected hardwoods species were sweet chestnut (Castanea Sativa Mill.), pedunculate oak (Quercus robur), hybrid walnut (Juglans × intermedia [C. DC.] Carrière, hybrid Juglans nigra × Juglans regia) and hybrid poplar (Populus generosa Henry). Chestnuts and oaks were sampled near Fougères, France (48° 21′ 05.62″ N, 01° 12′ 16.65″ W), while poplars and walnuts were sampled near Alès, France (44° 07′ 37.934″ N. 04° 05′ 0.067″ E). The sampled chestnuts and oaks were planted as grasslands’ hedges, whereas walnuts and poplars were planted within grasslands plots (intraplot).
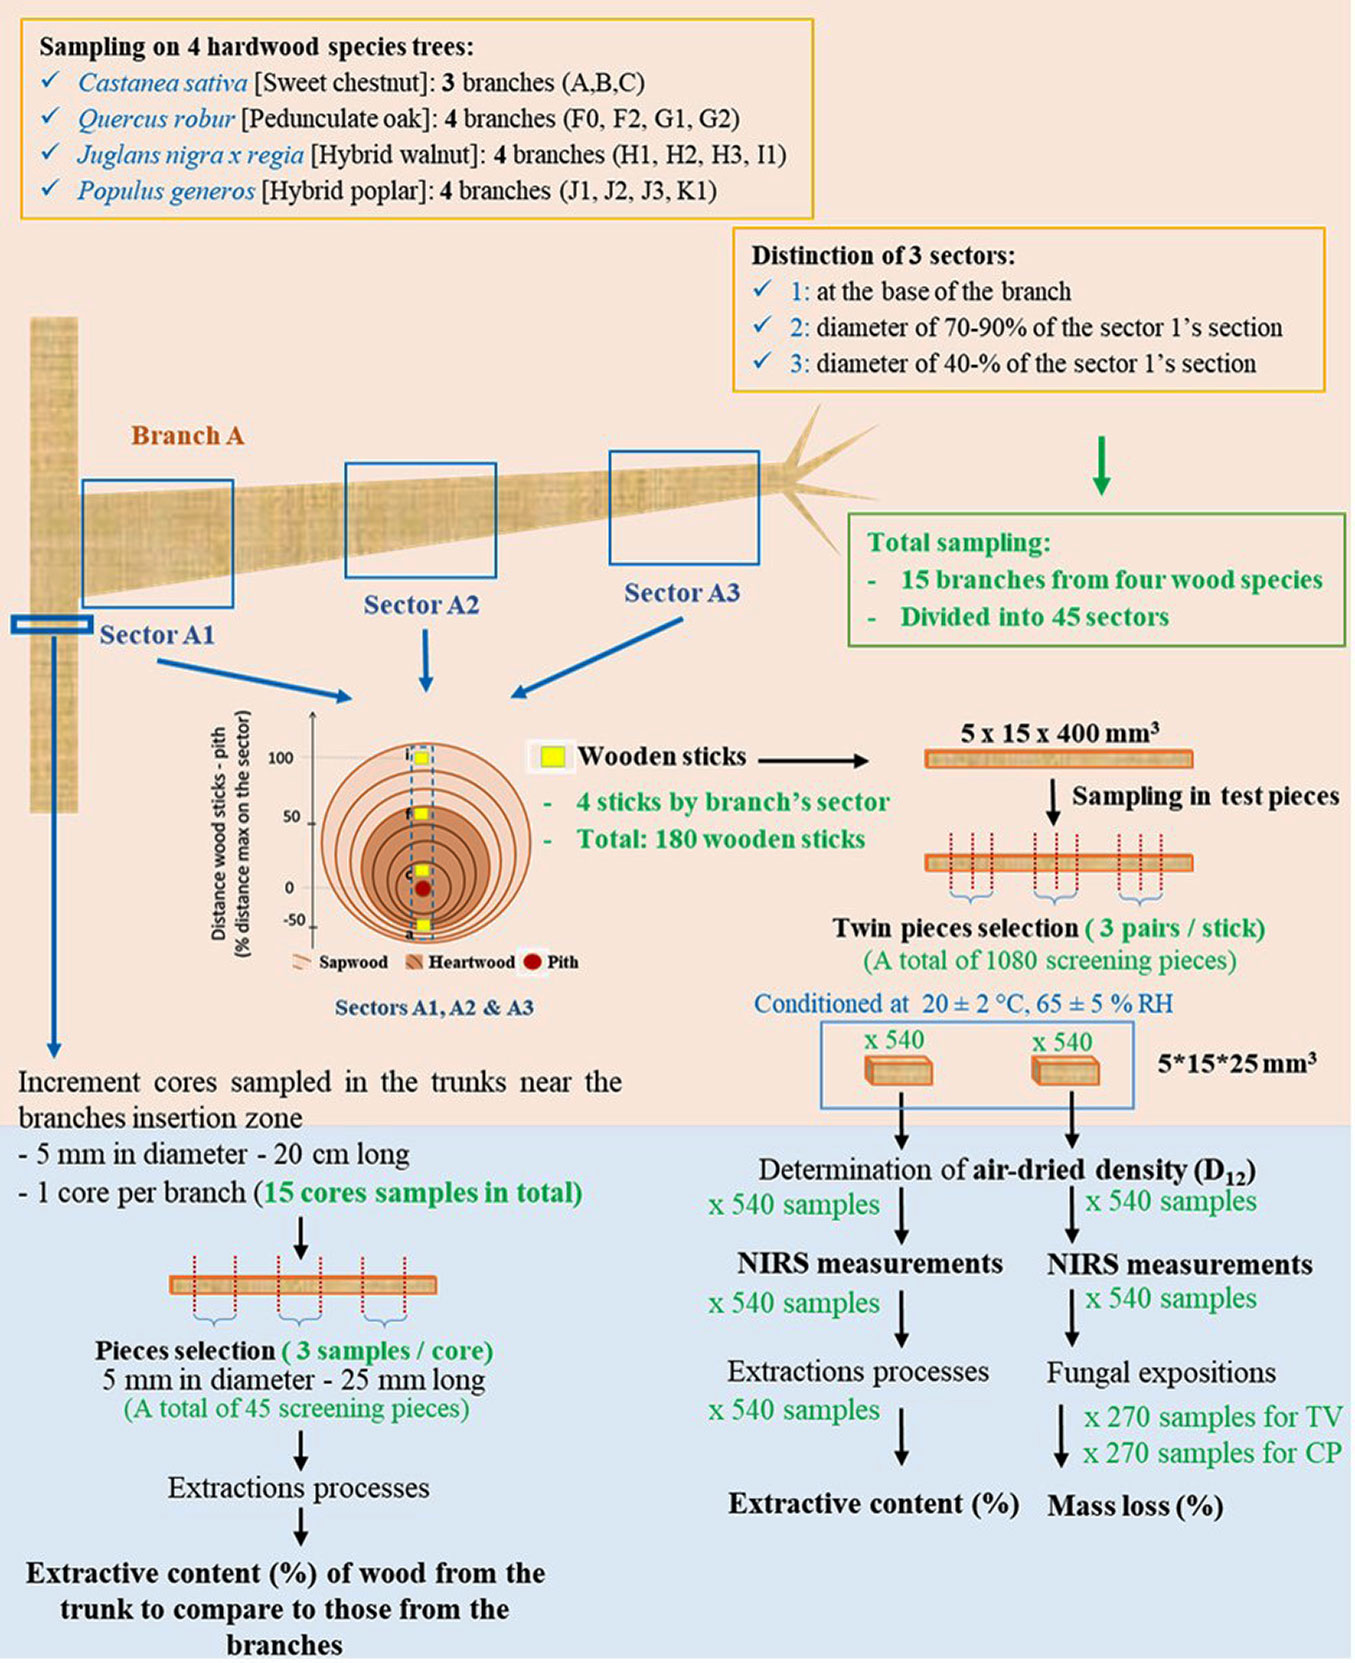
The selected trees were sampled in February 2019 to limit the seasonal impact on wood chemical composition (i.e., starch in sapwood). A total of 9 trees were sampled from which 15 branches were taken (one to three branches per tree). The details are summarized in Fig. 1.
For each species, the harvested branches were split in three sectors according to their distance to the tree trunk. The three branch sectors were defined as follows:
- Sector 1: 100% of the branch diameter at the knot’s level;
- Sector 2: 70-90% ± 3% of the branch diameter at the knot’s level;
- Sector 3: 40-70% ± 5% of the branch diameter at the knot’s level.
A total of 45 branch sectors were sampled. The age of the branch wood is reported in Tab. 1, according to the tree species and the branch sector. Based on these data, we supposed than the majority of wood samples is mainly composed by sapwood portion or sometimes by transition wood, as for example in sector 1 for chestnut.
Tab. 1 - Age of the branch wood according to the position sector in the branch for the four hardwood species.
| Branch Sector |
Age of the branch wood (years) | |||
|---|---|---|---|---|
| Chestnut | Oak | Walnut | Poplar | |
| Sector 1 | 9 ± 1 | 18 ± 4 | 14 ± 2 | 14 ± 5 |
| Sector 2 | 8 ± 1 | 15 ± 2 | 13 ± 1 | 12 ± 5 |
| Sector 3 | 6 ± 1 | 11 ± 1 | 12 ± 1 | 10 ± 4 |
Sample partitioning, conditioning and density measurement
Each of the 45 branch sectors was firstly cut into diametric vertical planks (30 mm width) using a band saw (Fig. 1), taking care of including both normal and tension wood (wherever present). The planks were then cut into wood sticks (15 × 5 mm2) at four radial locations. The wood sticks were then cut into test pieces sized 25 × 15 × 5 mm3 (L: longitudinal; T: tangential; R: radial). These samples were stabilized at a moisture content (MC) of 12% in humid air at 20 °C ± 2 °C and 65 % ± 5 % RH. Air-dried density of samples was determined by weighing and measuring their volume using a vernier caliper, prior to further testing. Overall, 1080 samples were prepared and used as shown in Fig. 1.
In addition, increment cores (5 mm in diameter, 20 cm long) were taken from the trunk of sampled trees near the insertion zone of branches (1 core per branch, totaling 15 cores samples). Each core was cut in three parts (5 mm in diameter, 25 mm long) that were used for extraction (using a protocol similar to that describe below), in order to compare the extractive content of the stem wood to that of the wood from the corresponding branches.
Extraction processes
All experimental procedures used in the determination of the extractive content were adapted, with minor modifications, from Rowell et al. ([45]).
Each sample was dried at 103 °C to determine its initial anhydrous mass (m2) and then extracted in a soxhlet with Toluene : Ethanol (Sigma Aldrich, 32201-M) 2:1 (v:v) solution (2 × 6 h, intercalated by 15 h of maceration in the extraction solvents) following by distilled water (2 × 6 h, intercalated by 15 h of maceration in the extraction solvents), and then dried at 103 °C for 48 h to obtain the anhydrous mass (m3). The wood extractive content (E), in percentage of dry weight (DW), was determined according to the following equation (eqn. 1):
where m2 is the theoretical anhydrous mass of the test piece before extractions and m3 is its anhydrous mass after the extractions. A total of 540 samples were characterized for their extraction rate.
Decay resistance tests
To carry out the durability screening test, the two following decay fungi were used: Trametes versicolor (L.) Lloyd (TV) and Coniophora puteana (Schumach.) P. Karst. (CP), respectively a white rot and a brown rot fungi. These two fungi has been selected because they are mandatory by the XP-CEN/TS-15083-1 ([56]) standard in the determination of natural decay resistance of hardwood species.
Decay tests were performed according to the procedure described by Bravery ([3]). Sterile culture media were prepared with 40 ± 0.5 g of malt extract and 20 ± 0.5 g of powdered agar dissolved in 1 L of distilled water. They were then molded in glass containers, closed by cotton plugs to enable air circulation. The jellified culture media were inoculated with a piece of 1 cm in diameter. Then, the containers were incubated for two weeks in climatic chambers (22 ± 2 °C and 70 ± 5 % RH), until a full colonization of the medium by the mycelium was reached.
Weight and humidity of the conditioned wood block samples were measured to determine their theoretical anhydrous mass (m4), and then sterilized in an autoclave at 121 °C by two successive steps of 20 min, before decay resistance tests. Two hundred seventy test pieces were tested per fungus. The incubation of test pieces was carried out for 8 weeks in a climatic chamber (22 ± 2 °C and 70 ± 5% RH). Once the fungal exposure was completed, samples were carefully cleaned from the fungus. All samples were then oven dried at 103 °C for 48 h and weighed (m5). Mass loss (ML, %) due to the decay degradation of the sample was calculated as (eqn. 2):
The wood durability classes were then attributed according to the XP-CEN/TS-15083-1 ([56]) standard.
Near infrared spectroscopy measurements
Near infrared spectra were obtained in the radial tangential plane of all test pieces, after a stabilization step performed at 20 °C ± 2 °C and 65 % ± 5 % RH. Chaix et al. ([5]) showed that regression models yield accurate predictions when measurements are made on this plane. A Bruker Vector 22/N® spectrophotometer (Bruker Co., Billerica, MS, USA) and the OPUS® software ver. 5.5 were used in diffuse reflectance mode with a sintered gold standard as reference. Data were measured for wavelengths between 9000 to 4000 cm-1 (1100 to 2500 nm), in 8 cm-1 increments. The spectra were composed by 648 wavelengths of reflectance values. Sixteen scans were performed and averaged for each measurement in order to improve the signal-to-noise ratio.
Statistical analysis
Statistical analysis was performed using the software RStudio Desktop® ver. 1.2 (RStudio Inc., Boston, MS, USA). To understand the evolution of the characteristics measured within branches, Kruskall-Wallis tests have been applied on each potential explicative factor and response variable. For each test indicating an effect of a factor on a studied variable, Wilcoxon tests were used to investigate the nature of this effect and the significance of the differences between different groups.
NIRS spectra were first transformed ([38]) with a Standard Normal Variate (SNV) correction to reduce the effect of irregularities of surface and the intra spectrum variability (correction of the light dispersion). The second derivative was then computed using the algorithm of Savitzky Golay with a smoothing range of 21 data points and a third degree polynomial ([49]). The use of this derivative allowed to separate overlapping peaks and correct the baseline deviation of spectra. Mathematical corrections were applied using the software package “prospectr” ver. 0.1.3. NIRS models to predict the density, the extractive contents and the mass loss were developed with the Partial Least Squares (PLS) regression method using the software package “pls”, ver. 2.7.1. No outlier was removed in the models. The data was divided into two sets: a calibration set (2/3 of the total number of samples) and a validation set (1/3). The property values to predict were first sorted and the validation set was built by picking one sample on three. The k-fold cross validation method was used on the calibration set with 10 random segments. The quality of the models was given by computing the following parameters ([38]): the coefficient of determination of calibration (R²C), the standard error of calibration (SEC), the root mean square error of cross validation (RMSECV), the coefficient of determination of calibration (R²P), the root mean square error of prediction (RMSEP), the ratio of performance to deviation (RPD).
Results and discussions
Prediction of the wood density and extractive content by NIRS modelling
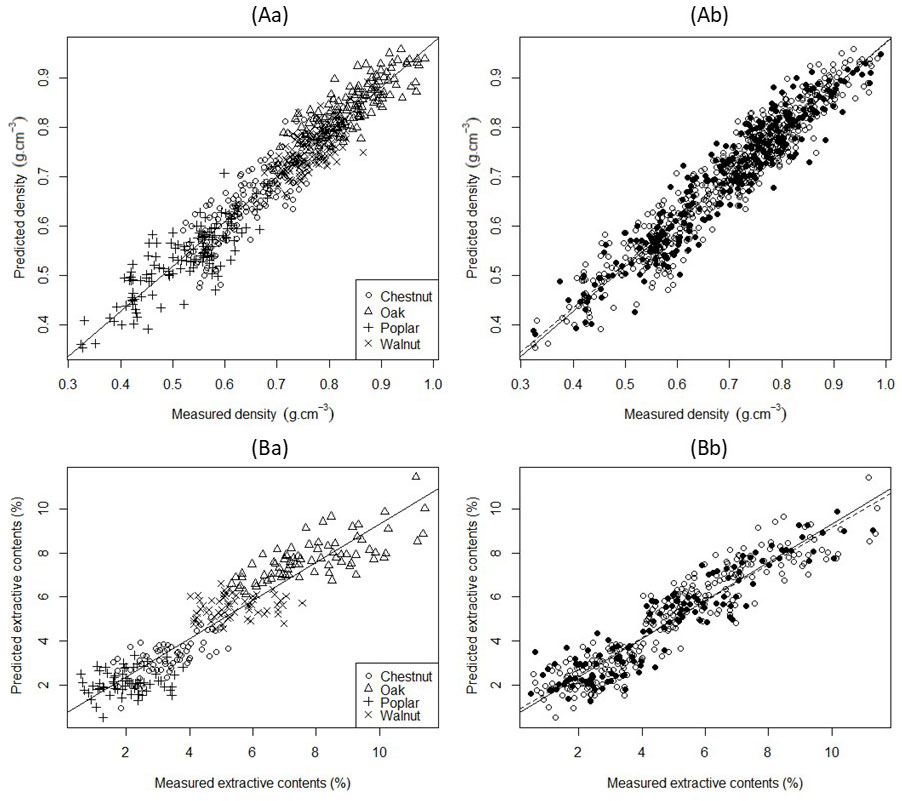
Fig. 2A presents the comparison of the density values predicted by PLS regression with the measured ones. Ten components were selected for the model. The coefficient of determination value was R²C = 0.91 (SEC = 0.04 g cm-3, RMSECV = 0.05 g cm-3) for the calibration set. The predictive performance of the model on the validation set was R²P = 0.89, with a RMSEP value of 0.05 g cm-3. The values of SEC, RMSECV and RMSEP were sufficiently close and showed that the model was robust. The value of the ratio of performance to deviation was RPD = 3.0, highlighting that this model was suitable for predictions ([55]). These results were in agreement with previous published studies ([17], [50], [35], [22], [29]). Schimleck et al. ([50]) showed that it was possible to accurately calibrate NIR models for a wide range of species that represent different taxa, wood chemistry and physical properties. NIR absorbance spectra are related to the chemical composition of the tested wood sample ([29]). The NIR spectroscopy technique is usable in assessing wood physical properties (including density) because these properties vary with the chemical properties within a tree, but also because the infrared light contains information of chemical components (light absorption) associated with physical characteristics (light scattered) like surface texture or porosity ([4], [51], [47]).
Fig. 2 - Relationship between measured and predicted density (A) and branch wood extractive content (B) by NIRS modelling. (a) Calibration set with different marks by species; (b) calibration and validation set (white circle: calibration set; black circles: validation set). Continuous lines represent regression lines, while dotted lines are the identity lines (y = x).
Fig. 2B shows the result of the PLS regression to predict the extractive contents. The model was built with 7 components, and the R²C value was 0.86 (SEC = 0.95% and RMSECV = 1.05%) for the calibration set. The coefficient of determination for the validation set was R²P = 0.85, with a RMSEP value of 0.96%. As with density, this model was found to be robust, and the value of the ratio RPD was 2.6. Investigations on wood chemical composition, specifically on extractive contents, using NIR were previously reported ([33], [13], [16], [54], [44]). Our results are in agreement with the findings of the aforementioned studies. Wood extractives include heterogeneous groups of chemical compounds, and they can be grouped by the type of solvent used during their extraction ([16], [44]). Gierlinger et al. ([16]) developed NIR models on wood powder and on solid wood to determine the hot water and acetone extractive content of Larix sp. The authors stated that the solid wood models were less predictive than those derived from wood powder because additional factors, such as the varying wood structure (e.g., earlywood vs. latewood within annual rings), sample geometry or surface properties, might add to the existing complex chemistry. The characteristics of the models related to solid wood were R²P = 0.74 (RMSEP = 1.88%) for the hot water extractives contents, and R²P = 0.78 (RMSEP = 0.36%) for the acetone extractive content. A multi-species model was developed by Razafimahatratra et al. ([44]) to determine the ethanol-toluene extractive contents with a portable spectrometer. The main characteristics were a coefficient of determination of cross validation of 0.64 and a RMSECV value of 1.54%. The authors reported that the quality of the model was linked to the restricted spectral range and resolution of the portable spectrometer. The quality of the model might also have been the result of mixing of different chemical signature between species, adding to quantitative variations of composition within each chemical signature in each species.
Predictability of the fungal durability by NIRS modelling
Wood degradation is a topic of high interest in NIR wood research because it allows the detection of chemical changes as spectral variation ([54]). Fackler & Schwanninger ([14]) used NIR spectroscopy to investigate the overtones of C-H and O-H stretching vibrations; in particular, to better understand degradation processes of lignin, cellulose and hemicelluloses during brown rot. The mass losses induced by brown rots (Coniophora puteana, Gloeophyllum trabeum) and a white rot (Trametes versicolor) were predicted by NIRS measurements on Sequoia sempervirens (D. Don) Endl. samples ([24]). The spectra were acquired on the radial-longitudinal face of wood blocks. The authors found RPD ratios in cross-validation between 1.3 to 1.4, and stated that the models could be used to separate the heartwood for high and low values of mass loss with fungal decay testing. Sykacek et al. ([53]) investigated the natural durability of Larix spp. using the test fungi Gloeophyllum trabeum and Coniophora puteana. The authors obtained a coefficient of determination from cross validation of 0.93 and a RMSEP value of 3.3% for Coniophora puteana (with radial surface tests and a second derivative pre-processing).
In the present study, the regression coefficients between the data predicted by NIRS models and the observed data are very low when all the species are considered together (0.43 and 0.53 for TV and CP, respectively). The white rot induced mass loss is approached with a precision of ± 11% of the dry weight, and the brown rot induced mass loss with a precision of ± 7%. Those precision levels are insufficient to reliably determine the durability classes of the wood. In that case, the NIRS models cannot be used to build reliable prediction models of the white and brown rot induced mass losses.
NIRS provides measures directly linked to the chemistry of the wood since it measures chemical bonds. As a consequence, it is expected that reliable models could be built to accurately assess the wood biochemical composition (i.e., extractive content) and its density, which is strongly correlated to this first variable. Although wood extractives and density are often correlated with wood durability, the NIRS models do not accurately predict the decay resistance of branch wood. The chemical composition of the extractive fraction of wood (chemical signature) largely depend on the woody species and this could explain the difficulty to build an accurate NIRS models to predict the fungal durability of wood.
Variability of branches wood air-dried density
Variations between branches
The wood density of branches appeared different both among and within species. Oak branches wood (0.76 ± 0.06 g cm-3) resulted to be denser than walnut (0.68 ± 0.04), chestnut and poplar wood (0.59 ± 0.07 and 0.48 ± 0.07 g cm-3, respectively). Regarding the oak samples, the wood densities of the branches F0 and F2 (0.78 ± 0.04 and 0.80 ± 0.06 g cm-3, respectively) significantly differed from those of the branches G1 and G2 (0.74 ± 0.04 and 0.72 ± 0.06 g cm-3, respectively) after the Wilcoxon tests, while there are no significant density variations between the branches of the oak F or between those of the oak G. Likewise, the chestnut branches of the trees A and C, and the poplar branches of the trees J and K all displayed significantly different densities. This intra-species density variation was not detected for walnut trees. For the studied species, the wood density was similar for all the branches within a single tree.
Variations inside branches
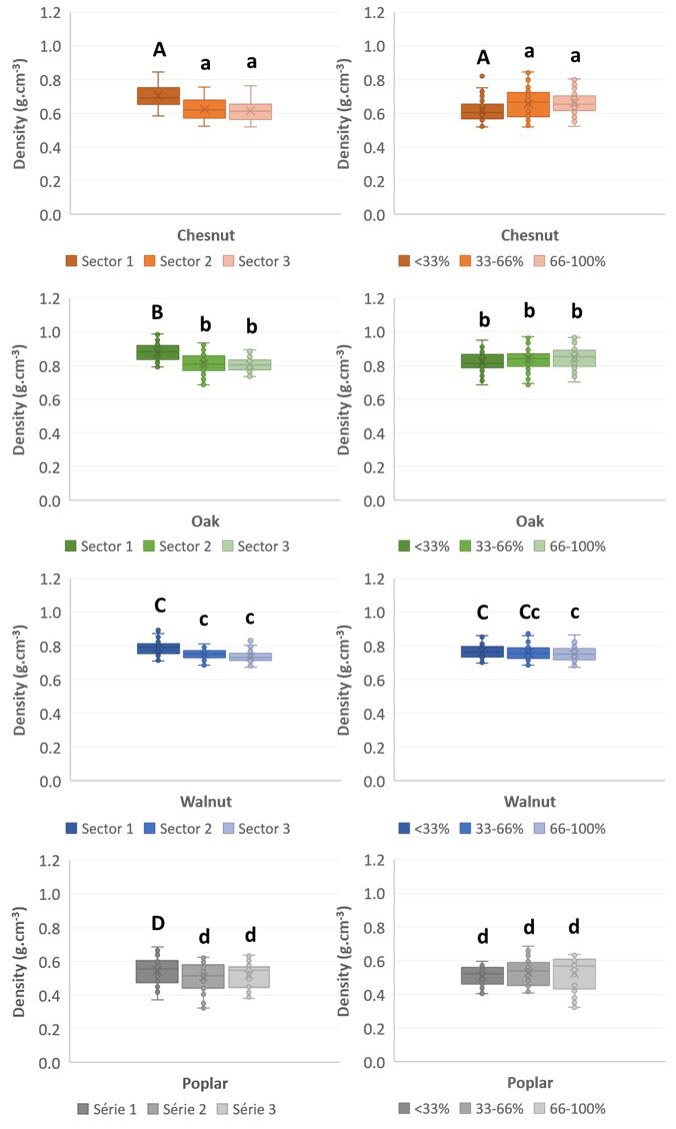
Within a branch, the wood density varied with the location of the wood. Fig. 3 shows that the variation of wood density with the distance from the trunk depends on the species. Unless for poplar, the wood that was closest to the trunk (sector 1: 0.67 ± 0.13 g cm-3 on average) showed a significantly higher density than woods located further away from it (sectors 2 and 3: 0.61 ± 0.12 and 0.61 ± 0.11 g cm-3 on average, respectively). Concerning the radial location of the wood (Fig. 3), it appeared that the wood density of chestnut and poplar branches increases with the distance to the pith: the closest to the bark, the denser the wood is. The same tendency can be observed for oak, but neither for it nor for walnut wood does the distance to the pith significantly affect the density. It is rather clear that the variation in wood density along the radius is very different among species. For example some wood species like Dicorynia guianensis Amshoff show nearly no variations, while Parkia nitida Miq. has a density variation from 0.2 to 0.5 between pith and bark, within the trunk ([30]).
Fig. 3 - Mean density of branch wood in four hardwood species as a function of the distance to the trunk (left column) and to the pith (right column). Bars followed by the same letter are not significantly different.
Overall, branch wood density significantly decreases with the distance to the trunk and significantly increases with the distance to the pith. For all the considered species, the wood density is quite similar between trunks and branches but this point is to be confirmed with specific trials. Sarmiento et al. ([48]) highlighted that trunk and branch xylem densities of various French Guiana tree species were significantly and positively correlated with radial and longitudinal position within the branch or the trunk.
Branch wood density decreases when the distance to the trunk increases (Fig. 3). The fact that the sections of wood furthest from the trunk likely contain more juvenile wood than those closest to the trunk could explain this phenomenon. Gryc et al. ([18]) and Latorraca et al. ([28]) showed that the juvenile wood of 115 old-grown Norway spruce (Picea abies Karst.), 98 old-grown Scots pine (Pinus sylvestris L.) and 80 old-grown European larch (Larix decidua Mill.) from the Czech Republic and 14 old-grown Black locust (Robinia pseudoacacia L.) trees from different forest sites in Eastern-Germany and Eastern Hungary, is produced during the first five year of life of the tree and it is less dense, less rich in extractives and less durable than mature wood which is produced later. However, such tendency is not so clear for all species and all growing conditions. There are very few evidence of typical variations in extractive content associated to juvenility, mainly because the deposition of extractives in the heartwood occurs much later than the thickening of the cell walls. On old trees with good durability, the resistance to rot is often much lower near the pith but this is mostly due to the age of the heartwood and its extractives near the pith. In addition, the wood density is related to the tree structure ([2]) and the trunk/branch junction has to be strong and resistant to degradation, with mechanical stresses very different from the trunk, due to the inclined growing of the branch.
The studied wood characteristics also present a radial pattern within branches that follows the same pattern as within trunks. McLean et al. ([32]) noticed in tropical woods growing in dense forests that the wood density increases with its distance from the pith, but this is not true for the same species growing in open conditions like in plantations. Our result suggest that the same pattern is to be found on branch wood, as the average wood density next to the pith is significantly lower than that recorded at the distal end of the branch.
Variability of extractive contents of branch woods
Variation among branches
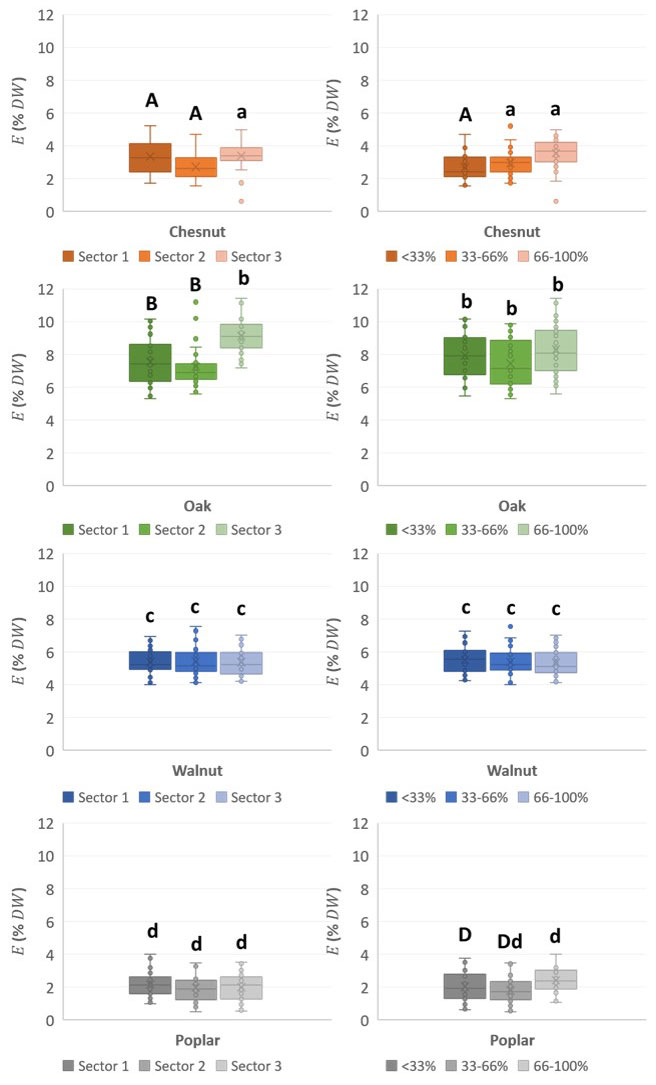
As shown in Fig. 4, the wood extractive contents were the highest in oak branches and slightly lower in walnut branches, while being still significantly higher in these than in poplar and chestnut branches. Within species, the extractive content of branch wood did not significantly differ, neither among the same trees nor among different trees. Considering all species, the extractive content seems to be lower in the branches than in the knots and even than in the trunk (Tab. 2), according to the findings of Kebbi-Benkeder ([25]). This tendency has been confirmed in oaks and walnuts in this study. The extractive content has been evaluated on increment cores sampled in the trunk near the branch insertion zone and in the sapwood area (near the bark). On average, oak branches contained 7.9 ± 1.5% of extractives and their corresponding samples from the nearby trunk contained 10.6%. Walnut branches contained 5.4 ± 0.9% of wood extractives while their trunk had 7.62%. Chestnut and poplar branches were the poorest in wood extractives as they only contained 3.2 ± 0.9% and 2.0 ± 0.8% of those, respectively.
Fig. 4 - Mean extractive content of branch wood in four hardwood species as a function of the distance to the trunk (left column) and to the pith (right column). Bar followed by the same letter are not significantly different.
Tab. 2 - Mean content of wood extractives (% dry weight) in the knots and clear heartwood of the four hardwood species (from [25] and *[42], [43]).
| Component | Chestnut | Holm Oak | Walnut | Poplar* |
|---|---|---|---|---|
| Knots (average of young, mild, old knots) | 17.4 | 14.2 | 10.9 | < 10 |
| Trunk heartwood | 10.3 | 12.7 | 13.3 | < 7 |
| Trunk sapwood | 7.3 | 9.3 | 6.3 | - |
Variation within branches
Oak and chestnut extractive rates tended to increase with distance from the trunk (Fig. 4), but this tendency was only significant between the group of the two first sectors and the last one and did not appear in the case of walnut and poplar branches. In the radial direction, chestnut and poplar showed a slight but significant increase of extractive rates with the distance from the pith of the branches (Fig. 4). Such an evolution did not appear in the case of walnut and oak wood, which had the same extractive content level in the three radial positions. Globally, the variation of extractive contents linked to the distance from the pith is quite low and never exceed +1%.
Pooling the data of the four hardwoods species altogether, it appeared that the distance to the trunks did not significantly impact on the wood extractive contents. However, the radial locations of the wood in the branch did slightly differ in extraction contents, which increased when approaching the bark (5.3 ± 2.5%), perhaps showing a bark neighborhood effect, as the bark is usually rich of extractives. In addition, there are strong differences in extractives in the sapwood, which can be due to nutrients like starch with high levels of variation depending on the season, and in the heartwood where extractives are mainly defense products with no significant variation among seasons.
Variability of fungal decays of branch woods
White rot (Trametes versicolor - TV)
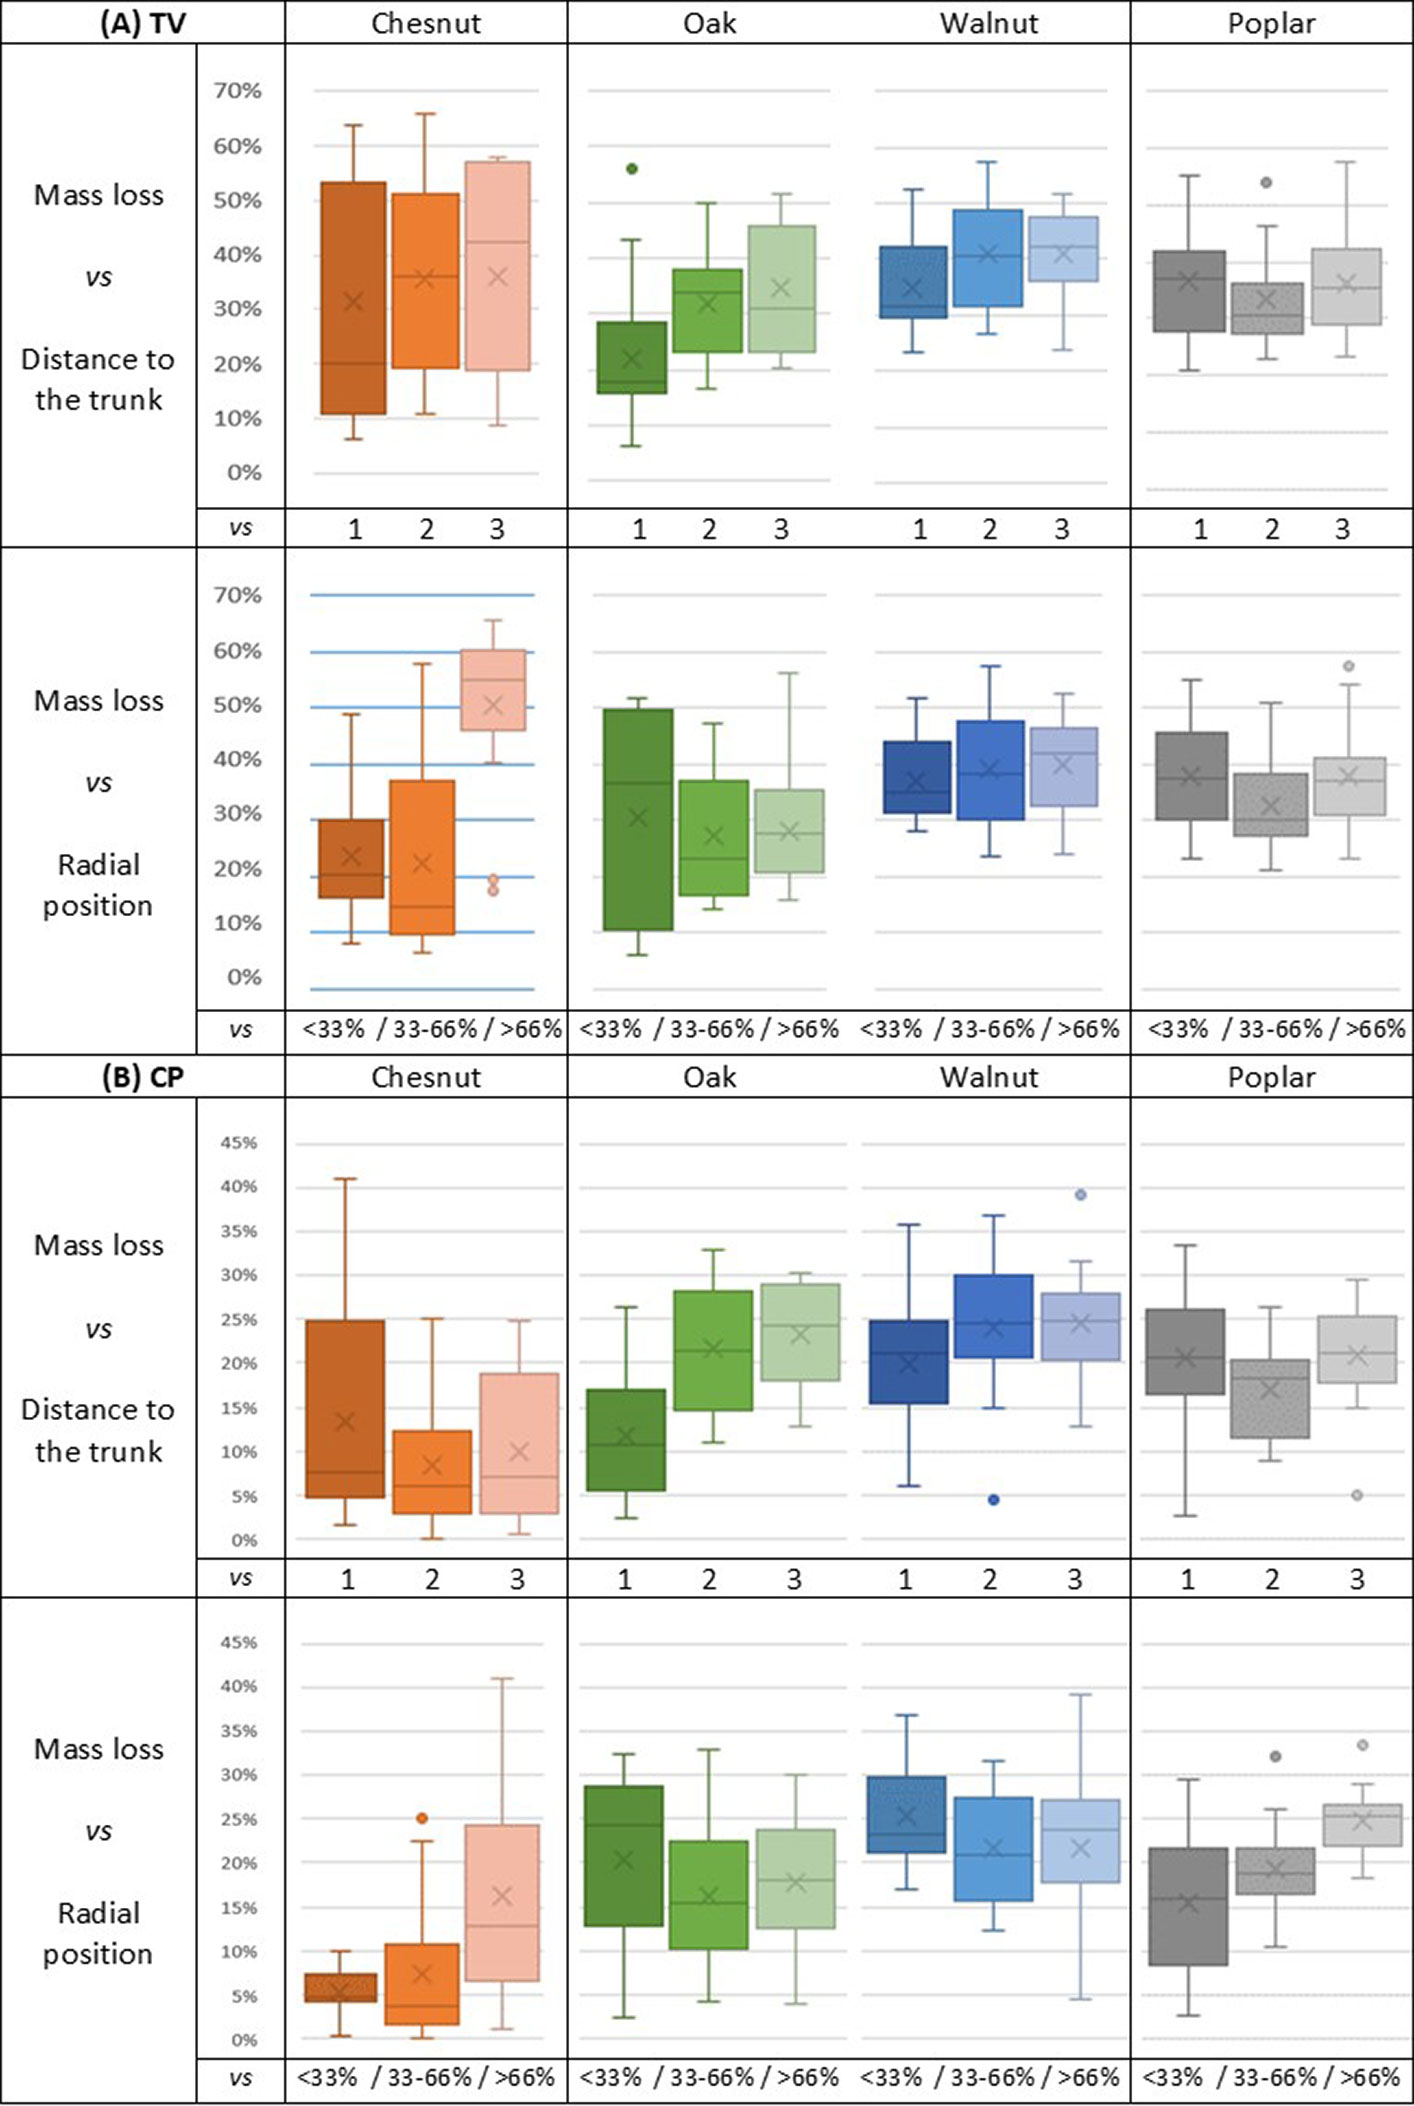
Wood mass loss induced by white rot showed a large variation (Fig. 5A). Walnut wood showed the highest range of values (median value of 39.0%), followed by poplar (median value of 35.4 %) and chestnut (median value of 34.4%) then oak (median value of 28.2 %), which was in this case the most durable wood.
Fig. 5 - Natural durability of branch wood exposed to (A) Trametes versicolor (L.) Lloyd. and for (B) Coniophora puteana (Schumach.) P. Karst. (1, 2, 3): position of the wood sample along the branch, in order of increasing distance from the trunk (see text for further details). (<33, 33-66, >66%): radial position of the wood sample within the branch diameter, in order of increasing distance from the pith.
According to wood durability classes regarding white rot (Tab. 3), it seems that for all wood species, the durability of heartwood and sapwood from branches was particularly lower than that recorded for the trunk heartwood.
Tab. 3 - Mean values and standard deviations (SD) of mass loss due to fungal degradation and the associated wood durability classes (according to [56]) against Trametes versicolor (L.) Lloyd (TV) and Coniophora puteana (CP) and comparison with the durability class of trunk wood from similar woody species (*: [6], [7], [8], [9]).
| Wood origin |
Parameter | Species | |||
|---|---|---|---|---|---|
| Chestnut | Oak | Walnut | Poplar | ||
| Branches | Mean Mass loss due to TV (%) | 34.4 | 28.2 | 39.0 | 35.4 |
| SD Mass loss due to TV (%) | 0.2 | 0.1 | 0.1 | 0.1 | |
| Durability class - TV | 5 | 4 | 5 | 5 | |
| Mean Mass loss due to CP (%) | 10.4 | 17.7 | 22.60 | 19.5 | |
| SD Mass loss due to CP (%) | 0.1 | 0.1 | 0.1 | 0.1 | |
| Durability class - CP | 3 | 4 | 4 | 4 | |
| Durability class | 5 | 4 | 5 | 5 | |
| Trunk | Durability class (CIRAD*) | 2 | 2 | 3 | 3 |
Brown rot (Coniphora puteana - CP)
A tendency similar to that observed with TV can also be detected with CP (Fig. 5B), mainly in oak (except for the wood near the pith) and chestnut wood; indeed, we found a decrease of durability when the ratio of sapwood grows (Fig. 5B). Pooling the data obtained for all the species, the distance to the trunk significantly affected the wood durability, which is in contrast with what observed when the radial position was considered (Fig. 6).
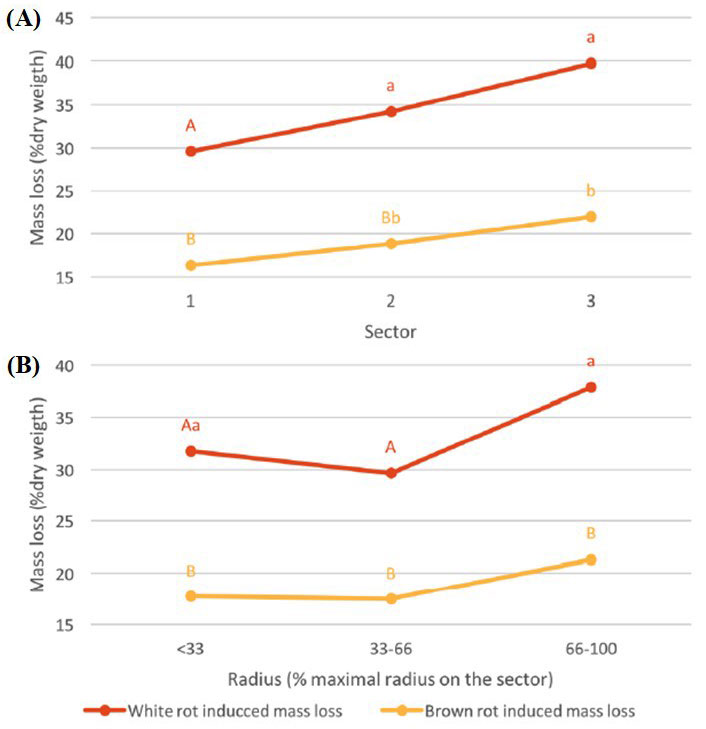
Fig. 6 - Median mass loss (% of dry weight) of branch hardwood, depending on the infecting fungi and the distance to the trunk (A) and to the pith (B). Values followed by the same letter are not significantly different.
Wood durability tended to decrease from the trunk to the branch extremity and from the pith to the bark. This trend mainly concerned chestnut and walnut, and is likely due to the higher ratio of sapwood when moving from the trunk to the branch ends or from the pith to the bark. When the data obtained for all the four species were pooled, the distances to the trunk and to the pith had a significant effect on branch wood durability (Fig. 6).
Globally, the durability of the four hardwoods regarding brown rot fungi was higher than that towards white rot fungi, which is consistent with previous findings reported in the literature ([52]). Overall, the averages of mass loss were 17.6% and 34.2% for CP and TV, respectively. Walnut was always the less durable species, whilst oak the more durable to white rot and chestnut the more resistant to brown rot.
Our results showed that the coefficient of variation is higher for extractive contents than for density in almost every case. This was expected to some extent, as the variation of mass loss due to degradation is linked to both the chemical variation in the nature and the content of extractives and to the action of the fungi itself. Therefore, even for wood from the same tree with very similar chemical composition, rather large CV values can be observed.
The large dispersion of ML values could be due to the wide range of diameters and ages of the branches sampled in this study. The durability screening tests ideally require the presence of several growth rings on a single sample and the test pieces were often too small to meet this requirement, which can lessen the precision of the results. Further, the measures were based on the dry weight of wood samples and, with a thickness of 5 mm only, it is possible that the sole manipulation of the test pieces altered their relative humidity, thus introducing a bias in the observed results.
Conclusion
This study provides new knowledge on branch wood from agroforestry systems, which are still under-studied so far. The results obtained highlight the evolution and variability of the physical and chemical characteristics of branch wood from agroforestry hardwoods. As reported by previous studies, wood density was quite similar in branches and in trunks. Indeed, the wood density along the branches decreased with the distance to the trunk and slightly increased with the distance to the pith. A similar pattern was observed for the extractive content of wood, but at a much lower level in branches than in trunks. According to the literature, also wood durability of the four hardwood species was much lower in branches than in trunks, but it seemed to decrease with the distance to the trunk and the pith. These last observations should be considered cautiously and additional experiments with bigger test pieces should be done to consolidate these conclusions. Ultimately, this study did not reveal any manifest suitability of branch wood from agroforestry practices for green chemistry, because of the quite low extractive ratios. However, further studies on the composition of wood extractive might throw light on the possible existence of molecule of interest in branch wood. Although woods from trunk and branches have a similar chemical signature for each given species, the content level of some chemical compounds may be higher in the branches than in the trunk. Furthermore, wood density in branches is equivalent to that of trunks, which suggest similar mechanical characteristics. This support the hypothesis that branch wood has an unused potential, in particular to manufacture biomaterials. Yet, the low extractive content and low durability levels of branch wood hamper its use in outdoor conditions. However, the wood of branches of these agroforestry species can be implemented as structural material in use classes 1 and 2, and 3 depending on the species, permeability and final use.
Acknowledgements
This work was financially supported by the French Environment and Energy Management Agency (ADEME) within the frame of the AGROBRANCHE (2018-2021) project (“Study of the valuation of branches in agroforestry for bio-based materials and green chemistry”).
References
Gscholar
Gscholar
Online | Gscholar
Gscholar
Online | Gscholar
CrossRef | Gscholar
Gscholar
Gscholar
Online | Gscholar
Gscholar
Gscholar
Online | Gscholar
Gscholar
Gscholar
Gscholar
Authors’ Info
Authors’ Affiliation
Loic Brancheriau 0000-0002-9580-7696
Nabila Boutahar
Sylvain Lotte
Daniel Guibal
Luc Pignolet
Kevin Candelier
CIRAD, Research Unit BioWooEB, 34000, Montpellier (France)
Loic Brancheriau 0000-0002-9580-7696
Nabila Boutahar
Sylvain Lotte
Daniel Guibal
Luc Pignolet
Kevin Candelier
BioWooEB, Université de Montpellier, CIRAD, Montpellier (France)
“Arts et Metiers” Institute of Technology, LABOMAP, HESAM University, F-71250 Cluny (France)
Corresponding author
Paper Info
Citation
Terrasse F, Brancheriau L, Marchal R, Boutahar N, Lotte S, Guibal D, Pignolet L, Candelier K (2021). Density, extractives and decay resistance variabilities within branch wood from four agroforestry hardwood species. iForest 14: 212-220. - doi: 10.3832/ifor3693-014
Academic Editor
Luigi Todaro
Paper history
Received: Nov 09, 2020
Accepted: Mar 01, 2021
First online: May 02, 2021
Publication Date: Jun 30, 2021
Publication Time: 2.07 months
Copyright Information
© SISEF - The Italian Society of Silviculture and Forest Ecology 2021
Open Access
This article is distributed under the terms of the Creative Commons Attribution-Non Commercial 4.0 International (https://creativecommons.org/licenses/by-nc/4.0/), which permits unrestricted use, distribution, and reproduction in any medium, provided you give appropriate credit to the original author(s) and the source, provide a link to the Creative Commons license, and indicate if changes were made.
Web Metrics
Breakdown by View Type
Article Usage
Total Article Views: 38737
(from publication date up to now)
Breakdown by View Type
HTML Page Views: 31646
Abstract Page Views: 3311
PDF Downloads: 3088
Citation/Reference Downloads: 5
XML Downloads: 687
Web Metrics
Days since publication: 1736
Overall contacts: 38737
Avg. contacts per week: 156.20
Article Citations
Article citations are based on data periodically collected from the Clarivate Web of Science web site
(last update: Mar 2025)
Total number of cites (since 2021): 7
Average cites per year: 1.40
Publication Metrics
by Dimensions ©
Articles citing this article
List of the papers citing this article based on CrossRef Cited-by.
Related Contents
iForest Similar Articles
Research Articles
Comparison of extractive chemical signatures among branch, knot and bark wood fractions from forestry and agroforestry walnut trees (Juglans regia × J. nigra) by NIR spectroscopy and LC-MS analyses
vol. 15, pp. 56-62 (online: 08 February 2022)
Research Articles
Physical, chemical and mechanical properties of Pinus sylvestris wood at five sites in Portugal
vol. 10, pp. 669-679 (online: 11 July 2017)
Research Articles
Physical and mechanical characteristics of poor-quality wood after heat treatment
vol. 8, pp. 884-891 (online: 22 May 2015)
Research Articles
Characterization of VOC emission profile of different wood species during moisture cycles
vol. 10, pp. 576-584 (online: 08 May 2017)
Research Articles
NIR-based models for estimating selected physical and chemical wood properties from fast-growing plantations
vol. 15, pp. 372-380 (online: 05 October 2022)
Research Articles
Identification of wood from the Amazon by characteristics of Haralick and Neural Network: image segmentation and polishing of the surface
vol. 15, pp. 234-239 (online: 14 July 2022)
Research Articles
Acoustic evaluation of wood quality with a non-destructive method in standing trees: a first survey in Italy
vol. 10, pp. 700-706 (online: 17 July 2017)
Research Articles
Examining the evolution and convergence of wood modification and environmental impact assessment in research
vol. 10, pp. 879-885 (online: 06 November 2017)
Research Articles
Mechanical and physical properties of Cunninghamia lanceolata wood decayed by brown rot
vol. 12, pp. 317-322 (online: 06 June 2019)
Research Articles
The potential of using xylarium wood samples for wood density calculations: a comparison of approaches for volume measurement
vol. 4, pp. 150-159 (online: 11 August 2011)
iForest Database Search
Search By Author
Search By Keyword
Google Scholar Search
Citing Articles
Search By Author
Search By Keywords
PubMed Search
Search By Author
Search By Keyword

