
NIR-based models for estimating selected physical and chemical wood properties from fast-growing plantations
iForest - Biogeosciences and Forestry, Volume 15, Issue 5, Pages 372-380 (2022)
doi: https://doi.org/10.3832/ifor4030-015
Published: Oct 05, 2022 - Copyright © 2022 SISEF
Research Articles
Abstract
As a faster, reliable, and low cost technique, applicable to large samplings, near infrared (NIR) spectroscopy technology has been widely applied for high-throughput phenotyping in forest breeding programmes. The aim of this study was to develop multivariate models for estimating the chemical and physical properties of juvenile wood based on NIR signatures of milled wood. Moreover, two approaches, namely, external validation by clone and by age, were tested to validate the model for estimating extractive content. NIR spectra of wood specimens taken from three clones of Eucalyptus urophylla (one to six years old) grown in southern Brazil were used to calibrate and validate models for predicting the wood basic density, total extractives, ash content, holocellulose content, syringyl to guaiacyl ratio (S/G) and elementary components of the wood. PLS-R models were validated by an independent set of wood specimens and presented promising statistics for the estimating wood density (R2p = 0.768), extractives (R2p = 0.912), ash (R2p = 0.936) and carbon (R2p = 0.697) contents from NIR signatures measured in the milled wood of young trees. Furthermore, NIR models for estimating the extractive content of wood were validated using the clones or ages left out of the training sets. Most models presented satisfactory statistics (R2 > 90%) and could be applied to routine laboratory analyses or to select potential trees in Eucalyptus breeding programmes.
Keywords
Near Infrared, Wood Analysis, Predictive Models, Wood Powder, Eucalyptus, Multivariate Analysis
Introduction
Notably, Brazil is one of the largest producers and consumers of charcoal in the world ([12]) with the potential to increase its production. Charcoal is widely used as an agent to reduce iron ore to produce “green steel” in industrial blast furnaces. The strategy to increase charcoal production and quality is to use wood from fast-growing plantations as a biomass source. In tropical regions, such as Brazil, Eucalyptus trees demonstrate rapid growth, produce wood of adequate quality (density of 500 to 600 kg m-3) and present a short cutting cycle (5-6 years); therefore, it is a strategic raw material for private, scientific and governmental sectors.
In addition to growth characteristics, resistance to pests and water stress, as well as several intrinsic characteristics of wood must be considered to select genetic materials with potential to increase productivity and wood quality. According to Protásio et al. ([32]), Eucalyptus clones that produce wood with higher lignin, acetone soluble extractive contents and lignin with a greater amount of guaiacyl structural units may be selected to enhance charcoal production. Thus, the identification of genetic materials based on such characteristics optimizes charcoal quality and meets industry requirements ([31]).
The conventional methodology to characterize wood biomass is destructive and requires felling trees to obtain wood specimens, and then time-consuming laboratory procedures are carried out to determine the physical and chemical properties of the wood specimens. Moreover, this method is generally very costly due to the need to transport wood pieces (discs, stems) from forests to the laboratory. Forest breeders demand fast solutions to classify wood quality in large samplings, preferably from standing trees, to select the most promising materials and designate them to breeding programmes.
Near infrared (NIR) spectroscopy has been applied to overcome this challenge. The technique has proven to be an efficient tool in breeding programmes for material selection involving a large number of trees ([37]). NIR is a fast (1 min or less) and accurate solution (a high correlation between actual and estimated values) and is applicable to a large number of samples ([26]). Several studies have been developed to evaluate wood properties based on their NIR signature ([41]), and this approach can be used for material selection in breeding programmes and genetic studies ([15]). Multivariate models have been developed to estimate the content of extractives and lignin ([44], [11]), carbohydrates ([44], [11], [34]), ash ([44]), the syringyl/guaiacyl ratio (S/G - [18]), glucose, xylose, galactose, arabinose, and mannose ([18]), and the wood density ([9], [43], [7], [21]).
Most of the studies involving NIR and wood characterization have been carried out using spectra recorded from solid wood. However, few studies have evaluated the performance of models developed from milled wood, as it can be collected from trees using a handheld drill without harvesting them. Moreover, most predictive models depend on the age of trees. Here, we developed multivariate models based on representative NIR spectra recorded from wood powder of an entire tree to predict the chemical and physical properties of wood. Moreover, we tested two approaches, namely, external validation by clone and by age, to validate the model for extractive estimation. The objective is to validate robust and reliable predictive models for estimating the chemical and physical properties of wood based on NIR signatures taken from milled wood samples regardless of the clone or the age of the tree.
Material and methods
Sampling material
Three Eucalyptus urophylla clones from commercial plantations (plantation spacing: 9.0 m2) of the company Plantar located in the municipalities of Curvelo and Felixlndia (Minas Gerais State) in southern Brazil were used in this study (Tab. 1). Five trees were randomly selected and sampled. Each selected tree represents the average diameter by age.
Tab. 1 - Identification of the genetic material used.
| Clone | Age (yrs) | City | Location |
|---|---|---|---|
| 1 | 1, 4, 5, 6 | Curvelo | 18°42′ S 44°33′ W |
| 1 | 2, 3 | Felixlndia | 18°46′ S 44°53′ W |
| 2 | 1 to 6 | Curvelo | 18°42′ S 44°33′ W |
| 3 | 1, 2 | Felixlndia | 18°46′ S 44°53′ W |
| 3 | 3 to 6 | Curvelo | 18°42′ S 44°33′ W |
Seven discs were selected from each tree corresponding to 0%, 2%, 10%, 30%, 50%, 70% and 100% of the commercial height of the stem. The commercial height was defined up to a minimum diameter of 4.0 cm with bark. Two opposite wedges (knot free) were removed from discs to determine the basic density, whereas the remaining wedges were milled for chemical analysis of the wood and for recording NIR signatures.
Chemical analyses
For all chemical analyses, composite wood samples were used, that is, one sample per tree with material from all longitudinal sampling positions. In elementary chemical analyses, oven dry sawdust was selected in overlapping screens of 200 and 270 meshes, using the fraction removed in the latter. In structural chemistry analyses, the fraction retained between the 40 and 60 mesh sieves was used.
Tab. 2lists the reference analyses carried out to characterize wood samples and to perform the calibration and validation of NIR models.
Tab. 2 - Analysis of wood properties. (H): hydrogen content; (N): nitrogen content; (S): sulfur content; (O): oxygen content.
| Analysis | Procedure |
|---|---|
| Basic density (BD) | NBR 11941 ([1]) |
| Nitrogen (N) | ASTM E870-82 ([4]) |
| Carbon (C) | C = 100 - H - N - S - O - ASH |
| Extractives content (EXT) | TAPPI T280 pm-99 ([39]) |
| Syringyl/guaiacyl ratio (S/G) | Lin & Dence ([22]) |
| Ash content (ASH) | NBR 13999 ([2]) |
| Holocellulose content (HOLO) | HOLO = 100 - total lignin - EXT - ASH |
NIR spectra measurements
NIR spectra were recorded using a Fourier transform spectrometer (MPA, Bruker Optik GmbH, Ettlingen, Germany) in diffuse reflection mode in conjunction with the software program OPUS v. 7.5. Spectral signatures were measured between 12500 and 3600 cm-1 with a resolution of 8 cm-1 using an integrating sphere, but only the 9000 to 4000 cm-1 range was used for analysis. A gold standard was used as a reference, using 16 scans, before spectra were collected in the wood powders.
The discs of each tree were grounded and mixed. Wood powder samples represented an entire tree. Only the fraction retained between 40 and 60 mesh sieves was used for recording NIR spectra. The powder was stored in an appropriate vial, and 16 scans were taken for each spectrum. The mean of two NIR spectra per tree/powder sample was calculated and used for regression analysis. Spectra were recorded in an acclimatized room with a temperature of approximately 20 °C and relative humidity of approximately 65%. Under these conditions, the equilibrium moisture of the wood powders reached approximately 12%.
Development of NIR-based models
The spectral data were correlated with the basic density and chemical properties of wood by partial least squares regression (PLS-R) using the software Chemoface v. 1.63 ([23]). The matrix was composed of the reference values of the chemical and physical analyses (determined by standardized procedures) and by the NIR spectra collected in the respective samples of wood powder.
Predictive models for basic density, total extractives, ash, holocellulose, S/G ratio and elementary components (nitrogen and carbon) of the wood were developed from NIR spectra measured in the 105 samples. PLS-R models were developed using untreated and treated spectra. The following mathematical treatments were applied to NIR spectra: central averaging, normalization, first derivative (13-point filter and a second-order polynomial), second derivative (25-point filter and a second-order polynomial), multiplicative scatter correction (MSC) and standard normal variate (SNV). Derivatives were calculated from the Savitzky-Golay algorithm.
PLS-R was validated by cross-validation and independent set validation. The leave-one-out method was used for full cross-validations, while independent set validation was performed using 2/3 of the samples chosen at random for calibrations and 1/3 of the remaining specimens for test set validation.
The statistical parameters used to select the best forecasting models were the determination coefficient of cross-validation (R2cv) and independent validation (R2p); mean square error of the cross-validation (RMSEcv) and independent validation (RMSEp); performance ratio for deviation for cross-validation (RPDcv) and independent validation (RPDp) and the number of latent variables used in the calibration (LV). The RPD is the ratio between the standard deviation of the reference values and RMSE. These statistics are a way of identifying the accuracy of the calibration, even between different wood traits.
Results and discussion
Spectral signature
Fig. 1shows the NIR signatures of powdered wood of Eucalyptus urophylla. The use of this interval allows greater spectral information correlated to the chemical and physical properties of the wood. According to Pasquini ([26]), NIR radiation interacts with the C-H, N-H, O-H and S-H bonds of the chemical components of biological materials. Studies that were developed to estimate basic density and the chemical properties of wood ([11]) for Eucalyptus used the same wave range as this research.
Fig. 1 - Original NIR spectra of wood samples of Eucalyptus urophylla.
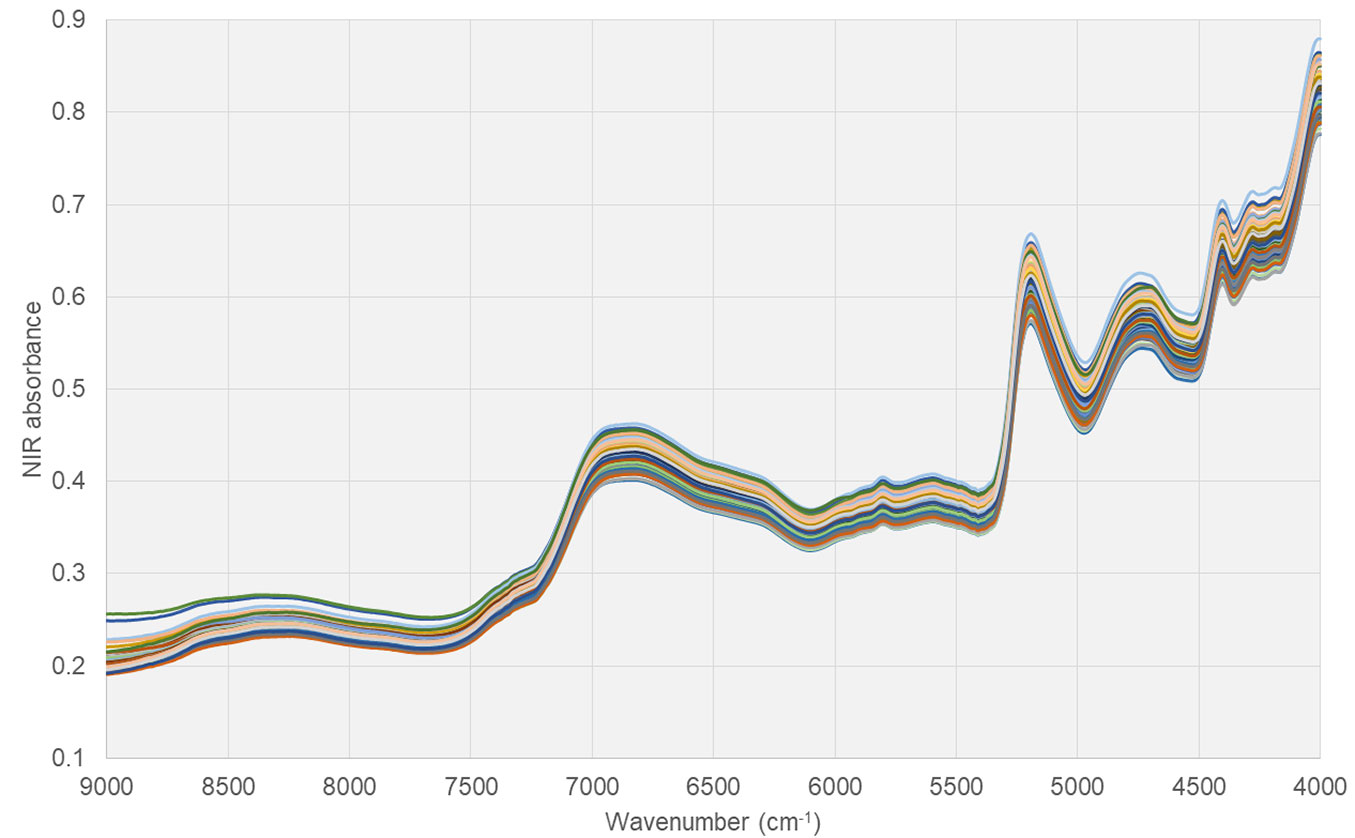
It is possible to observe noise and a lack of relevant information throughout the range up to 9000 cm-1. Most regions with useful spectral information occur before 7000 cm-1. These regions are attributed to the polymer variations associated with the chemical constitution of wood. According to Workman & Weyer ([42]), the most prominent bands for wood are 7100 to 6240 cm-1 (water) and 4405 cm-1 (lignin), and the peaks are at 5495, 4218, 4019 and 4405 cm-1 (cellulose) and 4762 and 4545 cm-1 (carbohydrates). Absorption Band 1 (Band 1) mainly refers to water, and the other absorption bands (Band 2) refer to the wood chemical components (Fig. 1). Multivariate statistical analysis is necessary to assist in the extraction and interpretation of useful information contained in the NIR spectrum.
The interpretation of the NIR spectrum of wood is complicated because wood is a complex material, mainly composed of cellulose, hemicelluloses, and lignin, along with minor amounts of extractives and inorganics ([25]). Similarities or differences between wood samples can be easily observed by principal component analyses of their NIR spectra information. Thus, PCA was carried out from first derivative spectra to investigate the effect of clone or age on NIR signatures of wood (Fig. 2). Principal components (PC1 and PC2) accounted for 89% of the spectral variability, and no clear clusters were found in the scatter plot of scores for PC1 and PC2.
Fig. 2 - Two-dimensional scatter plots for PC1 and PC2 from principal component analyses (PCAs) of the first derivative NIR spectra grouping samples by Clone (A) and Age (B). Differences in clones or ages are highlighted by the colour scale.
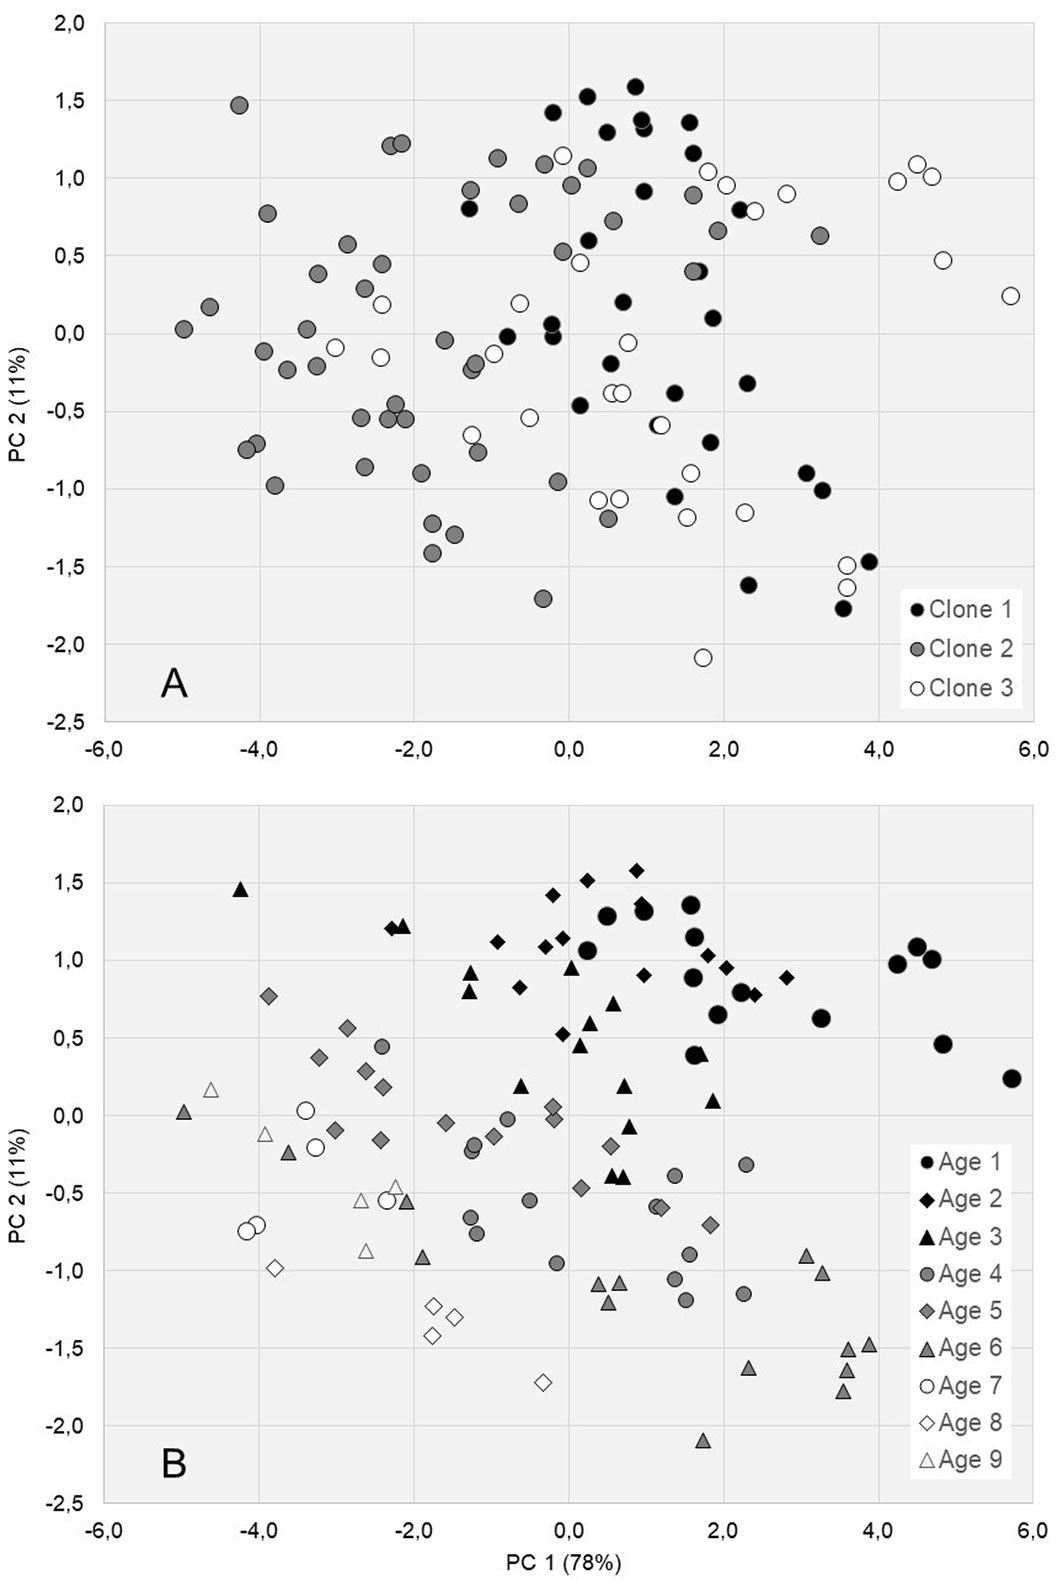
Although it was not possible to accurately discriminate clones (Fig. 2A), the spectral variability is likely to depend on tree age (Fig. 2B), as the scores are distributed along the plot according to age (see gradient of colours in Fig. 2). Dark samples represent younger trees (1 to 3 years), while lighter samples represent more mature trees (6 years).
Predicting wood properties from NIR models
Tab. 3shows the statistics associated with the calibrations and cross-validations presenting the best performance for estimating the wood properties. The spectral range and data treatment influenced the model performance. For all wood properties, models developed from spectra ranging from 9000 to 4000 cm-1 achieved better predictive performances than the models (not shown) developed from the entire NIR range (12500 to 3600 cm-1). For basic density, ash, holocellulose and S/G ratio, models developed from the first derivative of spectral signatures performed better. To estimate the extractive nitrogen and carbon contents, the best models were obtained from NIR spectra treated by MSC (multiplicative scatter correction), untreated spectra and spectra after SNV (standard normal variate) processing (Tab. 3, Fig. 3). No outliers were removed from the database. It is worth noting that the suppression of a large number of outlier samples results in a decrease in representativeness and elimination of important information from the data ([26]).
Tab. 3 - Statistics associated with PLS-R calibrations, cross-validations and test set validations for estimating the wood properties of Eucalyptus urophylla. (Treat): mathematical treatment; (LV): latent variables; (R2): coefficient of determination for calibration (R2c), cross-validation (R2cv) and test set (R2p); (RMSE): root mean square error for calibration (RMSEC), cross-validation (RMSECV) and test set (RMSEP); (RPD): ratio of performance to deviation for cross-validation (RPDcv) and test set (RPDp); (BD): basic density; (EXT): total extractives content; (ASH): ash content; (HOLO): holocellulose content; (S/G): syringyl to guaiacyl ratio; (N): nitrogen content; (C): carbon content.
| Method | Y Variable | BD | EXT | ASH | HOLO | S/G | N | C |
|---|---|---|---|---|---|---|---|---|
| Cross-validation | Model | #1 | #2 | #3 | #4 | #5 | #6 | #7 |
| Treat. | 1D | MSC | 1D | 1D | 1D | - | SNV | |
| LV | 8 | 10 | 8 | 7 | 8 | 6 | 10 | |
| R2c | 0.864 | 0.936 | 0.979 | 0.666 | 0.718 | 0.6 | 0.843 | |
| RMSEC | 0.017 | 0.458 | 0.049 | 0.991 | 0.193 | 0.059 | 0.339 | |
| R2cv | 0.754 | 0.907 | 0.961 | 0.503 | 0.527 | 0.498 | 0.761 | |
| RMSEcv | 0.023 | 0.553 | 0.067 | 1.222 | 0.253 | 0.067 | 0.421 | |
| RPDcv | 2.01 | 3.3 | 5.08 | 1.41 | 1.45 | 1.41 | 2.04 | |
| Test set validation | Model | #8 | #9 | #10 | #11 | #12 | #13 | #14 |
| LV | 10 | 10 | 10 | 5 | 8 | 6 | 10 | |
| R2c | 0.862 | 0.929 | 0.966 | 0.564 | 0.605 | 0.607 | 0.833 | |
| RMSEC | 0.017 | 0.461 | 0.061 | 1.131 | 0.224 | 0.059 | 0.354 | |
| R2p | 0.768 | 0.912 | 0.936 | 0.239 | 0.525 | 0.509 | 0.697 | |
| RMSEp | 0.023 | 0.586 | 0.104 | 1.69 | 0.284 | 0.068 | 0.492 | |
| RPDp | 2.04 | 3.4 | 3.44 | 1.03 | 1.35 | 1.41 | 1.72 |
Fig. 3 - Relationship between wood properties determined in the laboratory and estimated from cross-validation models based on NIR signatures.
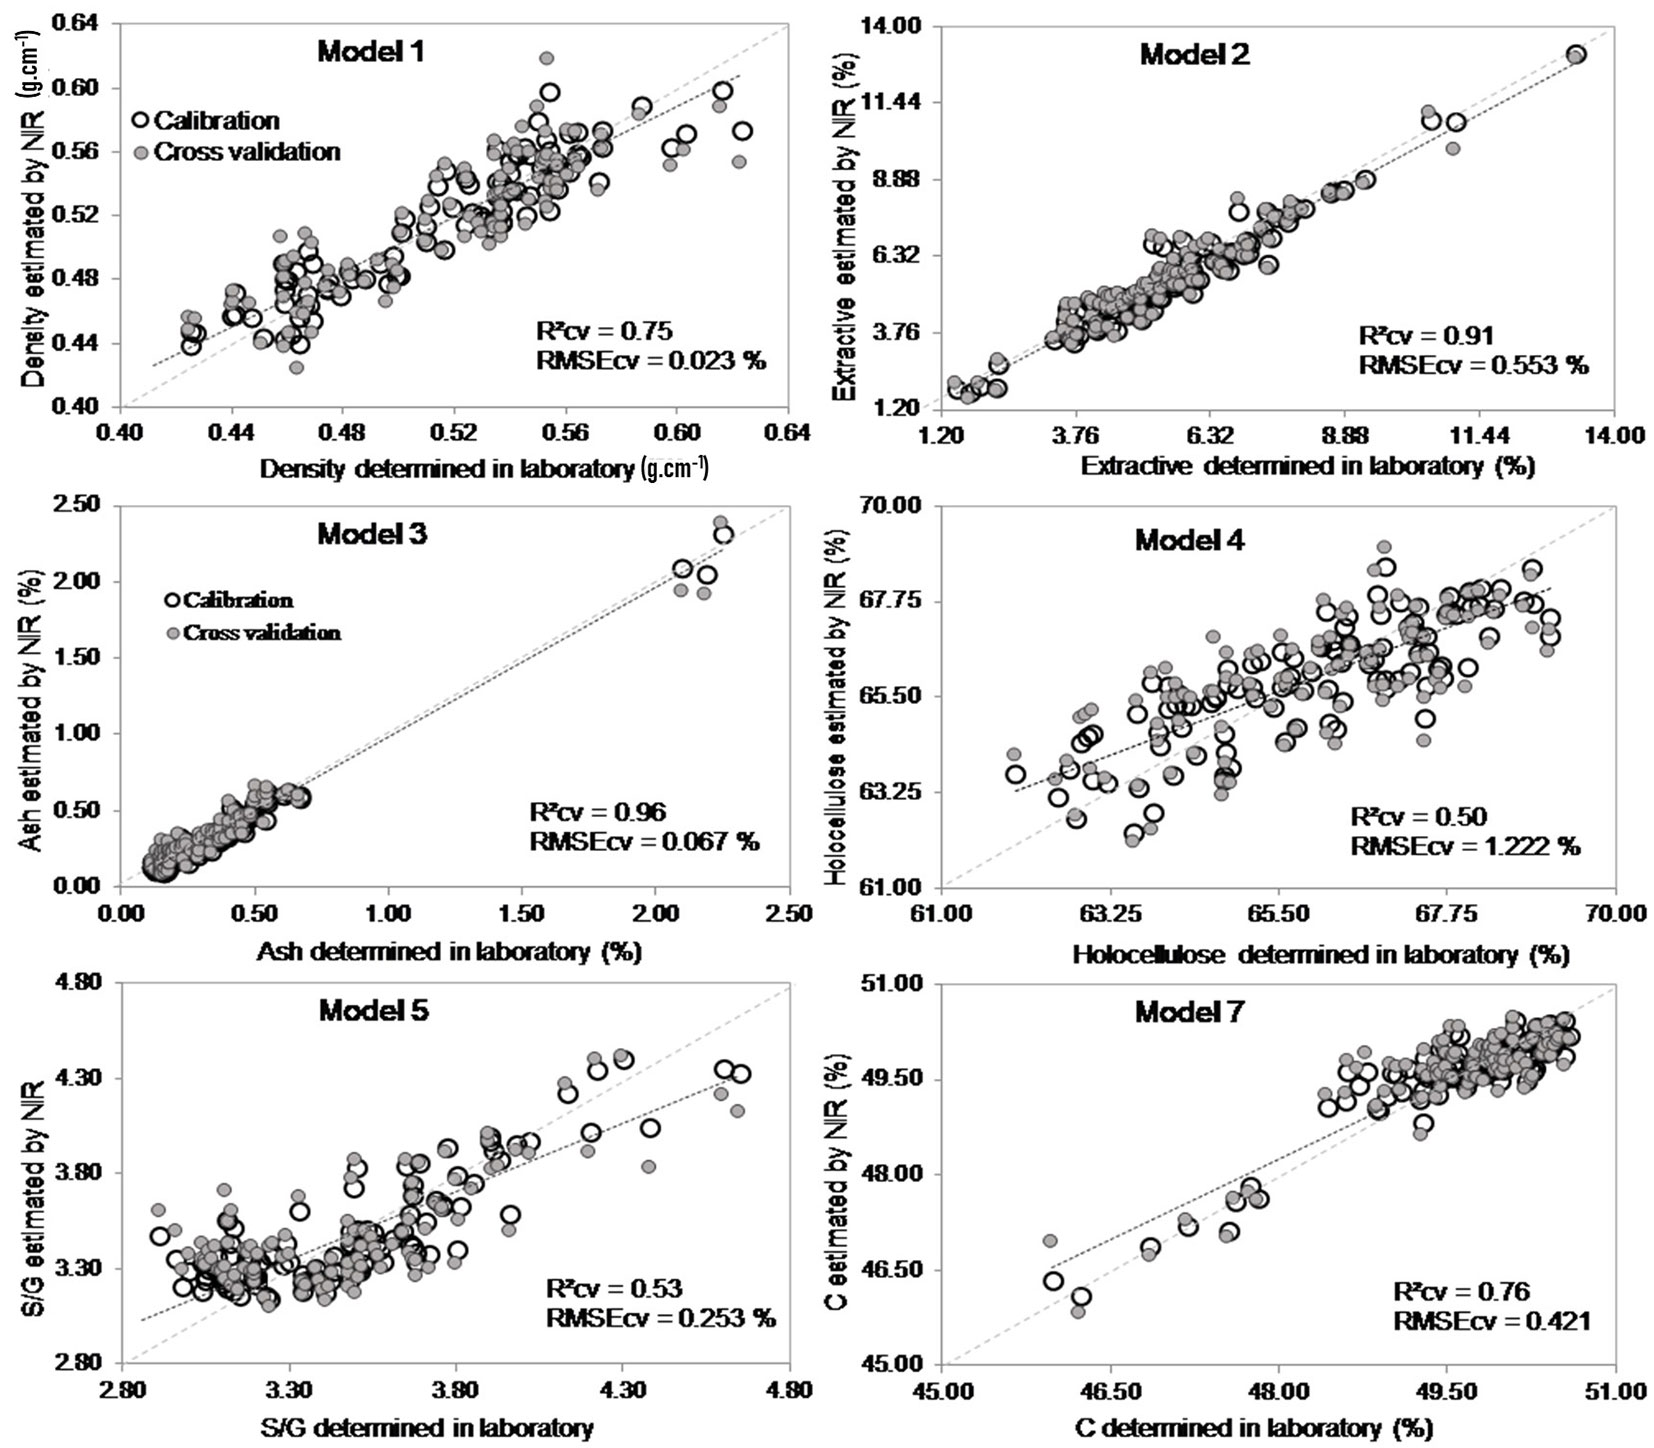
The model developed for the prediction of ash content showed a higher coefficient of determination in cross-validation (R2cv = 0.961) and ratio of performance to deviation (RPD = 5.08). The lowest statistics of the model were presented for estimating the nitrogen content (R2cv = 0.498 and RPD = 1.41). The higher the RPD is, the more robust the model is ([13]). For complex materials such as wood, models with RPD values above 1.5 can be used for preliminary screening ([30], [40]).
Several studies have reported that wood density can be predicted from NIR signatures ([16], [17], [3]). In this study, the best model for estimating the basic density presented a R2cv of 0.754 and RMSEcv of 0.023 and reached a satisfactory RDP value (2.01), as stated by [36] (Model #1 - Tab. 3, Fig. 3). This model was developed from eight latent variables and the first derivative of the NIR spectra.
This kind of predictive model presents many industrial applications since wood density offers considerable information about wood. Wood density is related to several key properties, which highlights that it is a parameter of wood quality applicable in several situations of industrial activity ([29], [14]). Until then, most studies for estimating the basic density were carried out using spectra of solid wood. However, this study presents a new approach based on NIR spectra recorded in milled wood. The statistics associated with the PLS-R infer that the NIR spectra recorded from wood powder provide a reliable estimate of the wood density.
This is especially important from an operational point of view. That is, this model is capable of estimating values that can be used to rank unknown materials and classify them in terms of quality from spectra collected from the dust of their wood, without the need to cut down the trees and transport them to the laboratory.
Concerning the chemical composition of wood, NIR spectroscopy detects variations in the chemical constitution and can be used to assess key properties ([17]) and estimate the performance of wood in industrial operations, such as pulping and bleaching. Predictive models for estimating the extractive content with good performance for material selection and tree breeding programmes have been reported ([11]). In the present study, the model for extractives (Model #2 - Tab. 3, Fig. 3) showed promising performance with a R2cv of 0.907, RPDcv of 3.30 and RMSEcv of 0.553%. According to So & Eberhardt ([38]), the application of mathematical treatments of NIR data improved the performance of the calibration, leading to better predictions. The predictive performance of Model #2 was achieved through the application of MSC treatment on the NIR spectra and the use of ten latent variables.
When the objective is to produce charcoal from wood, for instance, chemical composition is an aspect affecting industrial performance. In general, wood with a high lignin content and percentage of some extracts is more suitable for energy use ([6], [14]). Thus, the selection of genetic materials taking into account these chemical properties of wood is essential. The PLS-R models presented in Tab. 3can bring agility to tree breeding programmes in forest companies that need to phenotype large wood powder samplings.
The model for estimating ash content from first derivative NIR spectra yielded the highest determination coefficient (R2 = 0.961) in cross-validation (Model #3 - Tab. 3). Three wood samples with high ash contents positively influenced the model statistics (Fig. 3). Ash content is related to extractive content and very often and also to basic density. According to Chen et al. ([8]), the content of inorganic materials in wood can be successfully estimated using NIR spectra, as demonstrated in the present study. High R2 values imply a greater correlation between the values predicted by the NIR and the reference values ([33]). From a bioenergetic point of view, the minerals present in biomass fuels are harmful, as they can form incrustations in equipment and pipes when the biomass is burned in furnaces, in addition to decreasing the calorific value of the combustible material ([6], [27]). The possibility of quickly identifying these minerals in wood is very important for industrial purposes.
With regard to the predictive models for holocellulose, the previous investigations have shown promising findings. For instance, Hou & Li ([19]) developed a model with high R2 (0.98) and low RMSEcv (0.34%) values. Zhou et al. ([45]) found high correlation coefficients in predicting the holocellulose content of different hardwoods (R2 = 0.93). Likewise, models with good calibrations for holocellulose (R2 = 0.79 and RMSEcv = 1.19%) were reported by Zhou et al. ([44]) in samples of Eucalyptus dunnii. However, Model #4 (Tab. 3), developed to estimate the holocellulose fraction, did not obtain highly satisfactory statistics, as found for the other properties. Similarly, the PLS-R to estimate the ratio of the S/G units, as well as the holocellulose content, presented statistics associated with the model with unsatisfactory values for cross-validation (Tab. 3, Fig. 3). The coefficient of determination (R2cv = 0.527) was not considered high enough, but the error (RMSEcv = 0.253) was low. Hein et al. ([16]) reported satisfactory cross-validations for the S to G ratio in Eucalyptus urophylla with R2cv ranging from 0.71 to 0.86, RMSEcv from 0.12 to 0.18 and RPD from 1.90 to 2.88. Baillères et al. ([5]) presented an RMSEcv value similar to that of the present study, with a value of 0.22; however, the R2cv showed a higher value. For the production of bioenergy from charcoal, the highest proportion of G-type structures, causing the lowest S/G ratio, has been related to the higher yield of the carbonization process ([28], [35]).
Cross-validations for nitrogen content showed the lowest R2cv (0.498), an RMSE of 0.067 and an RPD of 1.41, similar to that of holocellulose (Tab. 3). It is worth noting that high levels of N are undesirable in wood for use as a source of bioenergy, especially for thermochemical conversion processes. The release of this constituent in the atmosphere can cause the formation of toxic oxides (NOx), promote air pollution and the formation of acid rain ([10], [24]) and decrease the caloric value of fuel ([20]). As with sulfur, the presence of nitrogen is harmful to the environment and human health.
The model for estimating carbon content (Tab. 3, Fig. 3) yielded a satisfactory determination coefficient (R2cv = 0.761) and low error (RMSEcv = 0.421). Carbon content is an important parameter for assessing the quality of wood for energy purposes. For charcoal production, higher levels of carbon are desirable, as carbon is converted into fixed carbon, which is mainly responsible for energy storage. In general, the percentage of elemental carbon has a positive relationship with the yield in charcoal due to its thermal degradation ([31]).
In summary, the predictive models presented in Tab. 3could be applied for the rapid characterization of wood and to select materials that are more adequate for industrial application.
These models were rebuilt to test them in independent validations. In other words, the database was randomly divided into sets: one to calibrate (2/3 of samples) and the other (1/3 of samples) to validate the models independently. Tab. 3also shows the statistics associated with the models developed using test set validation for untreated NIR spectra. As expected, the PLS-R models showed lower performance in terms of R2p, RMSEp and RPDp than the cross-validations. The models developed for basic density, extracts and ashes performed well and generated acceptable estimates of these properties in the “unknown” wood samples of the independent set. Therefore, these models can be considered satisfactory and are validated for estimating these wood properties, indicating that the representativeness of the materials is more important than just a large number of samples.
Predicting the extractive content: validations by clones
In the present study, the PLS-R model for estimating extractive content was selected to be validated by different approaches because the reference data and NIR spectra yielded promising cross-validation results (Model #15 - Tab. 4). In the first approach, we developed NIR models based on two clones and validated them using the remaining clone. Tab. 4shows the calibrations and test set-validated PLS-R models for estimating the extractive content of each clone. These models were developed from the first derivative of the NIR spectra.
Tab. 4 - Statistics associated with PLS-R test set validations by clone for estimating total extractive contents in Eucalyptus urophylla wood. (LVs): latent variables; (R2): coefficient of determination for calibration (R2c) and test set (R2p); (RMSE): root mean square error for calibration (RMSEC) and test set (RMSEP); (RPD): ratio of performance to deviation for calibration (RPDc) and test set (RPDp).
| Model | #15 | #16 | #17 | #18 |
|---|---|---|---|---|
| LV | 5 | 8 | 7 | 8 |
| Cal set | Clones | |||
| all | 2 and 3 | 1 and 3 | 1 and 2 | |
| Min | 1.49 | 1.49 | 1.49 | 3.55 |
| Mean | 5.40 | 5.34 | 5.55 | 5.35 |
| Max | 9.26 | 8.87 | 9.26 | 9.26 |
| R²c | 0.872 | 0.949 | 0.978 | 0.912 |
| RMSEC | 0.541 | 0.348 | 0.267 | 0.347 |
| RPDc | 2.81 | 3.39 | 6.79 | 4.51 |
| Val set | all | 1 | 2 | 3 |
| Min | 1.49 | 3.61 | 3.55 | 1.49 |
| Mean | 5.40 | 5.56 | 5.21 | 5.53 |
| Max | 9.26 | 9.26 | 7.43 | 8.87 |
| R²p | 0.816 | 0.882 | 0.228 | 0.915 |
| RMSEp | 0.667 | 0.481 | 0.907 | 0.624 |
| RPDp | 2.28 | 2.93 | 1.09 | 3.48 |
Most of the predictive models presented adequate statistics. All PLS-R calibrations presented R2c values greater than 90%. PLS-R models validated using clone 1 (Model #16) and clone 3 (Model #18) presented good statistics, while Model #17 (Tab. 4) validated with samples from clone 2 yielded a low R² value, probably due to the narrow range of variation (3.55% to 7.43%) in the extractive content. Fig. 4shows reliable agreements between NIR-estimated and laboratory-determined values for the extractive content of wood of models presented in Tab. 4including calibration (white circles) and validation (grey circles) set samples.
Fig. 4 - Relationship between extractive contents determined in the laboratory and estimated from cross-validation (Model #15) and validations by clone (Models #16-18).
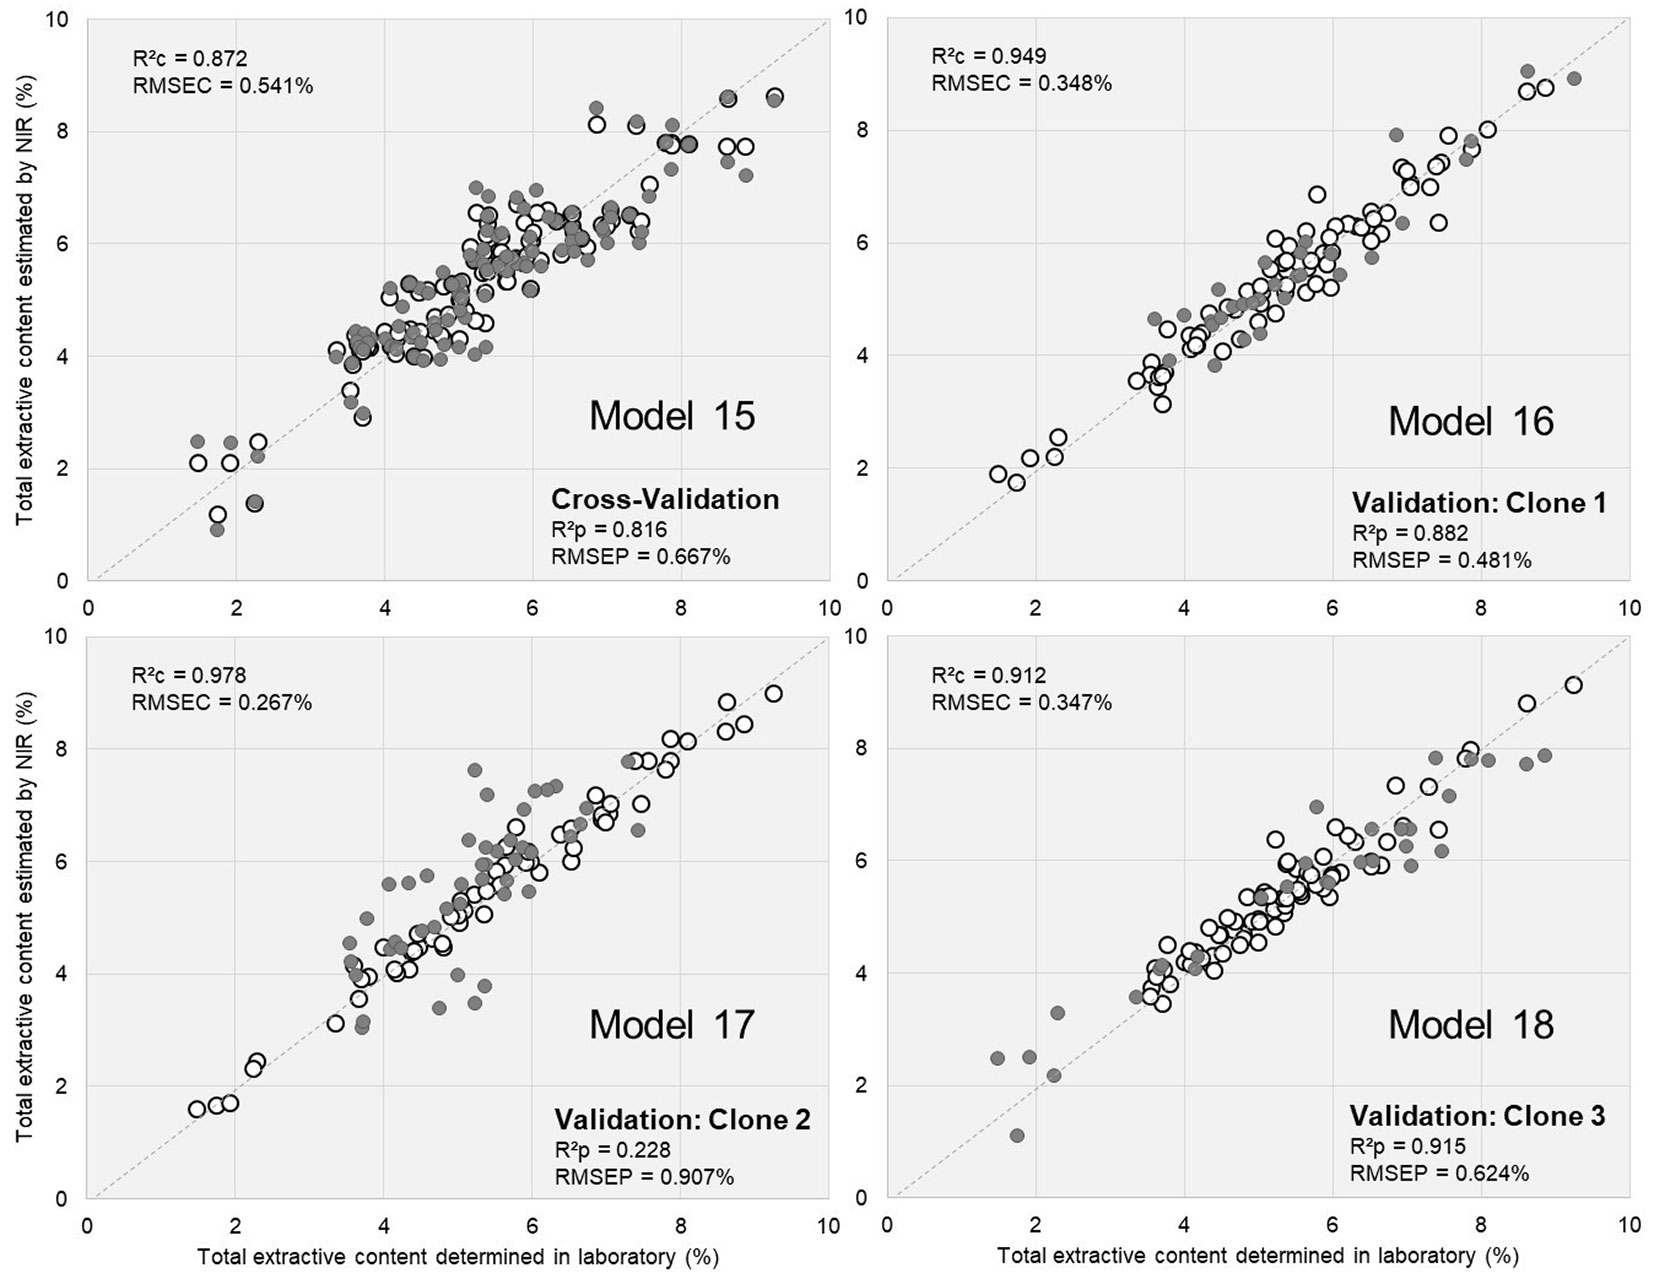
The statistics of Models #16 to #18 (Tab. 4) suggest that it is important to select representative wood samples (trees) for developing NIR models. The models to be applied to unknown samples must encompass every possible variation in the wood properties. If wood samples with properties varying in ranges are different from those used to calibrate the model, then the estimates may contain errors.
Predicting extractive content: validations by age
The samples in this study represent trees from three clone varieties slaughtered at ages ranging from 1 to 6 years. Thus, the same clone was evaluated at ages 1, 2, 3, 4, etc.
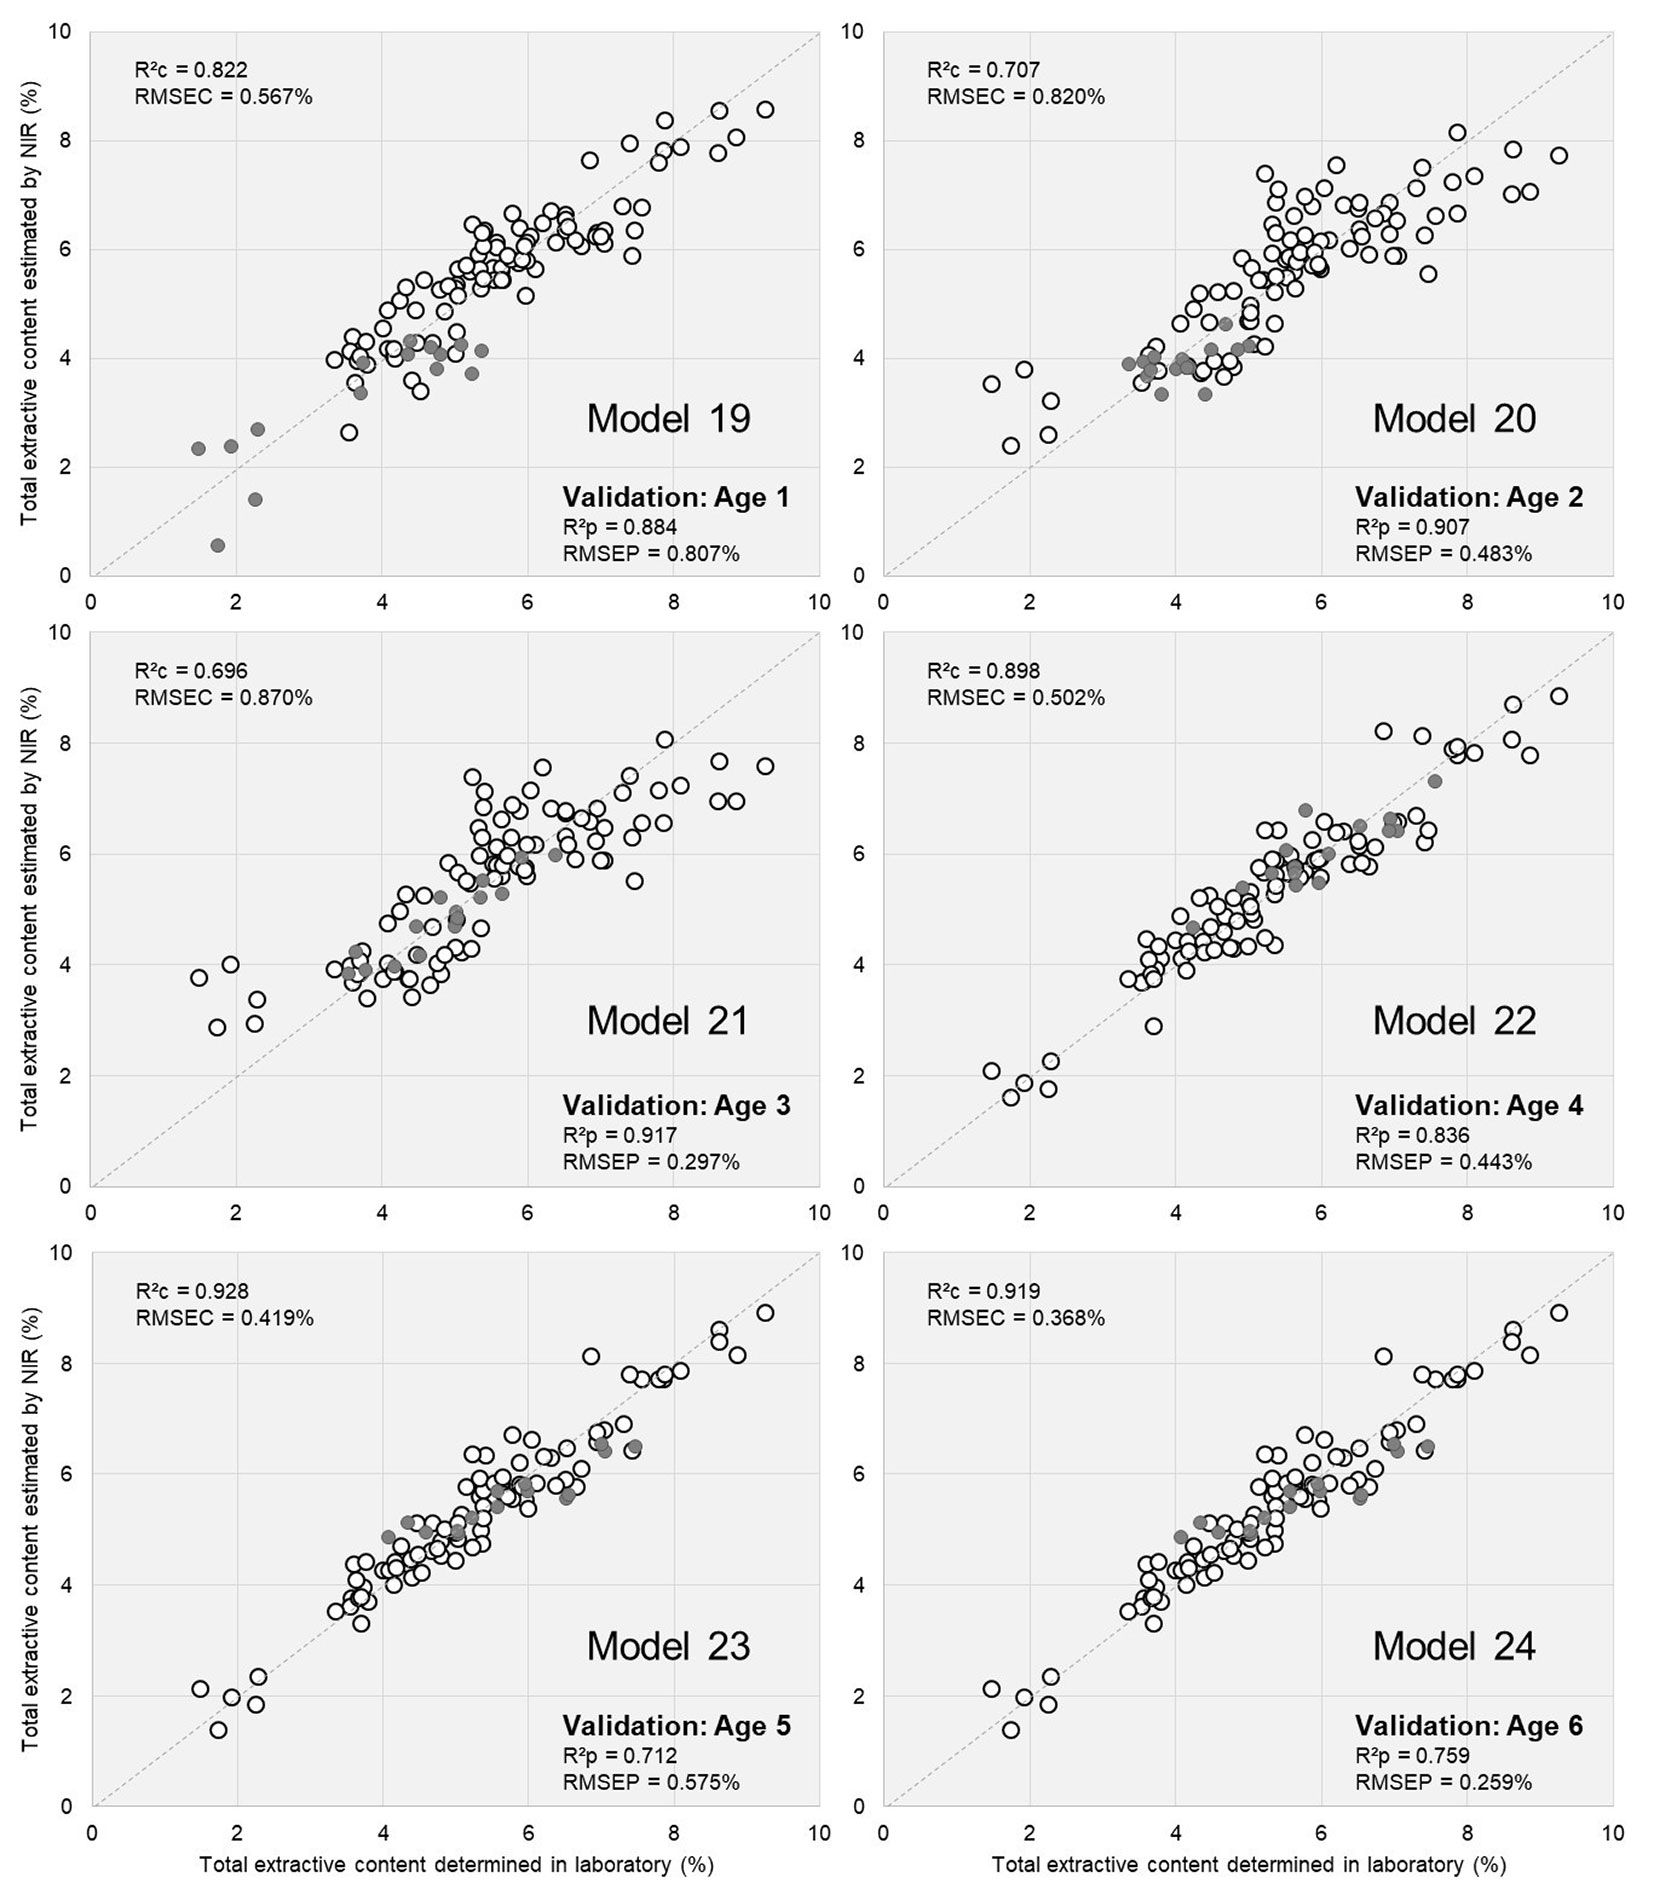
In this second approach, NIR models were developed based on wood samples of one age range and then were validated using wood samples of the remaining age. Tab. 5shows the calibrations and test set validations for estimating the extractive content for different ages. These models were also fitted from the first derivative of NIR signatures, and the PLS-R validations presented promising findings. The coefficient of variation of the calibrations ranged from 69.6% to 92.8%, while the R2p of validation varied between 71.2% and 91.7% (Tab. 5). Fig. 5shows NIR predicted vs. lab-measured values plot for extractive content of Eucalyptus wood for both calibration (white circles) and test sets (grey circles) for each age set.
Tab. 5 - Statistics associated with PLS-R test set validations by age for estimating total extractive contents in Eucalyptus urophylla wood. (LVs): latent variables; (R2): coefficient of determination for calibration (R2c) and test set (R2p); (RMSE): root mean square error for calibration (RMSEC) and test set (RMSEP); (RPD): ratio of performance to deviation for calibration (RPDc) and test set (RPDp).
| Model | #19 | #20 | #21 | #22 | #23 | #24 |
|---|---|---|---|---|---|---|
| LV | 4 | 2 | 2 | 6 | 7 | 7 |
| Cal set | Ages | |||||
| 1-9 | 1.3-9 | 1-2.4-9 | 1-3.5-9 | 1-4.5-9 | 1-5.7-9 | |
| Min | 3.36 | 1.49 | 1.49 | 1.49 | 1.49 | 1.49 |
| Mean | 5.68 | 5.63 | 5.51 | 5.32 | 5.36 | 5.10 |
| Max | 9.26 | 9.26 | 9.26 | 9.26 | 9.26 | 7.57 |
| R2c | 0.822 | 0.707 | 0.696 | 0.898 | 0.928 | 0.919 |
| RMSEC | 0.567 | 0.820 | 0.870 | 0.502 | 0.419 | 0.368 |
| RPDc | 2.39 | 1.86 | 1.83 | 3.16 | 3.79 | 3.56 |
| Val set | 1 | 2 | 3 | 4 | 5 | 6 |
| Min | 1.49 | 3.36 | 3.55 | 4.25 | 4.08 | 5.34 |
| Mean | 3.72 | 4.11 | 4.85 | 5.99 | 5.74 | 7.30 |
| Max | 5.37 | 5.01 | 6.39 | 7.57 | 7.47 | 9.26 |
| R2p | 0.884 | 0.907 | 0.917 | 0.836 | 0.712 | 0.759 |
| RMSEp | 0.807 | 0.483 | 0.2969 | 0.443 | 0.575 | 1.259 |
| RPDp | 1.72 | 1.04 | 2.82 | 2.00 | 1.80 | 1.07 |
Fig. 5 - Relationship between extractive contents determined in the laboratory and estimated from PLS-R validations by age (Models #19-24).
The results obtained in this study show that the sample selection approach is of fundamental importance, as it makes it possible to drastically reduce the number of analyses carried out in the laboratory for the development of NIR calibrations, without loss of precision and covering all the variability found in the dataset to be evaluated.
According to Models #19 to #24 (Tab. 5), NIR spectroscopy has the potential to become a tool for rapid and reliable classifications of wood in terms of extractive contents in unknown wood samples, even if tree samples of some age ranges were not included in the calibration set.
Conclusions
PLS-R models were validated by an independent set of wood specimens and presented promising statistics for estimating wood density (R²p = 0.768), extractives (R²p = 0.912), ash (R²p = 0.936) and carbon content (R²p = 0.697) from NIR signatures measured in milled wood of young trees from 1 to 6 years old.
Then, NIR models for estimating the extractive content of wood were developed based on clones or ages and validated using the clones or ages left out. Most of the predictive models presented adequate statistics (R2 greater than 90%) and could be applied to routine laboratory analyses or to select potential trees in Eucalyptus breeding programmes.
In the outline of this study, our objective was to develop robust and reliable regressions to estimate wood properties based on NIR spectra taken regardless of the clone or the age of the tree. These results showed that it is important to select representative wood samples for developing NIR models. NIR models developed with representative wood samples are able to satisfactorily estimate the extractive contents of unknown wood samples even when tree samples of some age ranges were not included in the calibration set.
These models are able to quickly and reliably generate estimates of key wood properties to rank unknown materials and classify them in terms of wood quality without the need to fell and transport the tree. This approach can be associated with a motor-driven coring system in which wood samples were extracted from standing young trees in the field, as required for wood breeding programmes.
Author contribution
BAL: field collection, data measurement and wood chemical analyses. TGA: review, editing, and results discussion. FMGR: NIRS analyses, result evaluation and paper writing. PFT: funding and resources, methodology and supervision. PRGH: Funding, methodology, data analyses and supervision.
Acknowledgements
The authors thank the Wood Science and Technology Graduation Program (PPGCTM, UFLA, Brazil) for all the support for this study. This study was financed in part by the Coordenação de Aperfeiçoamento de Pessoal de Nível Superior, Brazil (CAPES) - Finance Code 001, by the Conselho Nacional de Desenvolvimento Científico e Tecnológico (CNPq: grants n. 405xx/2021-8) and by Fundação de Amparo à Pesquisa do Estado de Minas Gerais (FAPEMIG). P.R.G. Hein was supported by a CNPq (process no. 309620/ 2020-1) grant.
References
Gscholar
Gscholar
Gscholar
Gscholar
CrossRef | Gscholar
CrossRef | Gscholar
Gscholar
Gscholar
CrossRef | Gscholar
CrossRef | Gscholar
CrossRef | Gscholar
CrossRef | Gscholar
Gscholar
Gscholar
Authors’ Info
Authors’ Affiliation
Taiana Guimaraes Arriel 0000-0002-3801-1878
Fernanda Maria Guedes Ramalho 0000-0001-5701-4479
Paulo Ricardo Gherardi Hein 0000-0002-9152-6803
Paulo Fernando Trugilho 0000-0002-6230-5462
Department of Forest Sciences, Federal University of Lavras, PO Box 3037, 37200-900 Lavras, MG (Brazil)
Corresponding author
Paper Info
Citation
Assis Loureiro B, Arriel TG, Guedes Ramalho FM, Hein PRG, Trugilho PF (2022). NIR-based models for estimating selected physical and chemical wood properties from fast-growing plantations. iForest 15: 372-380. - doi: 10.3832/ifor4030-015
Academic Editor
Manuela Romagnoli
Paper history
Received: Dec 01, 2021
Accepted: Jul 21, 2022
First online: Oct 05, 2022
Publication Date: Oct 31, 2022
Publication Time: 2.53 months
Copyright Information
© SISEF - The Italian Society of Silviculture and Forest Ecology 2022
Open Access
This article is distributed under the terms of the Creative Commons Attribution-Non Commercial 4.0 International (https://creativecommons.org/licenses/by-nc/4.0/), which permits unrestricted use, distribution, and reproduction in any medium, provided you give appropriate credit to the original author(s) and the source, provide a link to the Creative Commons license, and indicate if changes were made.

Web Metrics
Breakdown by View Type
Article Usage
Total Article Views: 31078
(from publication date up to now)
Breakdown by View Type
HTML Page Views: 25758
Abstract Page Views: 2657
PDF Downloads: 2065
Citation/Reference Downloads: 4
XML Downloads: 594
Web Metrics
Days since publication: 1372
Overall contacts: 31078
Avg. contacts per week: 158.56
Article Citations
Article citations are based on data periodically collected from the Clarivate Web of Science web site
(last update: Mar 2025)
Total number of cites (since 2022): 7
Average cites per year: 1.75
Publication Metrics
by Dimensions ©
Articles citing this article
List of the papers citing this article based on CrossRef Cited-by.
Related Contents
iForest Similar Articles
Research Articles
Estimation of total extractive content of wood from planted and native forests by near infrared spectroscopy
vol. 14, pp. 18-25 (online: 09 January 2021)
Research Articles
Validation of models using near-infrared spectroscopy to estimate basic density and chemical composition of Eucalyptus wood
vol. 17, pp. 338-345 (online: 03 November 2024)
Research Articles
Examining the evolution and convergence of wood modification and environmental impact assessment in research
vol. 10, pp. 879-885 (online: 06 November 2017)
Research Articles
Interaction between planting spacing and wood properties of Eucalyptus clones grown in short rotation
vol. 14, pp. 12-17 (online: 02 January 2021)
Research Articles
Characterization of technological properties of matá-matá wood (Eschweilera coriacea [DC.] S.A. Mori, E. odora Poepp. [Miers] and E. truncata A.C. Sm.) by Near Infrared Spectroscopy
vol. 14, pp. 400-407 (online: 01 September 2021)
Research Articles
Characterization of VOC emission profile of different wood species during moisture cycles
vol. 10, pp. 576-584 (online: 08 May 2017)
Research Articles
Mechanical and physical properties of Cunninghamia lanceolata wood decayed by brown rot
vol. 12, pp. 317-322 (online: 06 June 2019)
Research Articles
Kinetic analysis of poplar wood properties by thermal modification in conventional oven
vol. 11, pp. 131-139 (online: 07 February 2018)
Research Articles
Physical, chemical and mechanical properties of Pinus sylvestris wood at five sites in Portugal
vol. 10, pp. 669-679 (online: 11 July 2017)
Research Articles
Improving dimensional stability of Populus cathayana wood by suberin monomers with heat treatment
vol. 14, pp. 313-319 (online: 01 July 2021)
iForest Database Search
Search By Author
Search By Keyword
Google Scholar Search
Citing Articles
Search By Author
Search By Keywords
PubMed Search
Search By Author
Search By Keyword


