Integrating area-based and individual tree detection approaches for estimating tree volume in plantation inventory using aerial image and airborne laser scanning data
iForest - Biogeosciences and Forestry, Volume 10, Issue 1, Pages 296-302 (2016)
doi: https://doi.org/10.3832/ifor1880-009
Published: Dec 15, 2016 - Copyright © 2016 SISEF
Research Articles
Abstract
Remote sensing has been increasingly used to assist forest inventory. Airborne Laser Scanning (ALS) systems can accurately estimate tree height in forests, and are being combined with more traditional optical images that provide further details about the horizontal structure of forests. To predict forest attributes two main techniques are applied to process ALS data: the Area Based Approach (ABA), and the Individual Tree Detection (ITD). The first part of this study was focused on the effectiveness of integrating ALS data and aerial imagery to estimate the wood volume in Eucalyptus urograndis plantations using the ABA approach. To this aim, we analyzed three different approaches: (1) using only ALS points cloud metrics (RMSE = 6.84%); (2) using only the variables derived from aerial images (RMSE = 8.45%); and (3) the integration of both 1 and 2 (RMSE = 5.23%), which underestimated the true volume by 2.98%. To estimate individual tree volumes we first detected individual trees and corrected the density estimate for detecting mean difference, with an error of 0.37 trees per hectare and RMSE of 12.68%. Next, we downscaled the total volume prediction to single tree level. Our approach showed a better result of the overall volume in comparison with the traditional forest inventory. There is a remarkable advantage in using the Individual Tree Detection approach, as it allows for a spatial representation of the number of trees sampled, as well as their volume per unit area - an important metric in the management of forest resources.
Keywords
Forest Inventory, Airborne Laser Scanning, Treetop Detection, Eucalyptus Plantation, Area-based Approach, LiDAR
Introduction
Intensively managed forest plantations have an important role, both nationally and internationally, due to their ability to efficiently produce large quantities of biomass. This biomass can be utilized in forms suitable for bioenergy or, after processing into cellulose-derivatives, in materials such as paper. The myriad uses of fibers derived from intensively managed plantation forests can aid in the reduction of anthropogenic pressures on natural forests, while simultaneously generating millions of jobs ([22]).
In Brazil, 4.4 million jobs are generated directly and indirectly by forest plantations, and the total reforested area exceeds 7.6 million hectares ([9]). Of this area, 72% is composed of Eucalyptus spp., a key genus in Brazilian forest plantations. The reasons for the success of Eucalyptus spp. plantations in Brazil include Eucalyptus’ rapid growth, genetic improvement, and its tolerance of a wide range of climatic conditions ([32]).
In order to manage the growth and yield of these plantations, annual forest inventories are required. In general, the traditional approaches to conducting plantation inventories follow the precepts of sampling theory, which is based on ground measurements collected from simple random sampling plots. The forest attributes of interest are then inferred for an entire stand based on observations collected at each sample plot ([21]). However, considering the difficulties in field surveys such as sampling error, bias, and the intensive use of time and labor, remote sensing represents an important additional tool for monitoring large areas accurately and efficiently.
Both active and passive remote sensors have been presented as feasible alternatives for estimating forest variables. High spatial resolution optical data is useful at providing spectral information on species and condition ([35], [18]), while active remote sensing technologies, such as Airborne Laser Scanning (ALS), can provide highly accurate forest height data ([37]). When predicting forest inventory attributes using ALS data or aerial images, two main approaches can be applied: the Area-based Approach (ABA - [19], [36]) and the Individual Tree Detection (ITD) approach ([27], [11]).
To estimate volume in Eucalyptus spp. plantations Packalén et al. ([20]) applied the ABA approach. In the ABA, the response variable (e.g., wood volume per unit area in m3 ha-1) is aggregated over a grid cell of predetermined size or over a plot size ([3]). This response variable is estimated using predictor variables, which are derived from the ALS metrics directly or indirectly, such as the mean height, height percentiles, densities and proportions, or from image, such as the reflectance ([19], [39]).
The ABA approach is most suited to the estimation of a number of crucial forest stand attributes over large areas ([19], [36]). The prediction of stand attribute variables from ALS data, such as biomass, volume, basal area, mean diameter, or average height have been shown to have similar or improved accuracy compared to traditional inventory methods ([36]). However, when tree-level information such as stem number or species is desired, the ABA approach is less suitable ([3]).
In this case, the ITD approach is the most appropriate to estimate individual tree characteristics. However, algorithms normally used in the ITD approach detect, on average, 75% of trees ([26], [18]). Therefore, the use of automatic ITD may lead to the non-detection of some trees, and can interfere with forest attributes prediction ([3]).
Vastaranta et al. ([34]) applied an alternative method to overcome the shortcomings of ITD detection, involving the aggregation of the tree numbers in a grid cell, according to ABA. By aggregating trees into grid cells it is possible to know how many trees were detected or not in each cell, so long as detection rates are compared with ground truth data and the most appropriate methodology to correct deviations is used. This approach, also used in this study, can lead to a reduction in the number of systematic errors, and to an increased accuracy in the estimation of the number of trees per hectare, a variable extremely important to forest managers ([33], [3]).
According to Packalén et al. ([20]), the advantage of using ITD approaches is that the correct detection of individual trees could reduce the number of plots needed for an accurate and unbiased inventory. Breindenbach & Astrup ([3]) also note that the ITD approach is inherently more intuitive than ABA because the response variables are related to each tree (the smallest unit in a management system), providing coordinates that can be tied to individual tree growth, as well as explicit links to tree growth and yield models. In the case of ALS data, ITD approaches require high density point clouds, which can be impractical because of the cost of data collection ([17]).
The merging of ALS and optical remote sensing data can assist in the accurate estimation of forest attributes, with algorithms based on height or brightness ([8], [19], [38], [35], [29], [18], [20]). Saarela et al. ([30]) integrated ALS and Landsat image data to improve accuracy of timber volume estimation as compared with estimates based on ALS and images variables alone. This comparison is also employed in the present study, though we used high spatial resolution images. For instance, the ABA and ITD approaches can be combined to estimate wood biomass or volume in forest plantations ([19], [2]).
In this study, we use ABA and ITD to estimate stand volume in Eucalyptus spp. plantations using ALS and high spatial resolution multispectral image data. To this goal, we first modeled the stand volume using standard ABA approaches, using different combinations of ALS-based and image-based metrics as independent model variables. Second, we used an ITD-based approach to estimate tree count, applying a correction method to improve single tree detection, which is integrated with the stand volume predicted using ABA. Finally, we merge the two approaches (ITD and ABA), that yields volume predictions at the single tree level. We conclude by discussing the possibilities of using ABA for individual tree volume predictions.
Materials and methods
Study area
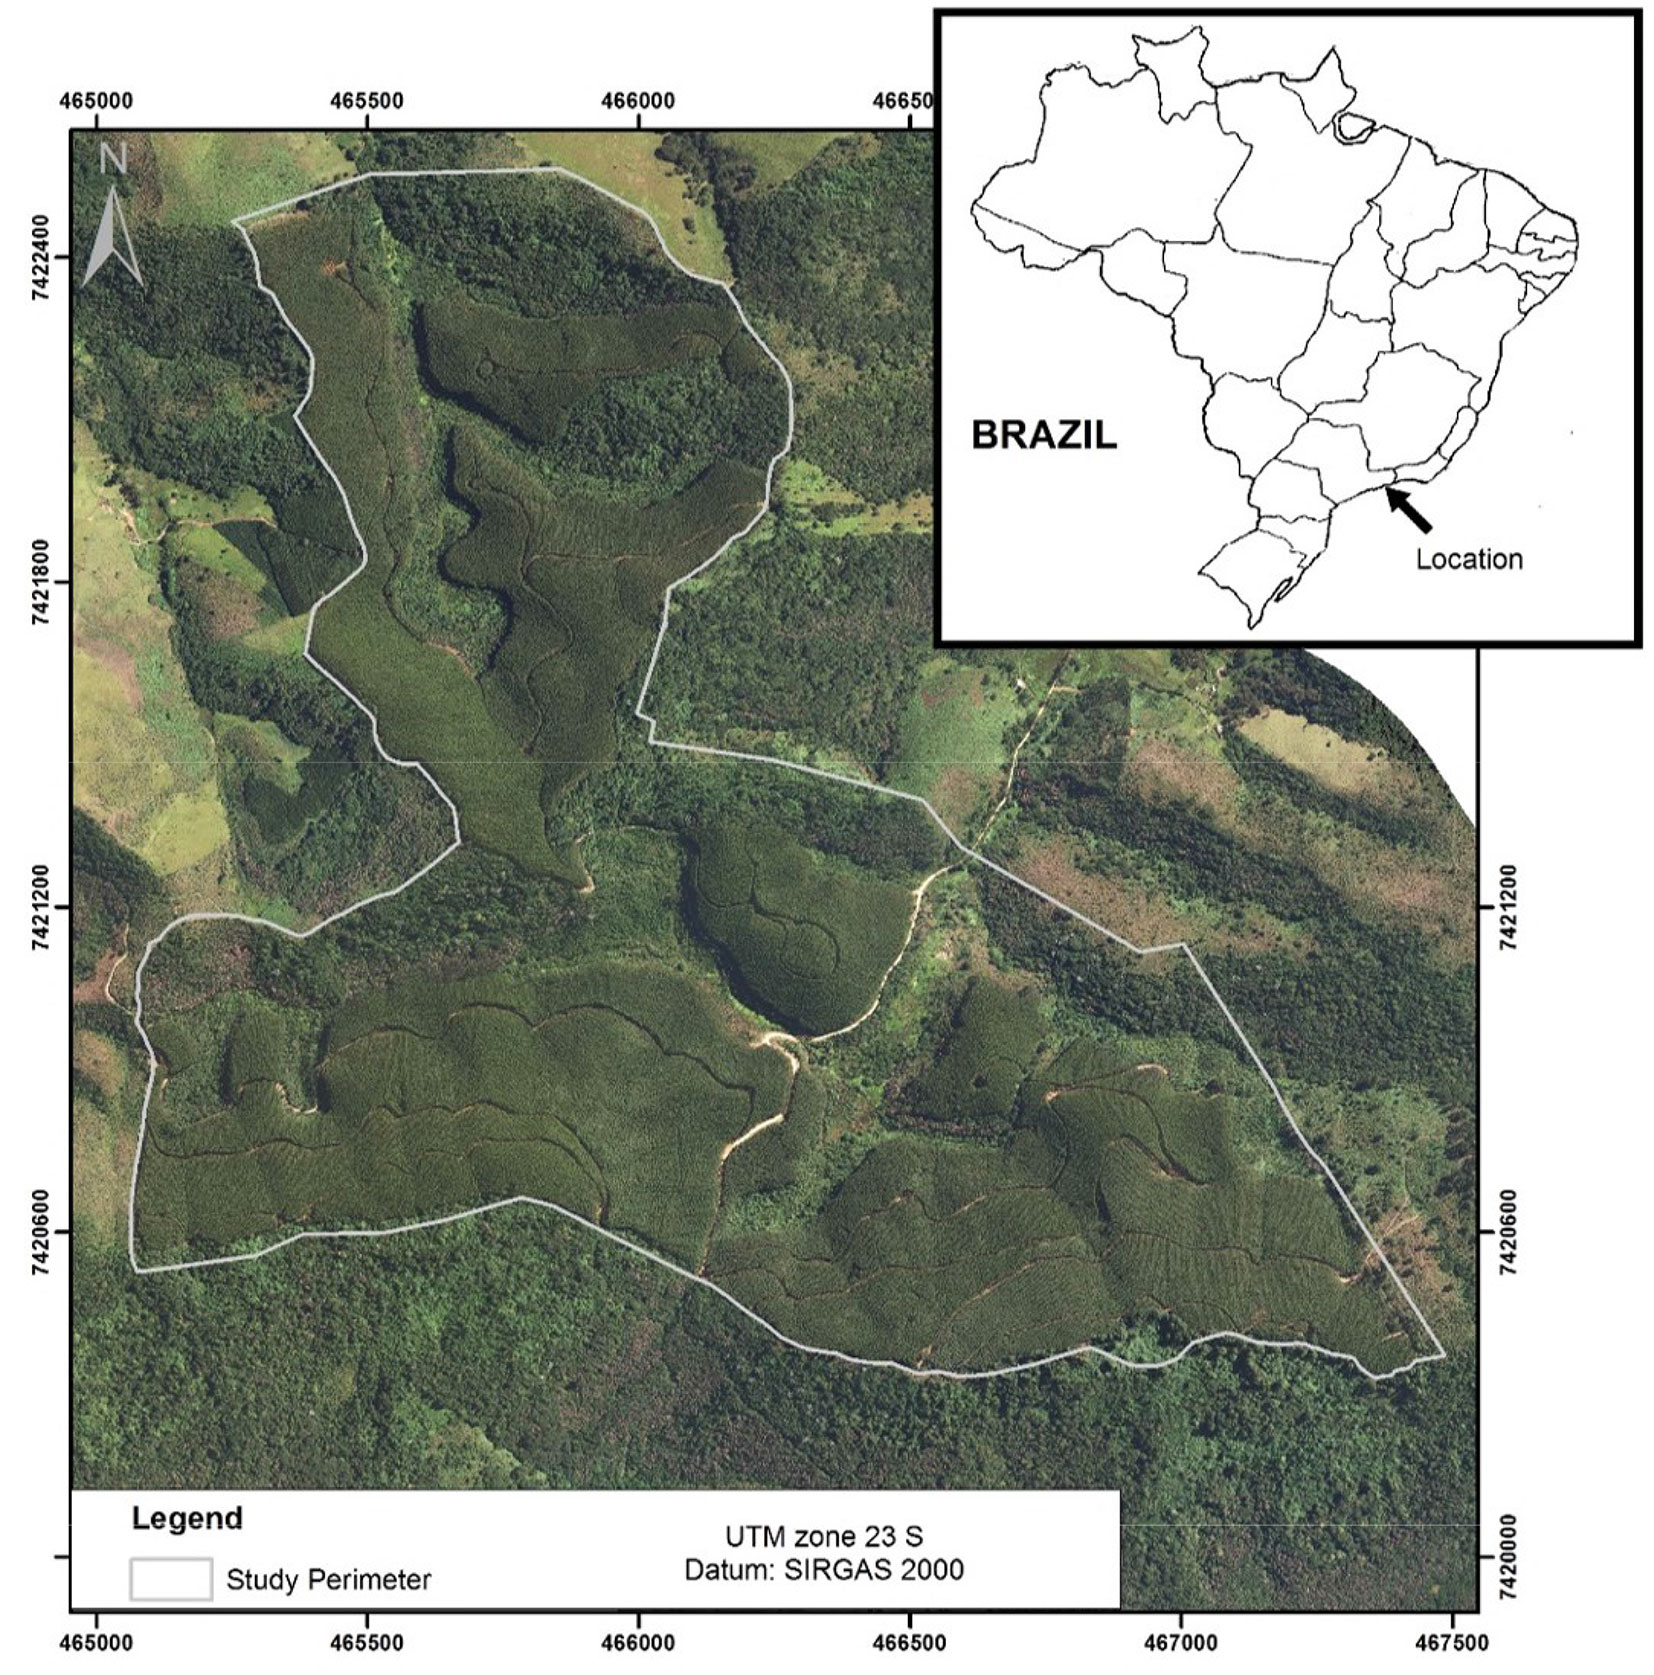
The study was performed in a forest plantation owned by FIBRIA S.A. company, located in São Luiz do Paraitinga in São Paulo State, Brazil (23° 33′ S, 45° 34′ W and 23° 30′ S, 45° 31′ W - Fig. 1). The dominant species in the study area is Eucalyptus urograndis, which is a hybrid between Eucalyptus urophylla and Eucalyptus grandis ([7]). According to Köppen & Geiger ([12]), the climate is humid subtropical (Cwa) characterized by cold winters and rainy summers, with average annual precipitation of 1210 mm and a mean monthly temperature of 20.2 °C ([5]). The topography of the study area is complex, with elevations varying from 974 to 1266 m a.s.l. and the average slope is 24.3 degrees.
Fig. 1 - The study area near São Luíz do Paraitinga (São Paulo, Brazil), including the 6.5 year-old Eucalyptus urograndis forest plantation analyzed in this investigation.
The forest stands in the study area were planted in December 2006 and harvested between April and May 2013, following a standard 6.5 year rotation period. All harvested wood was taken to a mill. The trees were planted in rows with fixed tree spacing (2 × 3 m), resulting in a density of 1667 stems per hectare.
Field measurements
Reference data were based on field measurements collected at 48 circular plots (r = 11.28 m, area of 400 m²) between April and May of 2013 prior to harvesting. In each plot, all diameter at breast height (DBH) were recorded, and the height of 10 trees were measured. Heights for all remaining trees in the plot were then estimated by applying the Curtis ([6]) hypsometric model, adjusted based on the 10 measured trees in each plot. Tree volume was estimated with locally-developed volume models based on the model proposed by Schöepfer ([31] - Tab. 1). The geographical location of the plots were obtained using high-precision GPS receivers (ProXRT®, Trimble Inc., Sunnyvale, CA, USA) at the center of each plot.
Tab. 1 - Descriptive statistics of the reference plots (n=48) for the basal area (G), diameter at breast height (DBH), total height (HT), dominant height (HDOM) and cellulose volume without bark (V).
| Variable | Min | Max | Mean | SD |
|---|---|---|---|---|
| G (m2 ha-1) | 27.08 | 39.16 | 33.96 | 2.75 |
| DBH (cm) | 13.80 | 17.34 | 16.00 | 0.65 |
| HT (m) | 20.82 | 27.93 | 24.89 | 1.70 |
| HDOM (m) | 25.20 | 33.27 | 29.79 | 2.06 |
| V (m3 ha-1) | 223.19 | 391.99 | 331.16 | 37.27 |
After harvesting, all wood arriving at the mill was weighed. The wood density was obtained according to Archimedes’ principle and, therefore, the total volume of wood at the mill could be defined by weight-to-volume (W-V) relationships obtained in the density measurement process. A complete description can be found in Batista ([1]).
Remote sensing data
ALS data were acquired by a RIEGL LMS - Q680I® system (Riegl Gmbh, Horn, Austria) simultaneously on 15 January 2012 with aerial photographs under free-cloud conditions. The average ALS point density was 5 pulses per m2. An orthophoto was generated from aerial images with a pixel size of 0.15 cm. The 4 spectral bands were blue (429-514 nm), green (514-600 nm), red (600-676 nm) and near-infrared (695-831 nm).
Initially we separated ALS ground returns from the vegetation returns, to generate a 15 cm resolution DTM and DSM, which is the minimum size resolution based on point density ([15]). The DTM was used to normalize the point cloud, followed by the generation of the most usual metrics (such as tree height, canopy cover, topography, image bands and ratios) from each type of remote sensing data at a 5-meter resolution. This resolution was chosen following the ABA concept that pixel size should be larger than a tree crown ([36]), with Eucalyptus spp. crown diameter varying from 2 to 3 meters in the study area.
Predictor variables
We extracted LiDAR metrics from the ALS data ([16], [36], [28], [30]) to extract image metrics (bands, ratios between bands and Normalized Difference Vegetation Index), as listed in Tab. 2. We generated the most common metrics (such as tree height, canopy cover, topography, image bands and ratios) from each type of remote sensing data by describing the properties of the point clouds and spectral properties of the images. For the generation of these metrics, only first returns of the ALS point cloud were used and the reflectance value of each pixel in the aerial image was aggregated into a 5 × 5 m grid cell. These metrics were then used in subsequent statistical modeling as explanatory variables. In total, 39 metrics were generated (Tab. 2).
Tab. 2 - List of the variables selected for model inclusion in each of the three approaches adopted in this study.
| Data | Category | ALS metrics | Acronym |
|---|---|---|---|
| ALS | Height | Minimum height | hmin |
| Maximum height | hmax | ||
| Mean height | hmean | ||
| Variance of height | hvar | ||
| Standard deviation of height | hsd | ||
| Coefficient of variation of height | hcv | ||
| Mode of height | hmode | ||
| Kurtosis of height | hk | ||
| Height percentiles: 1st, 5th, 10th, 20th, 25th, 30th, 40th, 50th, 60th, 70th, 75th, 80th, 90th, 95th, 99th | hp01, hp05, hp10, hp20, hp25, hp30, hp40, hp50, hp60, hp70, hp75, hp80, hp90, hp95, hp99 | ||
| Cover | Number of first returns above mean | Cab mean | |
| Number of returns above 2 m | Cab2m | ||
| Percentage of canopy | C% | ||
| Topography | Slope (°) | S | |
| Mean altitude | A mean | ||
| Aerial Image | Spectral Properties | Band 1 - blue | B1 |
| Band 2 - green | B2 | ||
| Band 3 - red | B3 | ||
| Band 4 - near infrared | B4 | ||
| Simple ratio between bands B1/B2, B1/B3, B1/B4, B2/B3, B2/B4, B3/B4 | B1/B2, B1/B3, B1/B4, B2/B3, B2/B4, B3/B4 | ||
| Normalized Difference Vegetation Index | NDVI |
Modeling approach to estimate total wood volume
The first step was the estimation of wood volume using the ABA. Three different methods were applied, depending on the input data source. In the first approach, only variables derived from ALS data were used, in the second approach only variables derived from the imagery were used, and in the final one we combined both sets of variables.
One of the most important considerations when working with a large number of predictor variables in a multiple linear regression is variable selection. To that end, we applied the Best Subset Selection (BSS), which matches an appropriate model to each model size ([10], [14], [28]). To select a model among those suggested by BSS, we applied a k-fold cross-validation (k=5). The application of a cross-validation, similar to the leave-one-out method, allows for a better understanding of model behavior, especially when using a database that was not utilized for model adjustment ([10]). After applying the cross-validation we chose the model according to the RMSE. In this study, we used a confidence interval with a p-value equal to 0.05 generated from 1000 simulations.
The total volume of the forest stands was obtained by the mean ABA estimation multiplied by the total area.
Variable selection and model adjustment
The k-fold estimate of RMSE is computed by averaging the values obtained by eqn. 1:
where CVk is the k-fold cross validation and MSE is the mean square error. The linear model assumptions were verified according to ([23]), where the assumptions were verified for each of the chosen models with statistical tests and graphical analysis ([24], [28]). The approach was then chosen based on the lowest RMSE and the linear model assumptions analysis, generating a predicted wood volume map for the entire study area. This prediction was validated with stand inventory data and information about tree volume received by the mills, after harvesting.
Individual tree volume
Individual Tree Detection based on aerial images
For the second step we used high resolution multispectral images for detecting individual treetops, applying the local maximum filtering method, where the central location of the crown is assigned the highest spectral value ([35], [13]). We applied fixed and varying sizes of moving window, based on the methodology proposed by Kumar ([13]) and Pereira ([25]). The window sizes varied from 0×3 m, 0×5 m, 0×7 m to 0×9 m ([13], [25]). The individual tree detection procedure was performed for each of the 4 spectral bands, and the first principal component (first PCA) of the bands ([35]). According to Wang et al. ([35]), the PCA effectively aggregates a large quantity of information and shows good results for ITD.
To generate the final ITD product, all five intermediate outputs were used. First, the layer with the highest number of detected trees, with their locations visually corrected, was taken as the basis for ITD. From this layer, we removed all the treetops in a 0.7 m buffer around each tree to avoid multiple peaks from single tree. Treetops detected in the second layer, outside this buffer were added creating a new layer of additional ITD points. This layer was then taken as the new basis for ITD. This procedure was repeated until all layers had contributed to the generation of a single ITD layer.
Merging the ITD approach with ABA
Based on the final ITD layer, stem counts were aggregated into 5 × 5 m grid cells, according to ABA. Following this, the number of trees in each grid cell was identified by local maxima derived from the ITD approach, resulting in a graphical representation of the number of trees per hectare for the entire study area.
Detection and correction of the mean difference (MD) in total area
The mean difference (MD) detection of the ITD approach was done by comparing the number of detected trees and the number of observed trees in the inventory plots. The difference between the two was considered the response variable, while the ALS and image variables were considered the predictor variables, leading to the modeling of the ITD mean difference, and its prediction for the entire study area. In our case this MD was modeled with 3 variables, maximum height, slope, and ITD detection, as explanatory variables. These variables were selected by applying the Best Subset Selection method and cross-validation, as described earlier. The MD detection model was applied to the entire study area, representing the MD per hectare, to correct the initial estimates of tree count per pixel.
Estimating individual tree volume
In order to generate the volume per tree in each 5 × 5 m cell, the previously-estimated stand volume for the entire study area (m3 ha-1), obtained by the integration of ALS data and high-resolution imagery, was divided by the number of trees per hectare detected by the ITD approach.
Results
Modeling approach to estimate total wood volume
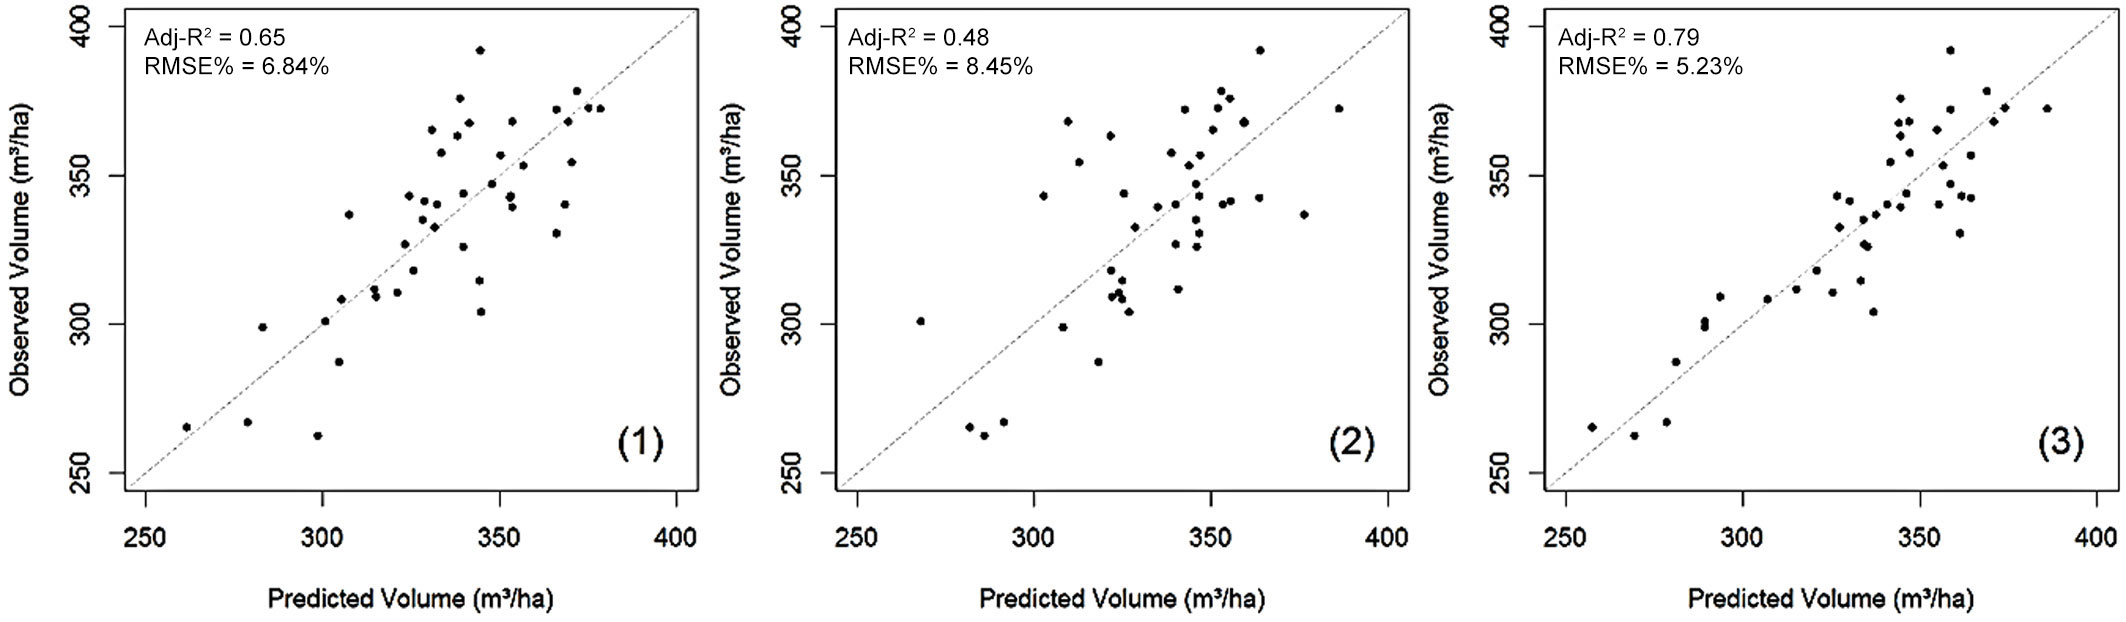
The best fitting models obtained by cross-validation contained 4 parameters, including the intercept, for all the three approaches tested (Tab. 3). In the first approach (using ALS data variables only), the chosen model was based on height percentiles (hp20, hp40, hp50) and elevation (Amean). In the second approach, where only image predictors were used, the selected variables were B3, NDVI, B1/B3 and B1/B4. In the third approach, where both remote sensing data sources were used as predictors, two ALS-based and two image-based variables were selected (hmode, Amean, B4, B2/B3). The RMSE for each approach was 6.84%, 8.45% and 5.23%, respectively. Among the three analyzed approach, we chose the model that combined ALS data and image information, according to the corresponding adjusted R² value (Tab. 3).
Tab. 3 - Fitting statistics of the best regression models used to estimate the total tree volume in the investigated area with three different approaches. (MD): Mean difference; (RMSE): root mean squared error; (Adj): Adjusted. For the acronym of variables included in the models, see Tab. 2.
| Approach | Regression Model Form | Adj-R² | MD | MD % | RMSE | RMSE % | p-value (t-test) |
|---|---|---|---|---|---|---|---|
| (1) ALS data | -585.17 + 22.48·(hp20) -165.27·(hp40) + 170.09·(hp50) + 0.22·(Amean) | 0.65 | 0.032 | 0.001 | 22.79 | 6.84 | 0.993 |
| (2) Aerial images | -585.17 + 7.859·(B3) -16167.59·(NDVI) -5101.24·(B1/B3) + 15192.15·(B1/B4) | 0.48 | 0.64 | 0.19 | 28.17 | 8.45 | 0.883 |
| (3) Both datasets | -625.16 + 27.74·(hmode) + 0.32·(Amean) + 1.97·(B4) -377.84·(B2/B3) | 0.79 | -0.06 | -0.018 | 17.43 | 5.23 | 0.983 |
Fig. 2 displays the relationship between the observed and predicted values of stand volume obtained for each approach. Although the homoscedasticity of residuals was not rejected, their distribution was asymmetric in the first and second approach, suggesting non-normality, while in approach 3 the distribution of residuals showed to match a normal distribution. Therefore, the third approach was selected for wall-to-wall stand volume prediction and subsequent comparisons with the inventory and mill-based volumes as reference values.
Fig. 2 - Scatterplot of the observed and predicted values of stand volume for each of the approaches analyzed in this study. (1) ALS data; (2) aerial images; (3) both datasets.
Across the whole study area, the mean estimated volume per hectare based on the ABA method was 319.9 m3, totaling 44.466.1 m3. When this result was compared with the volume measured at the mill (considered the true volume by the company), we found a difference of 2.98%, while when comparing the forest inventory data with the mill volume, it overestimated by 3.29%. In addition, it was observed that the combination of both ALS and imagery data could provide more information regarding the occurrence of drought and canopy gaps in the forest.
Semi-ITD approach to estimate wood volume per tree
Overall, using the ABA method 151.048 trees were detected in the study area, with an average of 994 trees ha-1, while the average number of trees per hectare estimated by the forest inventory was 1708 trees ha-1. Therefore, approximately 42% of the trees were not detected using the above approach, reinforcing the need to correct the remotely sensed tree count by modeling the tree count mean difference (MD).
After identifying the predictive mean difference model, we performed a linear adjustment using the least squares method. The model selected used three variables: maximum height (hmax); the slope (S) estimated from ALS data; and the number of trees detected in the aerial images found using the semi-ITD approach (Tab. 3), which had an RMSE of 12.66%.
The average number of trees per hectare detected by the conversion of ITD into ABA (semi-ITD) for the study area after mean difference (MD) correction was 1707.7, while the inventory data provided a figure of 1708.3 trees per hectare. Therefore, the mean volume per tree estimated from study data was 0.188 m3, while the mean volume of an individual tree derived from forest inventory was 0.195 m3. Fig. 3 shows the wall-to-wall tree volume maps generated in this work.
Fig. 3 - Maps of ABA-derived predictions for stand volume (top left), corrected number of trees (top right) and mean tree volume (bottom).

Discussion
Accurate stand attribute estimates are critical for effective forest plantation management, partly due to their markedly shorter rotation ages and faster growth rates relative to natural forests ([20]). Moreover, for proper management of forest plantations, information on individual trees is of high value ([33]). Remote sensing has proven to be an excellent data source for supporting sustainable forest management ([37]). However, obtaining accurate estimates of forest attributes is often still elusive ([30]). Our results indicate that the combination of different remote sensing data sources to estimate stand volume can lead to improved accuracy of predictions (RMSE = 5.23%).
In this research, we used two approaches to estimate stand volume in Eucalyptus spp. plantations using ALS as well as high spatial resolution multispectral image data. We first modeled the stand volume using ABA with different combinations of ALS- and image-derived metrics as input data, in three different models. Despite ABA slightly underestimated stand volume (2.98%) compared to the reference volume (total wood volumed measured at the mill) the results were close to those obtained by the forest inventory. However this approach could be enhanced by predicting the number of trees using the ITD approach, this introducing a correction method to improve tree count predictions. We then integrated that information with stand volume previously predicted using the ABA method, allowing for the calculation of mean individual tree volume.
The model applied in the volumetric prediction used two variables derived from aerial imagery, the near infrared band (B4) and the green/red (B2/B3) ratio, and two ALS-derived variables of height (hmode) and cover (Amean). Using the ratio between the green and red bands is analogous to using the near infrared and red bands ratio. The reflectance in the near infrared band is linked to scattering in the mesophyll, which occurs due to the interaction of solar radiation with the internal leaf structure ([4]). Similarly, green wavelengths are reflected by mesophilic leaf tissues, while red light is absorbed by chlorophyll ([4]). Therefore, the ratio between these bands is indicative of vegetative vigor and vegetative abundance. Both vigor and abundance information were important complements to the ALS metrics.
Despite the use of high-resolution imagery, the second approach (which used the aerial image variables) showed the poorest performance among the three approaches tested (RMSE = 8.45%).
Our results show that use of information from a single remote sensing technology can meet the predictive needs of plantation managers, so long as expectations of accuracy and precision are attained accordingly. However, our results also highlight that the integration of data from multiple remote sensing technologies, such as the ALS and high-resolution passive imagery data used here, can lead to more accurate results than the use of a single technology.
This improvement in accuracy is achievable even in situations where the difference in time between data acquisition (2012) and field measurement (2013) is up to one year, as is the case in this study. Because ALS data acquisition can be costly, the field measurement-remote sensing hybrid approach can be of remarkable benefit to forest managers. The integration of data from different sources with different acquisition dates can increase the useful life of forest attribute data collected by any means, potentially decreasing the frequency of acquisition and therefore reducing costs.
While ABA provided estimates of total wood volume for the entire study area, individual tree delineation, detected from passive image data, allowed us to downscale the estimates to the individual tree level. Images were used for tree detection instead of ALS data because the trees were planted at a relatively high density (3 × 2 m) resulting in small canopy sizes. Their small size made it challenging for crowns to intercept a sufficient number of LiDAR points for crown extent to be accurately defined. Therefore, the performance of ALS was poorer when detecting individual trees compared to image-based approaches.
Despite improvements over ALS data, we still found the accuracy of single tree detection from images to be unsatisfactory (58% correctly detected trees) and so a correction factor was introduced. This correction, based primarily on slope, allowed us to increase the accuracy of single tree detection and achieve unbiased individual tree volume estimates. Slope proved to be a key variable to include in the modeling of tree detection error. With increasing slope more trees were located in the same projected area, leading to an aggregation of the canopies and an increase in the maximum tree height of the inventory plots. Increased maximum tree height, therefore, showed a higher correlation with the standard deviation (i.e., heterogeneity) of a plot, which made tree detection from the images more difficult.
In general, the correction procedure applied to our tree counting process performed well, showing good agreement with existing tree count estimates and leading to individual tree volumes with negligible mean difference and low RMSE (12.66%). Our corrected estimates of tree count were greater than uncorrected values identified from the image-based detection by 713.7 trees per hectare, very close to extant estimates based on the forest inventory. The final estimates of individual tree volume after mean difference correction were 0.188 m3 per tree, 3.5% less than the inventory estimate ([33], [20]).
We demonstrated that a traditional ITD approach can be modified by using ABA, in spite of losing the exact location of each tree, but enabling to obtain the desired tree density information ([3]).
Conclusions
Accurate information about wood volume at both the stand and individual tree levels is required to support the effective management of forest plantations. In this study we enhanced the traditional area-based approach using individual tree detection. The integration of geometrical and spectral information provided by ALS and aerial imagery, respectively, allows for the reliable predictions of volume at both spatial scales. Moreover, remote sensing data integration results in lower mean difference and RMSE. Our approach allowed for the estimation of individual tree volume with negligible bias.
Acknowledgements
The authors would like to acknowledge the Brazilian Research Foundation, CNPq, and the National Institute for Space Research (INPE) for supporting this research, FIBRIA S/A cellulose company for supplying data from their plantation, and the Integrated Remote Sensing Studio (IRSS) at the Faculty of Forestry, University of British Columbia, Canada, for its assistance, support and friendship. David Williams provided some editorial assistance.
References
Gscholar
Gscholar
Gscholar
Gscholar
CrossRef | Gscholar
Gscholar
CrossRef | Gscholar
Online | Gscholar
Gscholar
Gscholar
Gscholar
Online | Gscholar
Online | Gscholar
Authors’ Info
Authors’ Affiliation
Yosio E Shimabukuro
Department of Remote Sensing, National Institute for Space Research - INPE, São Paulo (Brazil)
Piotr Tompalski
Department of Forest Resources Management, University of British Columbia, Victoria, BC (Canada)
Department of Forest Sciences, Luiz de Queiroz College of Agriculture, University of São Paulo , Piricicaba (Brazil)
Corresponding author
Paper Info
Citation
Shinzato ET, Shimabukuro YE, Coops NC, Tompalski P, Gasparoto EAG (2016). Integrating area-based and individual tree detection approaches for estimating tree volume in plantation inventory using aerial image and airborne laser scanning data. iForest 10: 296-302. - doi: 10.3832/ifor1880-009
Academic Editor
Piermaria Corona
Paper history
Received: Sep 21, 2015
Accepted: Aug 26, 2016
First online: Dec 15, 2016
Publication Date: Feb 28, 2017
Publication Time: 3.70 months
Copyright Information
© SISEF - The Italian Society of Silviculture and Forest Ecology 2016
Open Access
This article is distributed under the terms of the Creative Commons Attribution-Non Commercial 4.0 International (https://creativecommons.org/licenses/by-nc/4.0/), which permits unrestricted use, distribution, and reproduction in any medium, provided you give appropriate credit to the original author(s) and the source, provide a link to the Creative Commons license, and indicate if changes were made.

Web Metrics
Breakdown by View Type
Article Usage
Total Article Views: 53690
(from publication date up to now)
Breakdown by View Type
HTML Page Views: 43681
Abstract Page Views: 4178
PDF Downloads: 4374
Citation/Reference Downloads: 44
XML Downloads: 1413
Web Metrics
Days since publication: 3478
Overall contacts: 53690
Avg. contacts per week: 108.06
Article Citations
Article citations are based on data periodically collected from the Clarivate Web of Science web site
(last update: Mar 2025)
Total number of cites (since 2017): 13
Average cites per year: 1.44
Publication Metrics
by Dimensions ©
Articles citing this article
List of the papers citing this article based on CrossRef Cited-by.
Related Contents
iForest Similar Articles
Research Articles
Integration of tree allometry rules to treetops detection and tree crowns delineation using airborne lidar data
vol. 10, pp. 459-467 (online: 04 April 2017)
Research Articles
Three-dimensional forest stand height map production utilizing airborne laser scanning dense point clouds and precise quality evaluation
vol. 10, pp. 491-497 (online: 12 April 2017)
Research Articles
Are we ready for a National Forest Information System? State of the art of forest maps and airborne laser scanning data availability in Italy
vol. 14, pp. 144-154 (online: 23 March 2021)
Research Articles
Efficient measurements of basal area in short rotation forests based on terrestrial laser scanning under special consideration of shadowing
vol. 7, pp. 227-232 (online: 10 March 2014)
Review Papers
Accuracy of determining specific parameters of the urban forest using remote sensing
vol. 12, pp. 498-510 (online: 02 December 2019)
Research Articles
Identification and characterization of gaps and roads in the Amazon rainforest with LiDAR data
vol. 17, pp. 229-235 (online: 03 August 2024)
Research Articles
Optimizing line-plot size for personal laser scanning: modeling distance-dependent tree detection probability along transects
vol. 17, pp. 269-276 (online: 07 September 2024)
Research Articles
Determining basic forest stand characteristics using airborne laser scanning in mixed forest stands of Central Europe
vol. 11, pp. 181-188 (online: 19 February 2018)
Research Articles
Estimation of aboveground forest biomass in Galicia (NW Spain) by the combined use of LiDAR, LANDSAT ETM+ and National Forest Inventory data
vol. 10, pp. 590-596 (online: 15 May 2017)
Technical Advances
Forest stand height determination from low point density airborne laser scanning data in Roznava Forest enterprise zone (Slovakia)
vol. 6, pp. 48-54 (online: 21 January 2013)
iForest Database Search
Search By Author
Search By Keyword
Google Scholar Search
Citing Articles
Search By Author
Search By Keywords
PubMed Search
Search By Author
Search By Keyword


