Efficient measurements of basal area in short rotation forests based on terrestrial laser scanning under special consideration of shadowing
iForest - Biogeosciences and Forestry, Volume 7, Issue 4, Pages 227-232 (2014)
doi: https://doi.org/10.3832/ifor1084-007
Published: Mar 10, 2014 - Copyright © 2014 SISEF
Research Articles
Abstract
Terrestrial laser scanning has been used in forest research for about ten years and use-orientated applications are of increasing importance. The effect of shadowing in single location laser scanning, e.g., as used for biomass estimations, has not been quantified so far even though it affects the quality of information derived from the laser scans. In our study we quantified the effect of shadowing on automated basal area measurements in a densely stocked poplar short rotation forest and developed a method to correct unsampled areas. We found that on average about 5.0 ± 2.5% of the plot area (12.56 m²) was not sampled by the laser scanner due to shadowing. Efficient basal area measurements based on terrestrial laser scanning were possible and if a correction factor was derived from the scan data, the effects of shadowing could be accounted for. The relative mean absolute error could then be lowered from 9.8% to 8.4%. This new method allows fast, fully objective, and precise plot-level measurements of basal area considering the effects of shadowing. It could be applied in the future to support monitoring growth developments in densely stocked stands such as short rotation forests.
Keywords
Ground Based LiDAR, Non-detection Bias, Angle Count Method, Poplar Short Rotation Forest
Introduction
The area of short rotation forests (SRF) is expected to increase for many European countries in the near future (e.g., [3], [15], [1]). In Sweden for example, SRF will probably be conducted on around 30 000 ha in the next years, which is more than twice the area of 2011 ([10]). Today, about 6 000 ha of poplar SRF can be found in Italy, 3 000 ha in Poland and the UK, and approximately 1 500 ha in Germany ([4]). The increasing importance in SRF is supported by the agricultural policy of the European Commission which aims at increasing the production of bioenergy from renewable energy source in order to mitigate climate change by reducing the emission of carbon dioxide from burning fossil fuels ([7], [8], [5]). Two energy crops widely grown in SRF in Europe are willow (Salix spp.) and poplar (Populus spp.) as reviewed by Djomo et al. ([5]). Both are often cultivated in dense stands of up to 15 000 plants per ha for poplar (e.g., [22]) and more than 100 000 plants per ha in case of willow (e.g., [2]). So far, it has been a challenge to estimate the biomass of dense stands with non-destructive methods and reasonable effort. However, such measurements are needed for various reasons, e.g., to monitor the growth of a stand, to evaluate the market value, or to allow growth performance comparisons among different management approaches, sites, or planting designs.
Traditional approaches are laborious as they usually require manually measuring single tree parameters, with diameter at breast height (DBH) probably being the most important (e.g., [20], [23]).
Terrestrial laser scanning (TLS) has shown to be able to provide data which can be used to estimate the DBH of trees ([18]). Such data is usually derived from multiple scans that are combined via reference points ([13], [19]). A small number of studies focused on deriving DBH estimates from single scans which are less laborious to obtain than combined multiple scans ([16], [12], [14], [18]). Approaches based on single scans to automatically derive DBH estimates allow working in densely stocked forests where visibility is too low to use reference points (targets) within the scanned scene. A laser scanner scans its surroundings by emitting laser beams and receiving these beams if they are reflected by any object in the vicinity. Modern scanners like Faro Focus 3D (Faro Technologies Inc., Montreal, Canada) or Z+F Imager 5010 (Zoller and Fröhlich GmbH, Wangen, Germany) measure the three-dimensional coordinates of up to 1 000 000 points per second. For this reason, stands with higher stocking densities result in higher numbers of reflected beams. However, the duration of each measurement is independent on the number of received reflections and requires the same amount of time in dense or open stands, which is in contrast to conventional inventory methods. Single scan approaches do not require setting up targets in the field and the post-processing is less time-consuming, since there is no registration process. The problem with single scan approaches is that trees, especially those with small DBH, can often not be identified in the point cloud data ([12], [18]). So far, it is not entirely clear to what extent different error sources contribute to the problem of non-detection. Firstly, instrument insufficiencies in acquiring the trees with a large enough number of accurate laser reflections measured (instrument bias) can produce errors. These are difficult to quantify as true basal areas are difficult to retrieve without destructive sampling ([14]). Secondly, current algorithms face problems deriving the DBH of trees when these are only based on a small amount of points or irregular tree shapes (processing bias - [16]). Thirdly, bias may result from trees that have simply not been detected in the scan due to “shadowing” (nondetection bias), a problem also known for other instruments ([17]). In case of TLS, the term “shadowing” basically describes the fact that there are objects which are located in the “shadow” of other objects which are standing closer to the scanner. The “shadowed” objects can hence not be detected by the scanner.
In theory, all three problems occur together since the structural complexity of a forest stand results in a complex point cloud. However, since scanning resolutions have constantly increased in the past, the probability of an instrument bias is close to zero when plots measured are small in radius. The instrument and scan settings used in studies must be of high resolution to reduce unsampled areas as a result of the scanners angular measurement scheme, which is possible with modern instruments ([25], [18]). A small angular step width of 0.036° between two neighboring beams in combination with a beam diameter of 3 mm (measured in 1 m distance) results in a beam overlap within short distances from the scanner, or in other words, a complete coverage of the scanners vicinity ([26]).
In contrast to the instrument bias, the processing bias is considered to be of greater importance. Even though algorithms are frequently improved, they cannot interpret a scan image containing 3D structures as good as a human operator can, and there is probably still much work to be done ([21]). Algorithms to identify trees are based on several assumptions regarding the shape of a tree stem (e.g., circularity, surface roughness, growth direction) which might not always be valid for a geometrically complex structured object like a SRF. However, algorithms will continue to improve and result in an increasing reliability of the tree identification. One example was given by Lovell et al. ([12]) who used the intensity image of a scan instead of the geometric features. Hence, we believe that quantifying the effects of the nondetection bias (shadowing) may help to interpret laser scanning measurements conducted in dense stands. Shadowing is a physical limitation of the technology that could only be avoided if x-rays were to be used, which is unlikely in natural environments. In fact, the phenomenon is known as “nondetection bias” from other measurement procedures applied in forests, e.g., angle count sampling ([17]). This phenomenon occurs in all single scan based applications of TLS. Shadowing reduces the amount of useful information that can be derived from the scan data ([24]).
In the study presented, we applied TLS to an experimental poplar SRF and addressed the accuracy of a scan-based automated basal area measurement on plots with a 2 m radius. We aimed at quantifying the effect of shadowing by using field validation data that allowed tree-to-tree comparisons. Our overall goal was to calculate a site-specific correction factor that can be derived from information made available by the scan data and allows correcting the effect of shadowing.
Methods
Study site
This study was conducted in an experimental SRF of the poplar hybrid clone “Japan 105” (Populus maximowiczii A.Henry x Populus nigra L.) which was planted in 2007 with a higher-than-usual density of 26 660 plants per ha. The study site is located in Central Germany close to the village of Großfahner in Thuringia (51°3’31.35” N; 10°49’28.46” E) and is characterized by a sub-continental climate with a mean annual precipitation of 524 mm and a mean annual temperature of 10.3 °C (1971-2000 - [6]).
Terrestrial laser scanning
In March 2013 a series of measurements was conducted in the SRF using the terrestrial laser scanner Z+F Imager 5006 (Zoller and Fröhlich, Wangen, Germany) which was mounted on a tripod.
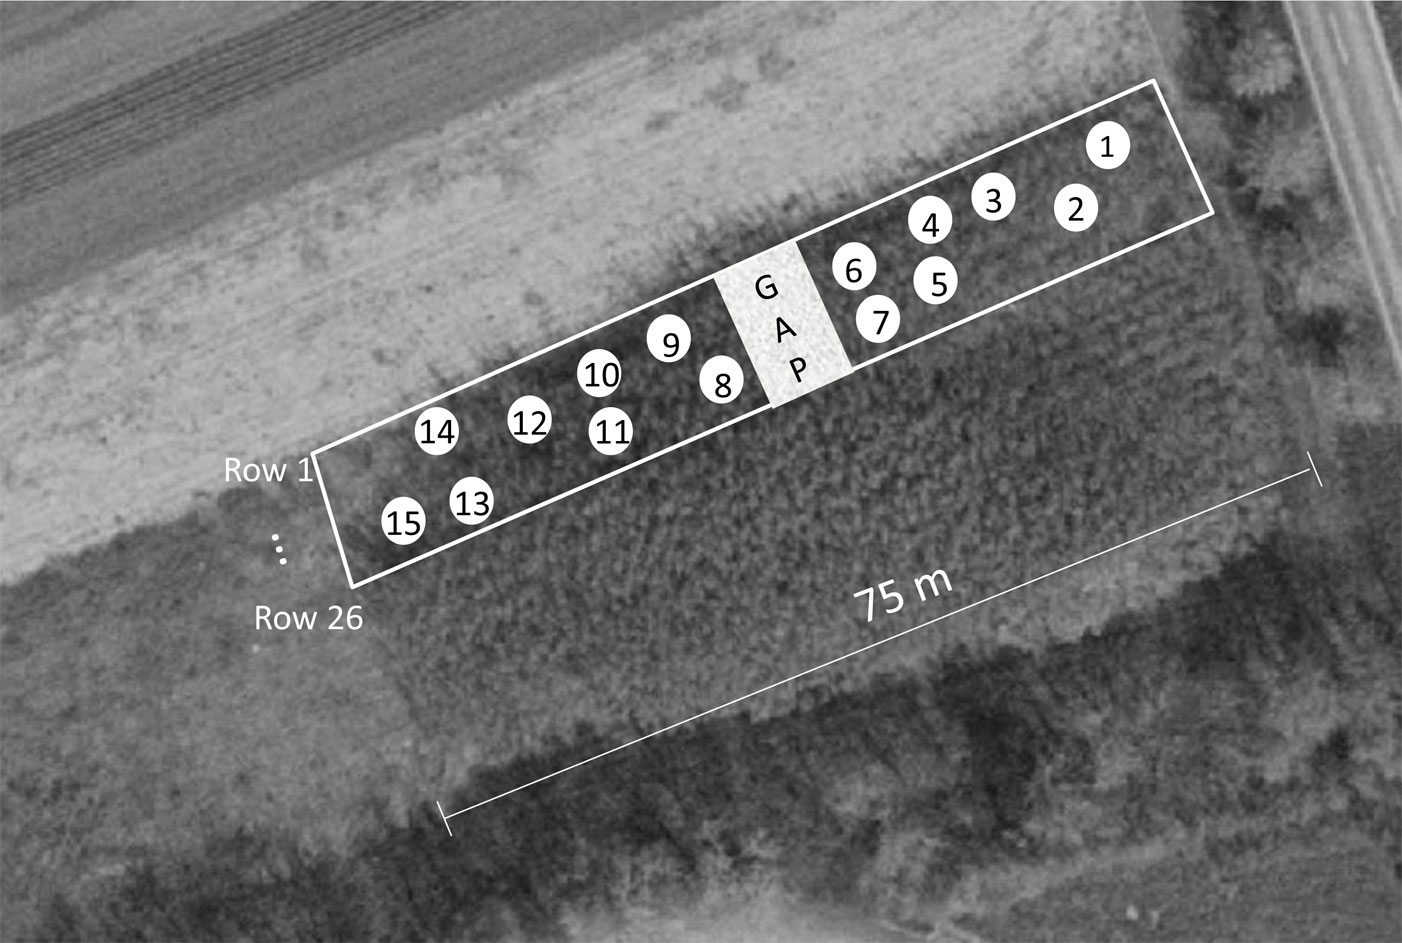
The scanning approach was based on a plot design with 15 fixed circular plots (radius = 2 m - see Fig. 1, no.1-15). The plot locations within the stand were based on a list of randomly selected xy-coordinates. A single laser scan was performed in the center of each plot with a field of view of 310° vertically and 360° horizontally and a resolution (angle between neighboring laser beams) of 0.036°. This setup resulted in more than 40 million laser measurements per scan, with each measurement being a single laser beam (wavelength: 650-690 nm) emitted from the instrument and detected by the same if reflected by an object. In cases where the distance between plot center and trees was < 50 cm the next available stem-free position was chosen to ensure enough space for the laser scanner to operate.
Fig. 1 - Aerial image of the studied short rotation coppice (including gap) with map of the circular study plots (1-15) overlaid.
Reference data
As reference for the TLS, the DBH (diameter of tree measured at 1.3 m above the ground) of all trees with stem located within the plot circle was measured in March 2013 using a standard caliper with millimeter accuracy. Whether trees belonged to the plot was determined with a scaled pole of 2 m length which was horizontally mounted on the scanner at one end whereas the other end rotated around the instrument in a horizontal plane. The plot boundary was located at the rotating end of the pole and only trees reached by the pole were included. Furthermore, it was recorded whether the half cross sections of the stems were physically visible from the scanner. This data was used to quantify the shadowing effect in the investigated plots. Average height of the stand was about 9.5 m as derived from the laser scans using the mean vertical difference between the highest and lowest laser measurement on each plot.
Based on the mean number of stems measured for DBH in each plot, tree density was 22 679 ± 5 446 (st. dev.) stems ha-1.
Data processing
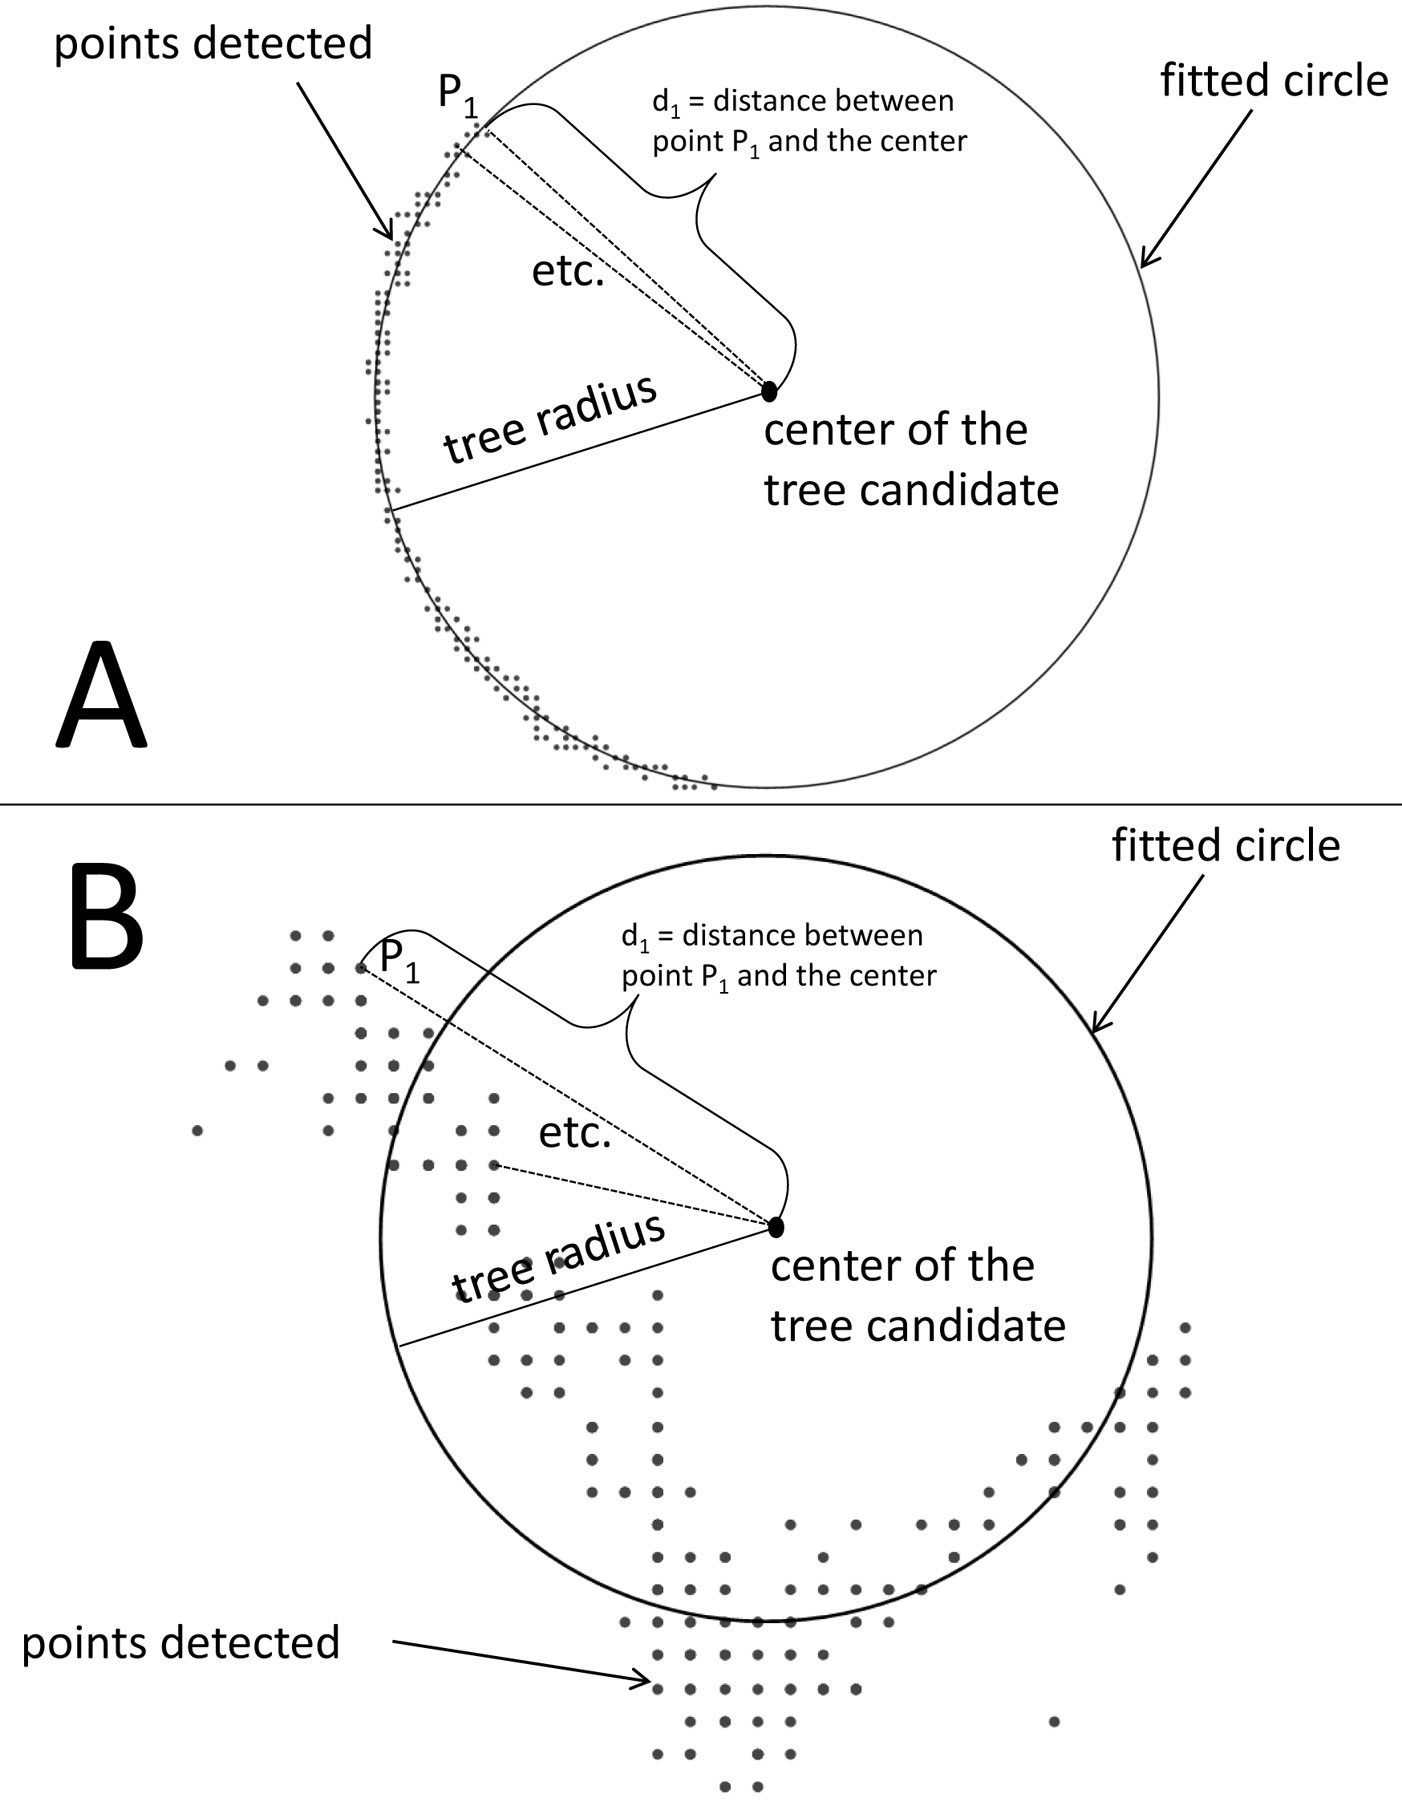
Field scanning data were stored as zfs-file on the scanner’s hard disk. The zfs-files were converted to a xyz-file type later, using the software ZF “Laser control” (Zoller and Fröhlich, Wangen, Germany). Each xyz-file contained the three-dimensional Cartesian coordinates of each point detected by the scanner. The software Mathematica 9 (Wolfram Research, Champaign, IL, USA) was used to process the xyz files with an algorithm that automatically derives the basal areas of the scanned plots. To apply the algorithm, the scans were reduced to the circular plot area of 2 m radius in a first step. A horizontal slice of 1 cm thickness at breast height (1.295-1.305 m) was then selected from this circular plot in a next step. All points of this slice were sorted according to their azimuth angle and grouped depending on their distance to the scanner. Such directional groups of points with only small point-to-point distances (maximum set 1 mm for two neighboring points) can be considered as belonging to the surface of a single stem. A quality criterion was used to automatically classify tree and no-tree point groups based on the circularity of the point clouds. Therefore, a circle-fit based on QR decomposition ([9]) was applied to each group of points. The center coordinates and the radius of the circles were only calculated if the circle-fit was based on at least 100 points. All points used for a circle-fit were assumed to be part of one half of the trees’ cross section, also known as “crescent moon”-shaped stem surface ([11]). In a next step it was tested whether these points lay on the line describing the circle fitted to the points. For a theoretical perfectly circular stem and a successful circle-fit, all points would have the same distance to the stem center and this distance would be equal to the radius of the stem. Hence, we tested if the ratio of the mean Euclidean distance between all potential tree stem surface points and circle center by the circle radius was close to one. All point groups for which this quotient was at least 0.99 were considered to have a successful circle-fit. The basal area, based on the DBH, was then calculated for these trees and the whole plot (Fig. 2).
Fig. 2 - Exemplary point groups identified by the algorithm that are either classified as tree (A) or no tree (B) according to the ratio between the mean distance of each point to the circle center (center of the tree) and the circle radius (tree radius). All point groups with a quotient smaller than 0.99 were not classified as tree because the points are not located on a circular line.
Correcting the shadowing effect
The position of a stem identified (center coordinates obtained from TLS) and the reference data from the field were used to perform a tree-to-tree comparison. This allowed analyzing the effect of shadowing for the basal area measurement accuracies and gave insights to main error sources of the TLS-based approach. To estimate the shadowing effect, we calculated the actual unsampled area of each plot by considering each trees’ DBH and distance to the scanner.
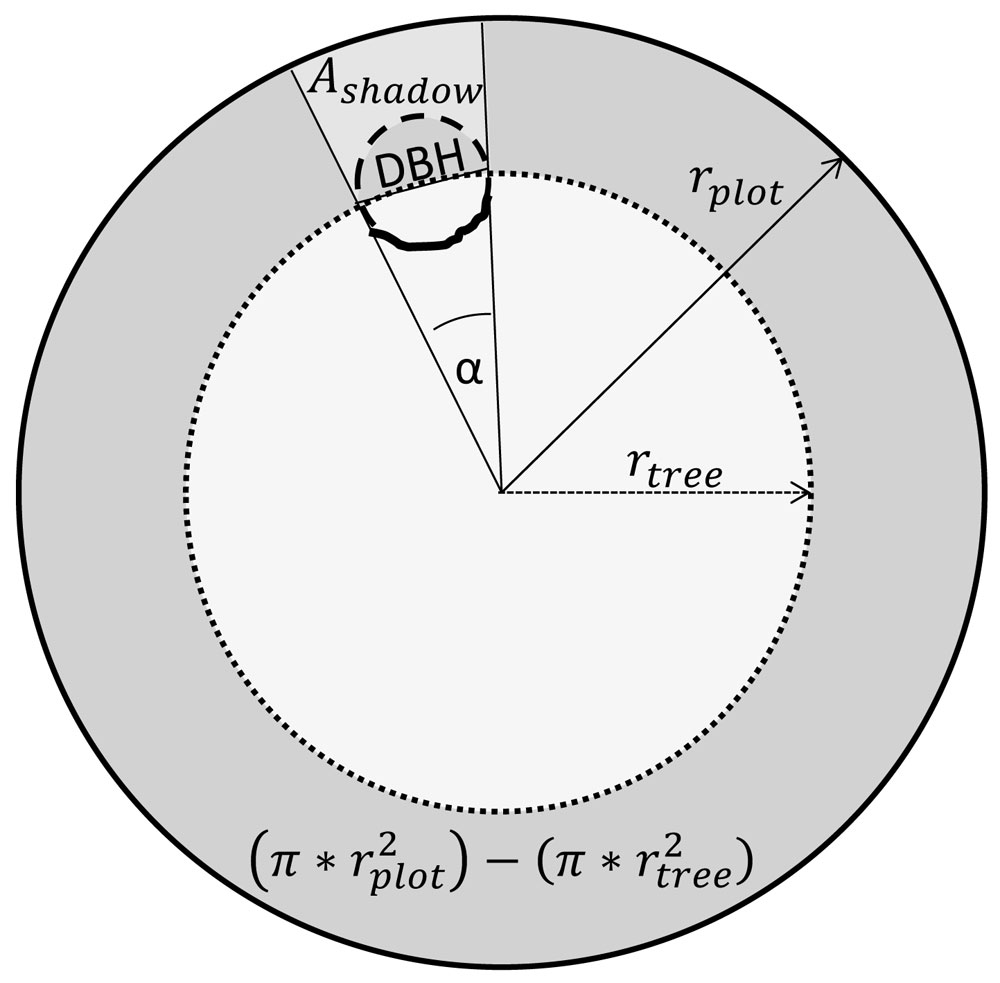
Both variables could be derived from the scan measurements for each tree identified. The shadow area of a tree was calculated with the following formula (eqn. 1):
where Ashadow is the area shadowed by the tree and invisible from the scanner, rplot is the plot radius (2 m), rtree is the distance between tree and scanner, and DBH is the diameter at breast height. Half the tree’s cross section is finally to be subtracted, to obtain the area shadowed by the tree. This is necessary because the cross sectional area of the tree casting the shadow is not available as potential growing area for another tree. All shadowed, unsampled areas were summed up at plot level and subtracted from the plot area. Fig. 3 illustrates the quantification of the shadow area of a tree on the plot level.
Fig. 3 - Graphical illustration for the calculation of the shadow area behind a tree. The circular area described by a circle with the radius rtree is subtracted from the whole plot area of 12.57 m2. The remaining ring (dark grey) corresponds to 360°, hence, the shadowed area behind a tree (Ashadow) can be calculated as a certain portion of this ring defined by the angle α and reduced by half the area of the trees cross section. This angle is defined by the inverse tangent of the quotient.
The unsampled area percentage per plot (e.g., 3%) was used to derive a plot specific correction factor for the basal area per plot. For an unsampled area of 3% the correction factor would be 1.03 to increase the plot basal area to 103% of what was actually measured, e.g., 1.03 x plot basal area equals the corrected plot basal area.
A t-test was used to test whether tree detectability by the scanner affected the DBH estimation error, by comparing the errors of entirely visible trees with trees partially covered by other trees. Normality (Shapiro- Wilk-Test) of the data and homogeneity of variances (Bartlett-Test) was tested using R (R version 2.15.3, The R Foundation of Statistical Computing, Vienna, Austria). We also used R to determine Pearson correlation coefficients, coefficients of determination and p-values for the linear regressions presented.
Results
Tree identification and DBH measurement
We found that by using the TLS mainly trees small in DBH were not identified by the algorithm, resulting in a tree identification rate of only 45.6%, or 195 out of 428 trees. Consequently, the detected trees had a mean DBH of 5.7 ± 2.6 cm, which was considerably higher than for the trees in the reference data (mean: 3.6 ± 2.6 cm). No tree with a DBH smaller than 1.3 cm was identified by the algorithm.
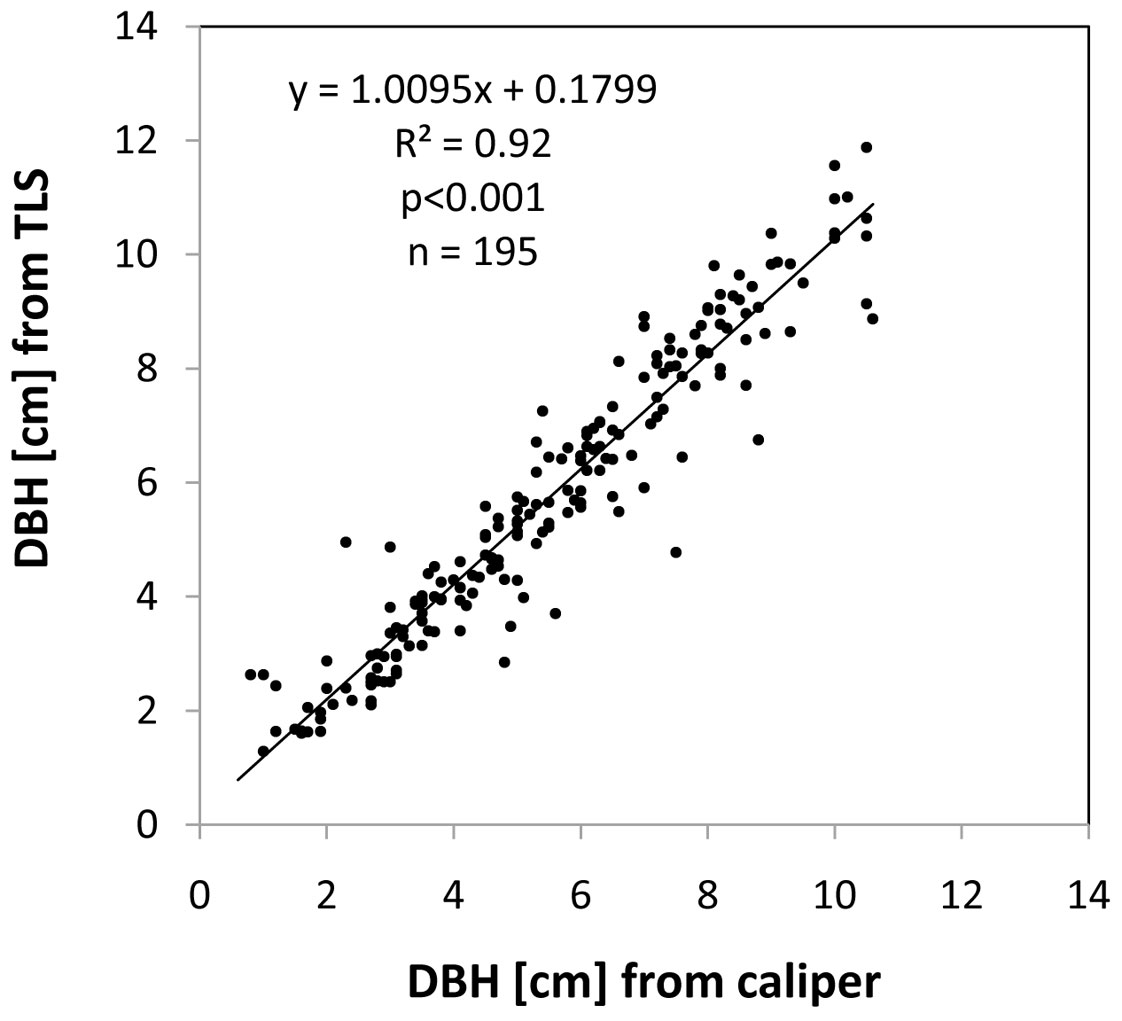
The coefficient of determination (R²) for the linear regression between the DBH values derived from the laser scans and those obtained from the reference data was 0.92 (see Fig. 4). The relative mean absolute error (relative MAE), which was calculated as the mean absolute error of all scan-based measurements expressed relative to the mean of the reference values, was 16%.
Fig. 4 - Relationship between the caliper-based measurements of DBH and the diameters obtained from the laser scanning approach for 195 trees measured with both instruments.
Basal area determination on the plot level
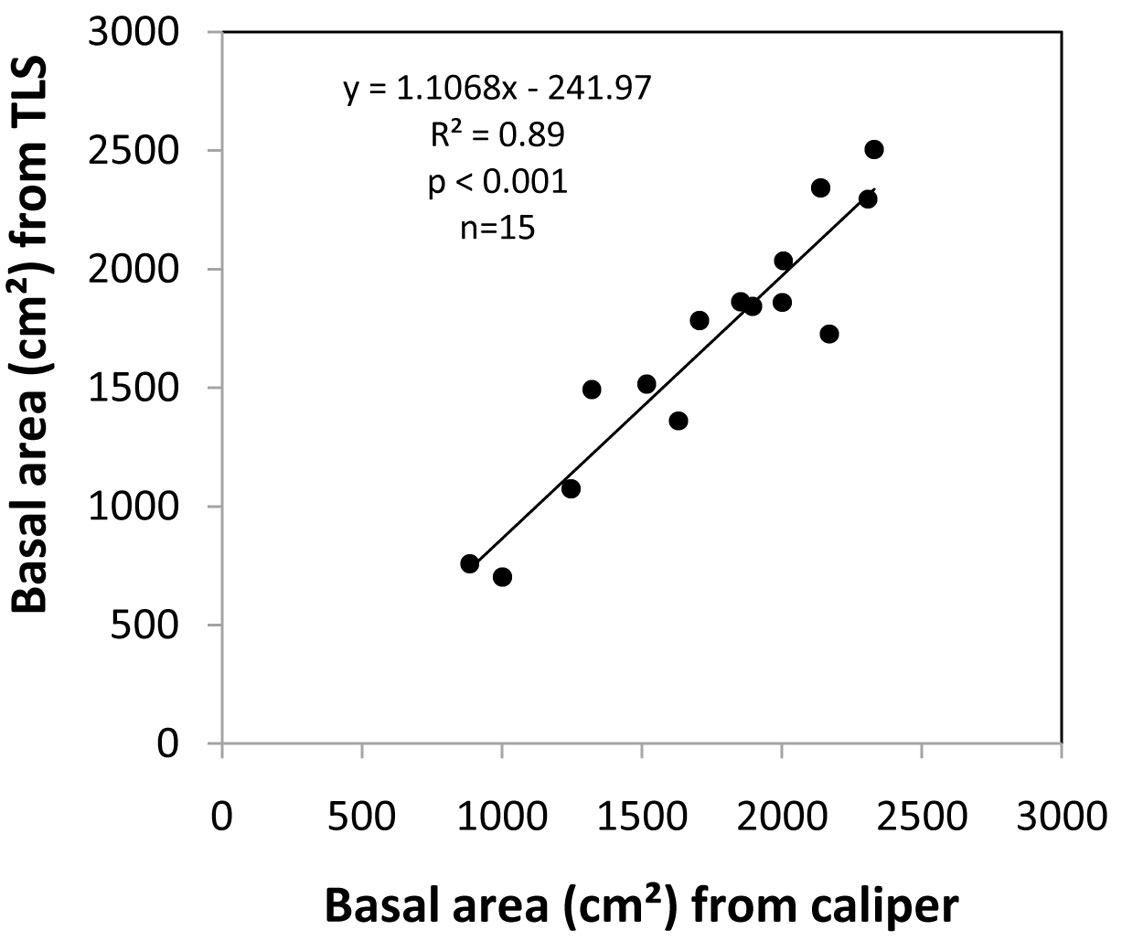
We found a good congruence between the basal area values on plot level obtained from the two different approaches. A significant correlation (p<0.001) and a coefficient of determination (R²) of 0.9 could be achieved for the linear model fit to the TLS-based measurements corrected for shadowing and explained by caliper-based measurements on the 15 plots (see Fig. 5). With 8.4% the relative MAE of the scan-based measurements was low (9.8% for the uncorrected TLS data).
Fig. 5 - Relationship between the caliper-based measurements of basal area on the plot level and basal areas obtained from the laser scanning approach (corrected data) for all 15 plots.
As expected based on the low tree identification rate for the TLS measurements, the basal area of 12 out of the 15 plots was underestimated. In two cases the TLS slightly overestimated the plot level basal area as a result of a rather large overestimation of DBH values from a few large trees, in combination with comparatively high tree identification rates.
Quantifying the effect of shadowing
The stems at breast height of 62 out of 428 trees (14.5%) could not be freely seen from the scanners perspective. These trees had a high probability to remain undetected by the scanner and, hence, not appear in the scan data. However, a DBH estimation from the scan data was finally only impossible for 30 of these trees because their visible stem parts were too small to allow a DBH estimation. These trees had a mean DBH of 2.00 ± 1.49 cm. This shows that in many cases even fragmented parts of the cross section were sufficient to estimate the tree DBH if its DBH was not too small.
We found no significant differences between DBH measurement errors of trees that were based on fragmented tree cross sections and trees that were entirely visible. In both cases branching pattern at breast height or stem shape irregularity seem to be of greater importance than the number of points per se in controlling the circle fit quality.
On average, 4.0 ± 2.1 trees per plot (range: 0-8) stood on the shadow of other trees and could not be seen from the scanners perspective. The total basal area of the hidden trees missed by the TLS was 3635.1 cm² (14% of the overall basal area). We found no significant correlations between these field-based estimations of hidden tree’s basal areas and the actual measurement error of the TLS-based approach for the whole plot (p-value = 0.162). From comparing the trees identified by the TLS with the reference data, we found that the error of the basal area measurement was actually small. While the “true” basal area on the plots was 26 008.5 cm2, the scan approach detected 23 829.6 cm2, which equals 91.6% (8.4% missed). On single plot level, an average of 90.60 ± 10.36% of the basal area calculated from the reference data could also be identified in the scan data.
With the plot-specific correction factor (in our study: 5.2 ± 2.5% - see above) we were able to reduce the relative MAE of the basal area measurement from TLS by 1.4 to 8.4%.
Hence, shadowing resulted in visually overseeing 14% of the trees, whereas a basal area could subsequently be assigned to about 50% of these trees. So shadowing was only a minor error source if taken into account that the basal area of all these trees accounted for only 2.4% of the plots total.
Discussion
Stands with high stem densities, many thin stems, and only a few thick stems suffer from low tree identification rates when measured with TLS in single scan designs. Lovell et al. ([12]) reported a tree detection rate of 54% (here: 46%) when applying their sophisticated intensity based algorithm to a forest with much larger trees than those found in our study.
However, we showed that basal area estimations at the plot level can be fairly accurate anyway. The successful identification of larger trees and their disproportionally high contribution to plot level estimates of the basal area and other variables resulted in overall errors of less than 10% even though many trees remained unidentified. This phenomenon was already observed in other studies dealing with very dense stands (e.g., [18]). As a consequence, the mean basal area detection rate of 90.6% per plot stands in contrast to a low tree identification rate in this study.
By correcting the scan-based basal area measurements, using the proportion of unsampled area in the shadow of the detected trees, we were able to reduce the effect of shadowing. Our approach did not consider the partial overlapping of trees which results in multiple shadows on the same ground area. This should have caused a small overestimation of the shadowed area in this study and still requires improvement of the current algorithms. Also, the visibility of the trees in the stand was improved due to the fact that the trees in the investigated SRF were planted in rows. The scanner was rarely placed in line with a tree row since handling the scanner required a minimum space of 0.5 m around the scanner which was usually not the case within the tree rows. Therefore, the scanner was often positioned away from the rows as previously described. For this reason, partial overlapping was rather rare in this study but could be more of an issue in other stands.
Difficulties in the automatic, algorithm-based identification of small trees, using only a limited number of laser points per stem cross section, were much more of an issue for the overall error in TLS-based basal area estimations. This processing bias alone accounted for a total cross sectional area that was 4163.1 cm2 (16%) smaller for the TLS estimations compared to the reference data. Interestingly, the difference in the overall basal area measured by the two approaches was only 2178.9 cm2. This is due to a small compensation of the total basal-area underestimation in the scan data by frequent slight overestimates of the DBH for identified trees. Increasing scanning resolutions may reduce this error since a greater number of points will be available for circle fitting even if stem cross sections are small. Both, tree identification rate and DBH measurement accuracy will hence profit from an increased scanning resolution.
Conclusions
In summary it can be stated that TLS measurements resulted in reliable estimations of the basal area in the investigated SRF even if not all trees were identified and shadowing effects occurred. Considering the high efficiency and objectivity of the proposed TLS approach, the constantly decreasing price for the scanning instrument, and the quality of the measurements (error < 8.4%), TLS can be recommended to measure the basal area in dense stands like poplar SRF.
Acknowledgements
We would like to thank Dirk Böttger, Falk Richter, and Konrad Seidel for their help during the field work. The work was founded by the German Federal Ministry of Education and Research (BMBF) and is part of the BEST-Research Framework (⇒ http://www.best-forschung.de).
References
CrossRef | Gscholar
Online | Gscholar
Gscholar
Gscholar
Gscholar
Gscholar
Authors’ Info
Authors’ Affiliation
Christian Ammer
Chair of Silviculture and Forest Ecology of the Temperate Zones, Faculty of Forest Science and Forest Ecology, University of Göttingen, Büsgenweg 1, 37077 Göttingen (Germany)
Corresponding author
Paper Info
Citation
Seidel D, Ammer C (2014). Efficient measurements of basal area in short rotation forests based on terrestrial laser scanning under special consideration of shadowing. iForest 7: 227-232. - doi: 10.3832/ifor1084-007
Academic Editor
Agostino Ferrara
Paper history
Received: Jul 25, 2013
Accepted: Feb 09, 2014
First online: Mar 10, 2014
Publication Date: Aug 01, 2014
Publication Time: 0.97 months
Copyright Information
© SISEF - The Italian Society of Silviculture and Forest Ecology 2014
Open Access
This article is distributed under the terms of the Creative Commons Attribution-Non Commercial 4.0 International (https://creativecommons.org/licenses/by-nc/4.0/), which permits unrestricted use, distribution, and reproduction in any medium, provided you give appropriate credit to the original author(s) and the source, provide a link to the Creative Commons license, and indicate if changes were made.
Web Metrics
Breakdown by View Type
Article Usage
Total Article Views: 59374
(from publication date up to now)
Breakdown by View Type
HTML Page Views: 48602
Abstract Page Views: 4866
PDF Downloads: 4429
Citation/Reference Downloads: 24
XML Downloads: 1453
Web Metrics
Days since publication: 4350
Overall contacts: 59374
Avg. contacts per week: 95.54
Article Citations
Article citations are based on data periodically collected from the Clarivate Web of Science web site
(last update: Mar 2025)
Total number of cites (since 2014): 30
Average cites per year: 2.50
Publication Metrics
by Dimensions ©
Articles citing this article
List of the papers citing this article based on CrossRef Cited-by.
Related Contents
iForest Similar Articles
Review Papers
Analysis of full-waveform LiDAR data for forestry applications: a review of investigations and methods
vol. 4, pp. 100-106 (online: 01 June 2011)
Review Papers
Remote sensing-supported vegetation parameters for regional climate models: a brief review
vol. 3, pp. 98-101 (online: 15 July 2010)
Review Papers
Accuracy of determining specific parameters of the urban forest using remote sensing
vol. 12, pp. 498-510 (online: 02 December 2019)
Research Articles
Identification and characterization of gaps and roads in the Amazon rainforest with LiDAR data
vol. 17, pp. 229-235 (online: 03 August 2024)
Research Articles
Integrating area-based and individual tree detection approaches for estimating tree volume in plantation inventory using aerial image and airborne laser scanning data
vol. 10, pp. 296-302 (online: 15 December 2016)
Research Articles
Classification of xeric scrub forest species using machine learning and optical and LiDAR drone data capture
vol. 18, pp. 357-365 (online: 07 December 2025)
Review Papers
Remote sensing of selective logging in tropical forests: current state and future directions
vol. 13, pp. 286-300 (online: 10 July 2020)
Technical Reports
Remote sensing of american maple in alluvial forests: a case study in an island complex of the Loire valley (France)
vol. 13, pp. 409-416 (online: 16 September 2020)
Research Articles
Estimation of aboveground forest biomass in Galicia (NW Spain) by the combined use of LiDAR, LANDSAT ETM+ and National Forest Inventory data
vol. 10, pp. 590-596 (online: 15 May 2017)
Research Articles
Above ground biomass estimation from UAV high resolution RGB images and LiDAR data in a pine forest in Southern Italy
vol. 15, pp. 451-457 (online: 03 November 2022)
iForest Database Search
Search By Author
Search By Keyword
Google Scholar Search
Citing Articles
Search By Author
Search By Keywords
PubMed Search
Search By Author
Search By Keyword

