Are we ready for a National Forest Information System? State of the art of forest maps and airborne laser scanning data availability in Italy
iForest - Biogeosciences and Forestry, Volume 14, Issue 2, Pages 144-154 (2021)
doi: https://doi.org/10.3832/ifor3648-014
Published: Mar 23, 2021 - Copyright © 2021 SISEF
Research Articles
Abstract
Forest planning, forest management, and forest policy require updated, reliable, and harmonized spatial datasets. In Italy a national geographic Forest Information System (FIS) designed to store and facilitate the access and analysis of spatial datasets is still missing. Among the different information layers which are useful to start populating a FIS, two are essential for their multiple use in the assessment of forest resources: (i) forest mapping, and (ii) data from Airborne Laser Scanning (ALS). Both layers are not available wall-to-wall for Italy, though different local sources of information potentially useful for their implementation already exist. The objectives of this work were to: (i) review forest maps and ALS data availability in Italy; (ii) develop for the first time a high resolution forest mask of Italy which was validated against the official statistics of the Italian National Forest Inventory; (iii) develop the first mosaic of all the main ALS data available in Italy producing a consistent Canopy Height Model (CHM). An on-line geographic FIS with free access to both layers from (ii) and (iii) was developed for demonstration purposes. The total area of forest and other wooded lands computed from the forest mask was 102.608.82 km2 (34% of the Italian territory), i.e., 1.9% less than the NFI benchmark estimate. This map is currently the best wall-to-wall forest mask available for Italy. We showed that only the 63% of the Italian territory (the 60% of the forest area) is covered by ALS data. These results highlight the urgent need for a national strategy to complete the availability of forest data in Italy.
Keywords
National Datasets, Forest Inventory, Forest Monitoring, Forest Mask, Airborne Laser Scanning, LiDAR
Introduction
Forest mapping is an important source of information for assessing woodland resources and a key issue for any National Forest Inventory (NFI) programme ([51]). Nowadays, global and nationwide wall-to-wall, raster-type maps of forest resources, based on satellite images, laser scanning, aerial orthomosaic and photogrammetric point cloud data are considered essential to monitor and quantify forest variables ([20], [51], [28], [10]). Forest maps are currently produced on the basis of remote sensing technologies at different spatial scales for global or continental forest resources. Here, a brief review of the most important and recent efforts in forest mapping at the European and global level is reported.
Copernicus, the European programme for Earth observation (⇒ https://www.copernicus.eu/), developed several layers potentially useful for forest monitoring, in particular the European Forest High Resolution Layers (HRL), and more specifically: (i) the tree cover density (TCD) expressed in percent of tree cover; (ii) the dominant leaf type (DLT) based on the dominance of broadleaved or coniferous species; and (iii) the forest type products (FTY), a forest mask which closely mimics the FAO forest definition. These layers were developed primarily with Sentinel-2 time series for the year 2018, and complemented for the years 2012 and 2015 by Landsat 8, SPOT-5 and ResourceSat-2 satellite data ([29]), and are currently available with resolutions ranging between 10 and 100 m. Also the Copernicus Global Land Service has recently released the 2015 global land cover map at 100 m resolution ([6]), updating the harmonized global land cover classification for the year 2000 based on SPOT4 images, originally produced by the Global Vegetation Monitoring unit of the Join Research Centre of the European Commission.
The Japan Aerospace Exploration Agency (JAXA) produced a global forest/non forest map for the reference years 2007 and 2009 based on the classification of ALOS and ALOS-2 satellite radar images, with a resolution of 10 m and a declared accuracy of 84% compared to the ground base data set ([27]).
The World Resources Institute, within the framework of Global Forest Watch, developed an online forest monitoring data set based on the analysis of Landsat multitemporal series, producing the global map of tree cover density for the reference year 2010 and a forest gain/loss map for the period 2001-2019 ([20]).
The above maps are considered useful to monitor forest resources at global or continental scales ([20]), however they can be affected by large errors at national or regional level ([18]). For this reason none of the existing forest maps implemented at continental or global level are considered reliable for operational purposes at national level. As a consequence, forest maps have been developed independently by several countries, such as Sweden ([41]), Norway ([39]), Finland ([31]), Switzerland ([51]), Spain ([1]), United Kingdom ([45]), USA ([33]), France ([16]). These maps are considered essential to infer forest statistics in NFIs ([12]), to assess forest variables at national scale and support forest owners in planning silvicultural interventions at local scale ([28]), to quantify forest ecosystems services ([49]) or support precision forestry ([11]). Usually, forest resource maps developed in the context of NFIs have been produced at a scale congruent with the size of the sampling units used to acquire the information in the field, in order to reduce the costs of management activities for forest owners ([28]).
In order to support forest management or planning, the spatial data produced by modern NFIs are routinely implemented in geographic Forest Information Systems (FIS) which allow forest managers, forest owners and government authorities to query forest data through on-line web-based systems. Examples are available for Norway (⇒ https://kilden.nibio.no/), Sweden (⇒ https://kartor.skogsstyrelsen.se/kartor/?startapp=skogligagrunddata), Finland (⇒ https://kartta.paikkatietoikkuna.fi/?lang=en), Spain (⇒ http://lidarrioja.agrestaweb.org/#!/map) or France (⇒ https://www.geoportail.gouv.fr/carte).
According to White et al. ([52]), the Italian NFI program cannot be considered an Enhanced Forest Inventory, as it does not provide wall-to-wall maps but only estimates of forest variables aggregated over large geographic regions. As a result, a forest mapping process over Italy is still missing within the NFI program, although multiple mapping projects have been carried out at local scale. Nonetheless, in 2018 the Italian Parliament enacted a new Forest law clearly recognizing the need of a national high resolution forest map as a key tool to set up a country-level forest strategy. This calls for the recognition of existing forest maps and an evaluation of their consistency in terms of forest definitions and nomenclature systems.
Wall-to-wall maps from remotely sensed (RS) data can be used for the estimation of forest variables, also over small areas ([10]), e.g., growing stock volume ([43]), biomass ([40]), forest structural variables and diversity indices ([37]). Among the different types of available RS technologies, Airborne Laser Scanner (ALS) emerged as the most effective to derive such maps and to support the development and parameterization of models for a broad range of information needed to enhance NFIs ([31], [52]). Indeed, ALS data allow to capture highly-detailed structural properties of forests ([23], [21]). The advantages of ALS in mapping forest variables are well documented in the context of NFIs ([39], [34]), local forest inventories ([37], [5]), biodiversity monitoring ([53], [47]), and characterization of wildlife habitats ([50]). In operational wall-to-wall forest inventories, a two-stage procedure using ALS data and field plots by the so-called Area-Based Approach (ABA - [38]) is commonly applied, and several countries (e.g., Norway, Sweden, and Finland) already used this technology for implementing their NFIs ([30], [39], [41]).
In Italy the first studies aimed to estimate forest variables based on ALS data date back to early 2000 ([3]). An excursus on the first decade of ALS applications in Italy is reported in Montaghi et al. ([36]). More recently, Mura et al. ([37]) developed a methodological approach to map a multiple variation index of forest structural diversity with a statistically rigorous inference approach. Chirici et al. ([8]) compared four model-assisted estimates of total forest aboveground biomass obtained using ALS echo-based and CHM metrics. Chirici et al. ([9]) quantified forest windthrow damages in Tuscany after the storm of March 2015 using post-event ALS data, while Giannetti et al. ([17]) assessed single-tree attributes in a complex mixed Mediterranean forests by combining ALS and terrestrial laser scanner (TLS) data.
Despite a fairly rapid growth of these techniques, wall-to-wall ALS data are currently unavailable for Italy ([36], [44]), though several local data sets have been acquired recently. Further, an overview of all the ALS data sets available in Italy is still missing, albeit this information is crucial to integrate ALS data with other source of information, such as that from field surveys conducted by the Italian NFI, or to plan future ALS acquisitions ([11]).
The general objective of this work is to assess the consistency of forest maps and ALS data currently available in Italy, as a preliminary activity to a future implementation of a National Forest Information System. More specifically this paper is aimed to: (i) investigate if existing local forest maps can be combined to achieve a national high resolution forest/non-forest map (forest mask), as well as to compare the forest area estimates derived from this map with those obtained from the Italian NFI; for comparative purposes we assessed the quality of other two forest masks developed in the framework of international projects; (ii) develop an innovative canopy height model (CHM) through the aggregation of all the major ALS data sets currently available in Italy; (iii) implement an on-line geographic FIS for demonstration purposes, which provides free access to the above two layers. We first give an overview of the available forest maps (local, continental and global) and ALS data sets available for Italy, then we describe the methodology used for preparing the forest mask and the CHM, and finally we introduce the on-line geographic FIS.
Materials
Study area
Italy covers 301,338 km2, centered at latitude 42° 30′ and longitude 12° 30′, and it is divided into 21 local administrations, i.e., Regions and Autonomous Provinces (the Nomenclature of Territorial Units for Statistics [NUTS] level 2, following the European Statistical Office [Eurostat] classification). The country has large climate and geomorphological variability with coastal flat areas, hills and two main mountain chains, the Apennines from North-West to South-East, and the Alps in the northern part of the country from West to East, with elevations ranging between 0 and 4800 m a.s.l. Based on the last Italian NFI statistics ([24]), forests and other wooded lands cover 104,675 km2 (34.7% of the land area). Forests are dominated by broadleaved species (68% of total forest area), with the presence of 7 out the 14 European Forest Types ([2]).
Forest mask of Italy
Forest mask from local maps
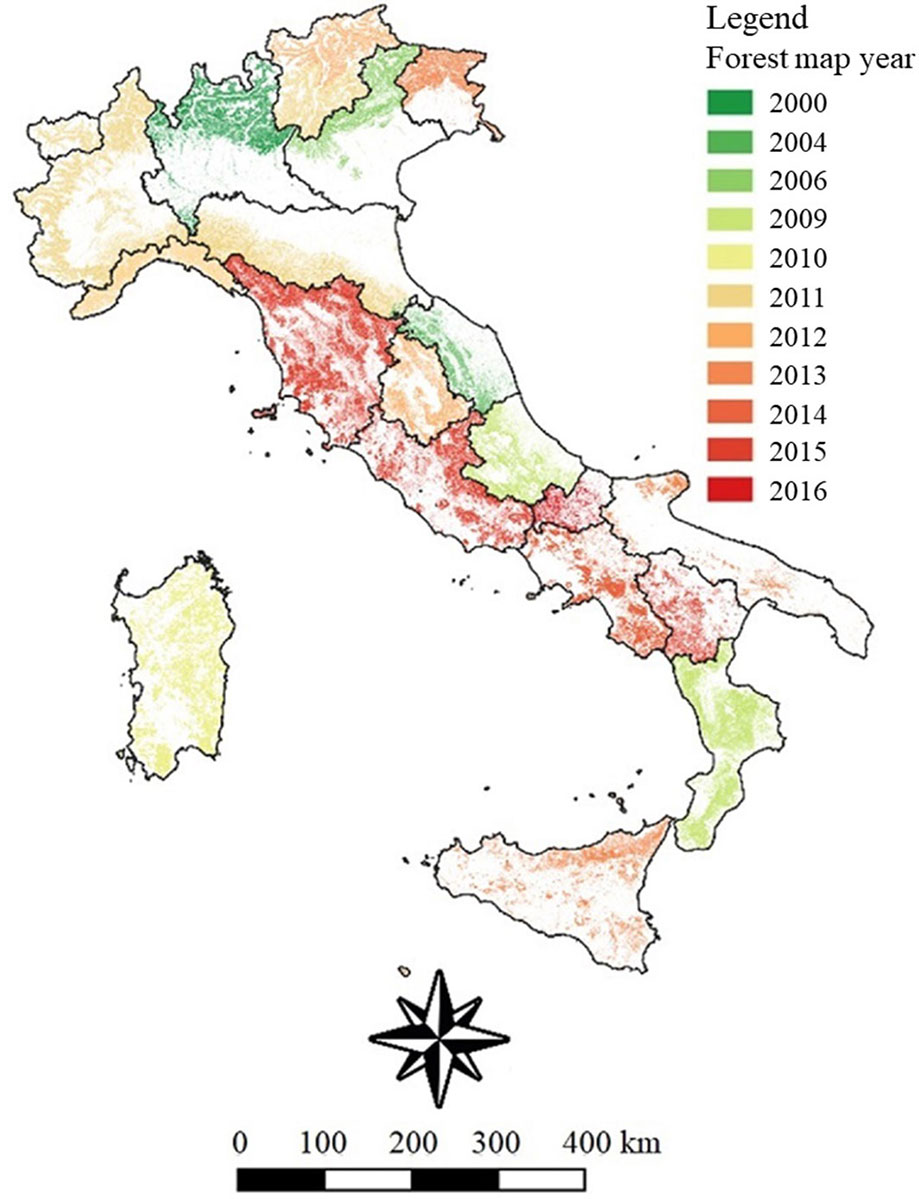
The high resolution forest mask of Italy was created by mosaicking maps of different types. Sixteen high resolution forest maps based on forest types classification systems with a nominal scale varying between 1:5.000 and 1:25.000 were used when available. For five regions we used land use maps based on the Corine Land Cover classification system, and one map (i.e., Sardinia) based on the classification systems of the CORINE Biotopes. All the above maps were produced on the basis of manual photointerpretation of aerial orthophotos between 2000 and 2016.
The maps were downloaded from local on-line geoportals; when multiple versioning for different years were available, we used the version closest to the year 2005, which is the reference year of the Italian NFI (Fig. 1). The details of the local maps used to create the high resolution forest masks are reported in Tab. 1.
Fig. 1 - Acquisition year of local maps used to create the high resolution forest mask.
Tab. 1 - Main characteristics of local maps used to create the high resolution forest mask.
| Administrative unit |
Map type | Production year |
Scale | Minimum Mapping Unit (ha) |
|---|---|---|---|---|
| Abruzzo | Forest map | 2009 | 1:10000 | 0.5 |
| Basilicata | Forest map | 2015 | 1:10000 | 0.2 |
| Auton. Prov. of Bolzano | Forest map | 2011 | 1:25000 | 0.5 |
| Calabria | Land use map | 2012 | 1:10000 | 0.2 |
| Campania | Land use map | 2009 | 1:25000 | 0.5 |
| Emilia-Romagna | Land use map | 2014 | 1:10000 | 0.2 |
| Friuli Venezia Giulia | Forest map | 2013 | 1:5000 | 0.2 |
| Lazio | Forest map | 2011 | 1:25000 | 0.5 |
| Liguria | Forest map | 2013 | 1:25000 | 0.5 |
| Lombardia | Forest map | 2015 | 1:10000 | 0.25 |
| Marche | Forest map | 2000 | 1:25000 | 0.5 |
| Molise | Forest map | 2004 | 1:10000 | 0.5 |
| Piemonte | Forest map | 2016 | 1:10000 | 0.2 |
| Puglia | Forest map | 2011 | 1:10000 | 0.25 |
| Sardinia | Land use map | 2013 | 1:200000 | 0.5 |
| Sicilia | Forest map | 2010 | 1:10000 | 0.5 |
| Toscana | Land use map | 2013 | 1:25000 | 0.2 |
| Auton. Prov. of Trento | Forest map | 2015 | 1:10000 | 0.2 |
| Umbria | Forest map | 2012 | 1:25000 | 0.5 |
| Valle d’Aosta | Forest map | 2011 | 1:10000 | 0.5 |
| Veneto | Forest map | 2006 | 1:10000 | 0.5 |
Forest masks from international layers
Although a large number of global or continental forest maps are available, we decided to use only two products provided by JAXA (globally) and COPERNICUS (for Europe), since they officially state to mimic the FAO definition of “forest and other wooded land”, which is also adopted by the Italian NFI.
JAXA, for the years 2007, 2008, 2009, 2010, and 2015 provides a forest/non-forest mask in grid format with a 25 m resolution for the entire globe ([27]). The JAXA map is produced by automatic processing of multipolarization backscatter signals acquired by the two Synthetic Aperture Radars (SAR), PALSAR and PALSAR 2 (Phased Array type L-band Synthetic Aperture Radar), which are mounted on the two satellites ALOS and ALOS-2 (Advanced Land Observing Satellite). The JAXA map (hereafter named JAXA) was downloaded for the year 2007 from the web repository Earth Engine Data Catalog® (⇒ https://developers.google.com/earth-engine/datasets/catalog/jaxa_alos_palsar_yearly_sar).
In the framework of Copernicus Land Monitoring Service (CLMS) coordinated by the European Space Agency (ESA) a forest/non-forest mask in grid format covering the entire Europe for the years 2012 and 2015 is derived from the FTY, available among the so-called HRL, in which the mainly input sources of the forest layers are Sentinel-2 and Landsat 8 time series, complemented by SPOT-5 and ResourceSat-2 satellite data. The FTY map for the year 2012 derived through a spatial intersection of the two primary status layers TCD and DLT ([29]), was downloaded from ⇒ https://land.copernicus.eu/pan-european/high-resolution-layers/forests/forest-type-1/status-maps/2012?tab=download. As reported in the metadata, the FTY allows to mimic as close as possible the FAO forest and other wooded land definition. It has an original spatial resolution of 20 m and consists of two products: (i) a forest types product with a MMU of 0.5 ha, as well as a 10% tree cover density threshold applied; (ii) a support layer mapping trees under agricultural uses and in urban contexts on the basis of the land uses from the Corine Land Cover (CLC) 2012 project, and the 2012 degree of imperviousness product (available among the HRL). In the final 20 m spatial resolution product that we used, trees predominantly used for agricultural practices and trees in urban context that are distinguished in the forest additional support layer are excluded from the map ([29]). We referred to this final map as HRL-FM.
Airborne Laser Scanner surveys
We searched for all the ALS data sets collected from local, regional, and national authorities currently available in Italy. In total, we found 29 ALS datasets acquired in the period 2004-2017 by 12 local and national different authorities (Tab. 2, Fig. 2). The data are available free of charge, or in some cases can be acquired upon request to the owner or after payment of storage fees. The largest dataset was collected by the Italian Ministry of Environment (MATTM), which acquired ALS data at national level along the Italian coast and rivers for hydraulic risk assessment.
Tab. 2 - Main characteristics of ALS surveys available in Italy. In the spatial resolution column, “raw data” refers to the availability of point clouds with or without ground/non-ground classification.
| ID | Data provider | Survey year | Survey area | Coverage (km2) |
Flight altitude (m) | Density (pulse m-2) | Spatial resolution (m) |
Sensor |
|---|---|---|---|---|---|---|---|---|
| 1 | Basilicata | 2013 | Basilicata | 11,072 | 900 | 4 | 5×5 | Riegl LMS Q680i |
| 2 | Autonomous Province of Bolzano | 2004- 2006 |
South Tyrol | 9,682 | 850-1100 | 0.6 | 2.5×2.5 | TopoSys Falcon II and Optech Gemini ALTM 3033 |
| 3 | Bosco Fontana | 2006 | Bosco Fontana | 4 | - | 5.6 | 1×1 + raw data | Optech ALTM 3100 |
| 4 | Municipality of Firenze | 2017 | Florence | 102 | 915 | 4 | 1×1 | Riegl LMS-Q680i |
| 5 | Autonomous Region of Fruli Venezia-Giulia | 2006- 2010 |
Fruli Venezia-Giulia | 8,500 | 180-3000 | 4 | 1×1 + classified raw data | Optech Gemini ALTM 3033 |
| 6 | LaMMA | 2015 | Tuscany forest windthrows 4-5/03/15 | 513 | 1100 | 4.4 | 1×1 + classified raw data | Riegl LMS-Q680i |
| 7 | MATTM Contracts: 140, 145, 155, 172, 204, 208 | 2007- 2016 |
National Rivers | 167,962 | - | - | 1×1 + raw data | ALTM Gemini, ALTM 3100, Pegasus |
| 8 | MATTM Contracts: 140, 176 | 2008- 2012 |
Coast line | 5,917 | - | - | 2×2 + raw data | ALTM Gemini, ALTM 3100, Pegasus |
| 9 | Piemonte | 2009- 2011 |
Piemonte | 25,694 | 4500 | 0.5 | 5×5 + raw data | LEICA ALS50-II (Leica Geosystems 2006) |
| 10 | Autonomous Region of Sardinia | 2008 | Alghero | 67 | 800 | 1 | 5×5 | Riegl LMS-Q560 |
| 11 | Autonomous Region of Sardinia | 2008 | Coast | 4,512 | 1400 | 1 | 1×1 | Optech Gemini ALTM |
| 12 | Autonomous Region of Sardinia | 2009 | Ogliastra | 512 | 800 | 5 | 1×1 + raw data | Riegl LMS-Q560 |
| 13 | Autonomous Region of Sardinia | 2013 | Urban centers | 1,522 | 700 | 4 | 1×1 | Riegl LMS Q680i |
| 14 | Toscana, Province of Arezzo | 2004 | Arno, Tevere | 89 | 1200 | 0.5-1.5 | 2×2 | Optech Gemini ALTM 3033 |
| 15 | Toscana Serchio basin authority | 2005 | Canale Ozzeri, Rio Guappero | 31 | 1200 | 1 | 1×1 | Optech Gemini ALTM 3032 |
| 16 | Toscana Serchio basin authority | 2006 | Serchio and main tributaries | 12,435 | 1200 | 1 | 1×1 | Optech Gemini ALTM 3033 |
| 17 | Toscana | 2006- 2007 |
Mugello, Sieve | 305 | 1200 | 1 | 1×1 | Optech Gemini ALTM 3033 |
| 18 | Toscana, Province of Siena | 2007 | Ombrone, Arbia | 35 | 1500 | 1 | 1×1 | Optech Gemini |
| 19 | Toscana, Arno basin authority | 2008 | Elsa, Ombrone, Bisenzio, Sieve | 913 | 1200 | 1.50 | 1×1 | ALTM Gemini |
| 20 | Toscana, Arno basin authority | 2008 | Monti della Calvana | 314 | 2300 | 0.40 | 3×3 | ALTM Gemini |
| 21 | Toscana, Arno basin authority | 2009 | Monti della Calvana | 314 | 2300 | 0.40 | 2×2 | ALTM Gemini |
| 22 | Toscana | 2010 | Lunigiana, Pistoia, Lucca, Scarlino | 1,923 | - | 0.50 | 1×1 | Optech Gemini ALTM and Optech Pegasus ALTM |
| 23 | Toscana | 2011 | Aulla | 85 | 1800-1900 | 0.5 | 1×1 | Optech Gemini |
| 24 | Toscana | 2012 | Carrara, Pienza, Minucciano, Vagli | 101 | 1600 | 1.7 | 1×1 | Optech Gemini ALTM and Optech Pegasus ALTM |
| 25 | Toscana | 2012 | Magra | 54 | 1400 | 1.5 | 1×1 | Optech Pegasus |
| 26 | Toscana | 2012 | Teglia, Osca, Mangiola | 26 | 1050 | 1.5 | 1×1 | Optech Gemini |
| 27 | Autonomous Province of Trento |
2006 | Trentino excluded Adige river |
6,516 | 1000-1800 | 1.8 | 1×1 + raw data | Optech ALTM 3100 |
| 28 | Autonomous Province of Trento |
2009 | Adige river | 550 | 1500 | 0.5 | 1×1 + raw data | TopoSys |
| 29 | Autonomous Region of Valle d’Aosta |
2008 | Valle d’Aosta | 3,264 | 2700-4700 | 2 | 2×2 + raw data | Optech Gemini ALTM |
Fig. 2 - ALS data sets available in Italy by data provider (left panel) and year of acquisition (right panel).
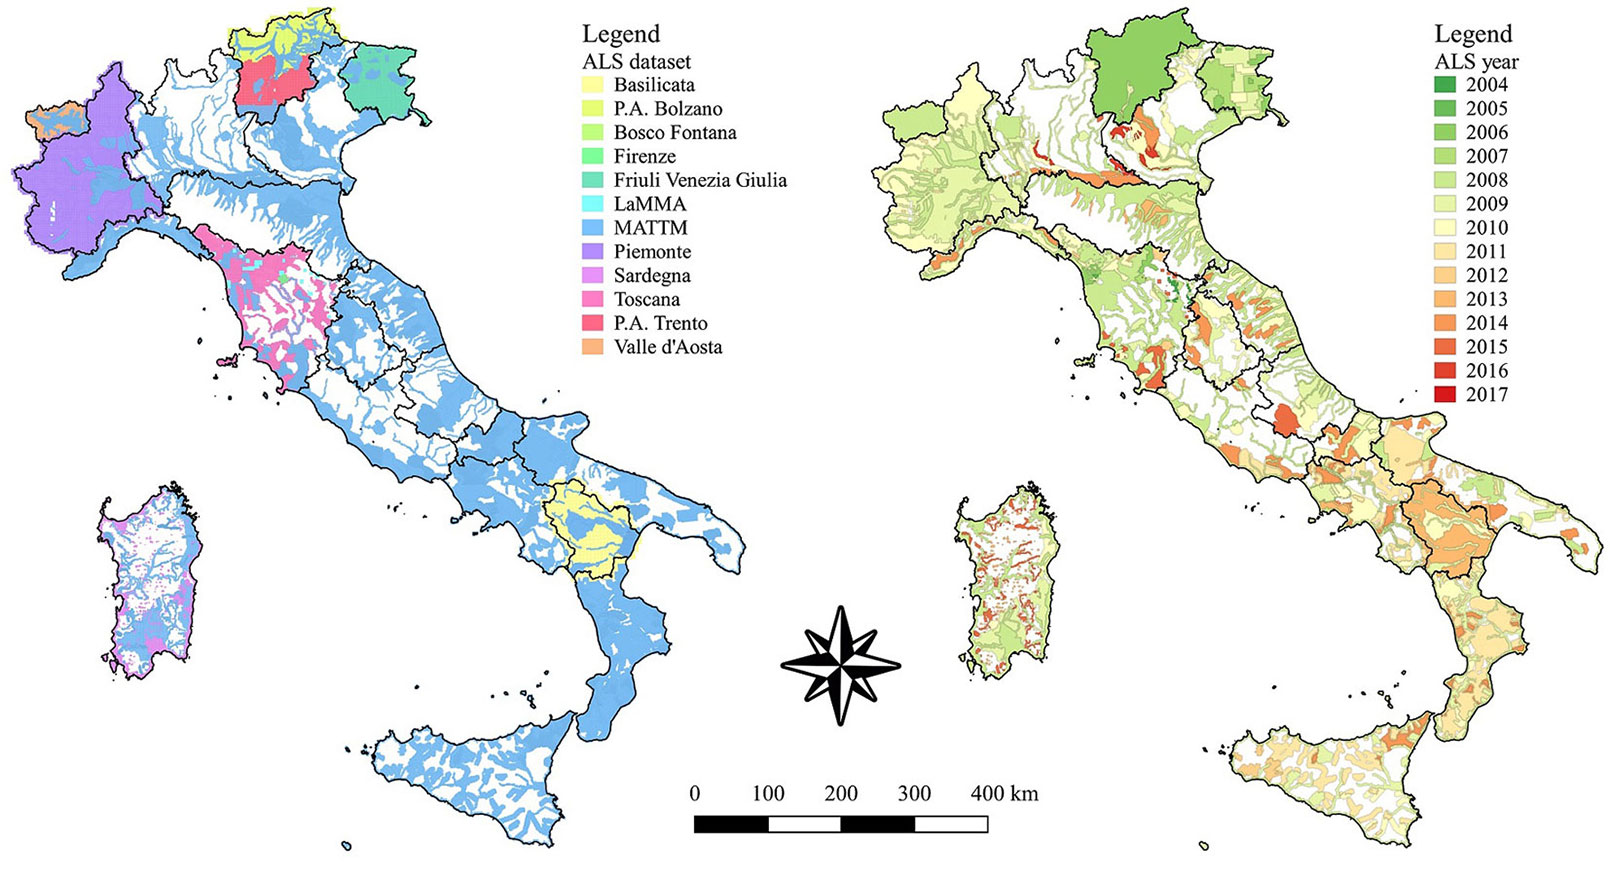
The remaining datasets were acquired by Regions and other local authorities (i.e., municipalities, provinces, catchment management authorities, and research institutions). In some areas multitemporal acquisitions were also available, mainly located in Regions with wide local ALS coverage where multiple MATTM surveys were carried out. The Regions with multitemporal data sets are Liguria (covering 49% of the Region), Valle d’Aosta (40%), Molise (36%), Piemonte (33%), Trentino Alto-Adige (32%), Basilicata (26% - Fig. 2). In several Regions new ALS dataset are either under acquisition or have been already acquired but still not distributed.
Tab. 2 reports the main characteristics of ALS data sets used in this study. It is worth noting that in some cases point clouds were collected as raw or classified data, while for some data sets we collected only pre-processed data such as raster grid Digital Terrain Models (DTMs), which provide the elevation of the ground terrain, and Digital Surface Models (DSM), which provide the elevation of the earth surface including trees, buildings, and other features above the ground.
Italian National Forest Inventory reference data
The 2nd Italian National Forest Inventory ([24]) is based on a three-phase, non-aligned, systematic sampling design, with results referred to the year 2005. More details on the Italian NFI are reported in Fattorini et al. ([14]) and Chirici et al. ([10]).
To assess the accuracy of the forest masks we used the official estimates of total forest area (i.e., forest + other wooded land) aggregated at national (NUTS1), regional (NUTS2), and province levels (NUTS3 - [24]). Such estimates are freely available on line at ⇒ https://www.sian/⇒ https://www.sian.it/inventarioforestale/.
Italian national grids
Resampling all the different layers (forest masks and ALS data sets) to produce a harmonized spatial datasets with a common spatial extension and resolution is a standard procedure when maps have to be compared with the information collected in the NFIs ([28]).
For this study we generated two reference grids for Italy, both projected using the coordinate system WGS 84 / UTM zone 32 North (EPSG:32632), at two different resolutions: 1 m and 23 m. The tessellation at 23 m was chosen to mimic the size of the field plots measured in the Italian NFI ([10]), and this generated a total of 569,769,690 cells. Following this approach all the raster layers potentially included in the geographical FIS should be resampled to the same 23 m resolution.
The 23 m resolution cells were then subdivided to achieve the 1 m grid, consisting of 301,408,166,010 cells, which were used for the subsequent harmonization process of local forest maps.
Methods
Forest mask
Harmonization of local forest maps
The local forest maps were all re-projected using the same coordinate system (WGS 84 / UTM zone 32 North, EPSG: 32632), merged and rasterized as grid layers using the national grid with 1 × 1 m spatial resolution, and reclassified into Boolean masks using “1” for pixels classified as “forest”, and the “0” for pixels classified as “non-forest”. The term “forest” is hereinafter intended as “forest and other wooded areas”, according to the FAO definition.
Since the different local maps were developed at different resolutions, a simple procedure was applied to harmonize all the maps to the FAO forest definition based on the minimum tree cover of 5%.
The forest cover ratio (Fi) was then calculated for each 23 × 23 m cell as follows (eqn. 1):
where yi is the number of forest pixels resulting from the 1 × 1 m forest mask, and n = 529, i.e., the total number of 1 × 1 m pixels within the 23 × 23 m pixels.
All the 23 × 23 m cells with Fi ≥ 5% were classified as “forests”, while the remaining cells were classified as “non-forest”. After the merging process we obtained a national layer hereinafter identified as REG-FM (REGional Forest Mask).
For comparison purposes, the JAXA and HRL maps were resampled from their original resolution (25 and 20 meters, respectively) to the 23 m national grid and Boolean maps of forest cover were created following the methodology described above.
The results are the three national raster forest masks REG-FM, JAXA-FM, and HRL-FM with the spatial resolution of the national grid at 23 × 23 m.
Accuracy assessment of the forest masks
To assess the accuracy of the three forest masks (REG-FM, JAXA-FM, and HRL-FM) we used as benchmark the forest area reported by the official statistics of the 2nd Italian NFI ([24]). For each national forest mask, we computed the forest area for all Italy (NUTS1), for 20 Regions (administrative units at NUTS2 level, considering the Autonomous Provinces of Trento and Bolzano as a unique Region) and 103 Provinces (administrative units at NUTS3 level).
For each administrative unit we computed the percentage difference (diff%) between the official NFI forest area estimate, and the forest area derived from the different forest masks as follows (eqn. 2):
where Amask is the forest area calculated based on the forest masks (REG-FM, JAXA-FM, HRL-FM), and ANFI is the forest area provided by official NFI statistics.
We also calculated the coefficient of determination (R2), and the root mean square error, both as absolute (RMSE) and relative values (RMSE%) against the ANFI, between NFI statistics and the forest area from the different forest masks as follows (eqn. 3, eqn. 4):
where Amask_i is the forest area calculated on the basis of the forest masks in the i-th administrative unit, ANFI_i is the forest area provided by official NFI statistics for the i-th administrative unit, n is the number of administrative units. Finally, the forest area estimates from the NFI for the same administrative units were calculated, along with their estimated standard error.
Italian National CHM
The available ALS datasets were derived from several flight campaigns and were provided with different specifications and formats. Therefore, the generation of a homogeneous CHM required specific pre-processing steps depending of data characteristics.
For those ALS datasets where raw data were available (IDs 3, 5, 9, 12, 27, 28 - Tab. 2) we firstly classified the ALS point clouds and then we produced DTMs and DSMs. Using the software LasTools® ([25]) errors in returns were eliminated with the “lasnoise” algorithm, and the pulses corresponding to ground and non-ground were classified with “lasground” and “lasclassify” procedures. The 1-m resolution DTM from ground pulses and the DSM from non-ground pulses were generated with the adaptive TIN model algorithm using the procedure “las2dem” in LasTools®.
For those datasets where point clouds were not available (IDs 1, 2, 8, 10, 14, 20, 21, 29 - Tab. 2), and DTM and DSM were at a resolution different from 1 m, the datasets were resampled using a cubic convolution.
The remaining dataset (IDs 4, 6, 7, 11, 13, 15, 16, 17, 18, 19, 22, 23, 24, 25, 26 - Tab. 2) had already a 1-m resolution, thus were not resampled.
The 1-m resolution CHM was computed by subtracting the DTM from the DSM in the coordinate reference system WGS 84 / UTM zone 32 North (EPSG:32632). Lastly, for each 23 × 23 m cell of the national grid the mean value from the 1-m resolution CHM was calculated.
Results
Forest mask (REG-FM)
Based on the forest mask obtained from the aggregation of local forest maps (REG-FM), the total area of forest and other wood lands resulted of 102,610.9 km2 (34% of land area of Italy), which is 1.9% less than the estimated official statistics reported in the NFI (104,675.33 km2, with an estimated standard error of 0.3%). Both the other two forest masks (JAXA-FM and HRL-FM) were less consistent with NFI estimates. Using JAXA-FM the forest area estimate obtained was 100,177.8 km2 (33.2% of land area), with an underestimation of almost 4% compared to NFI data; using HRL-FM we obtained a total forest area of 112,133.1 km2 (37.2% of land area), with an overestimation of approximately 16% when compared to NFI estimates (Tab. 3).
Tab. 3 - Accuracy assessment of different national forest masks (REG-FM, JAXA-FM, HRL-FM) at NUTS1 (country) and NUTS2 (regions) levels. The forest and other wooded land area and the percentage difference (Diff%) are reported for each forest masks. The forest area and its standard error (ES%) from NFI are also reported.
| NUTS | Area | Forest and other wooded land area (km2) | Diff%(%) | NFI forest area (km2) and ES% |
||||
|---|---|---|---|---|---|---|---|---|
| REG | JAXA | HRL | REG | JAXA | HRL | |||
| NUTS1 | Italy | 102610.9 | 100177.8 | 112133.1 | -2 | -4 | 7 | 104675.30 (0.3) |
| NUTS2 (Regions) |
Abruzzo | 4556.03 | 3913.81 | 5118.1 | 4 | -11 | 17 | 4385.90 (1.3) |
| Basilicata | 3239.48 | 2402.19 | 3216.77 | -9 | -33 | -10 | 3564.27 (1.5) | |
| Calabria | 7841.35 | 6211.36 | 6715.52 | 28 | 1 | 10 | 6129.31 (1.1) | |
| Campania | 4460.5 | 4644.41 | 5942.53 | 0 | 4 | 33 | 4452.75 (1.5) | |
| Emilia-Romagna | 6202.72 | 6026.12 | 6915.4 | 2 | -1 | 14 | 6088.17 (1.2) | |
| Friuli Venezia Giulia | 3244.71 | 3473.43 | 3531.78 | -9 | -3 | -1 | 3572.24 (1.3) | |
| Lazio | 6200.5 | 6624.49 | 6849.31 | 2 | 9 | 13 | 6058.59 (1.2) | |
| Liguria | 3925.8 | 4692.92 | 3963.49 | 5 | 25 | 6 | 3751.34 (1.1) | |
| Lombardia | 6203.02 | 8487.41 | 7029.52 | -7 | 27 | 6 | 6657.01 (1.2) | |
| Marche | 2618.61 | 2452.51 | 3304.99 | -15 | -20 | 7 | 3080.76 (1.6) | |
| Molise | 1583.44 | 1038.26 | 1847.08 | 7 | -30 | 24 | 1486.40 (2.3) | |
| Piemonte | 9326.76 | 11266.29 | 10165.41 | -1 | 20 | 8 | 9401.15 (1.0) | |
| Puglia | 1735.28 | 1749.27 | 4390.04 | -3 | -2 | 145 | 1790.40 (2.6) | |
| Sardinia | 8943.82 | 5636.15 | 9115.8 | -26 | -54 | -25 | 12132.51 (0.8) | |
| Sicilia | 5134.48 | 2082.68 | 3941.15 | 52 | -38 | 17 | 3381.71 (1.9) | |
| Toscana | 11687.77 | 11645.15 | 12626.22 | 1 | 1 | 10 | 11515.38 (0.7) | |
| Trentino-Alto Adige | 7503.17 | 7958.62 | 7311.26 | -4 | 2 | -6 | 7797.05 (1.2) | |
| Umbria | 3411.15 | 3400.31 | 4160.79 | -13 | -13 | 7 | 3902.55 (1.2) | |
| Valle d’Aosta | 981.06 | 1435.56 | 966.31 | -7 | 36 | -9 | 1059.28 (2.7) | |
| Veneto | 4131.19 | 5036.88 | 5021.65 | -8 | 13 | 12 | 4468.56 (1.4) | |
The REG-FM forest mask resulted the most accurate also at Regional (NUTS2) and Province (NUTS3) level. For NUTS2 we found that REG-FM matches the NFI estimates better than other masks in 11 out of 20 Regions, versus 6/20 regions of HRL-FM, and 3/20 of JAXA-FM (Tab. 3). Using REG-FM the largest understimations of forest area were detected for Marche (-15%) and Sardinia (-26%), while the largest overestimations was in Sicily (+52%) and Calabria (+28%). As for the NUTS3 level, the REG-FM yielded the best estimates in 50 Provinces out of 103, versus 28/103 with HRL-FM and 25/103 with JAXA-FM. The REG-FM at Province level showed a performance to that registered at Regional level, with strong overestimations in Puglia, Sicily, and Calabria, and underestimations in Lombardy, Veneto, Basilicata, and Sardinia.
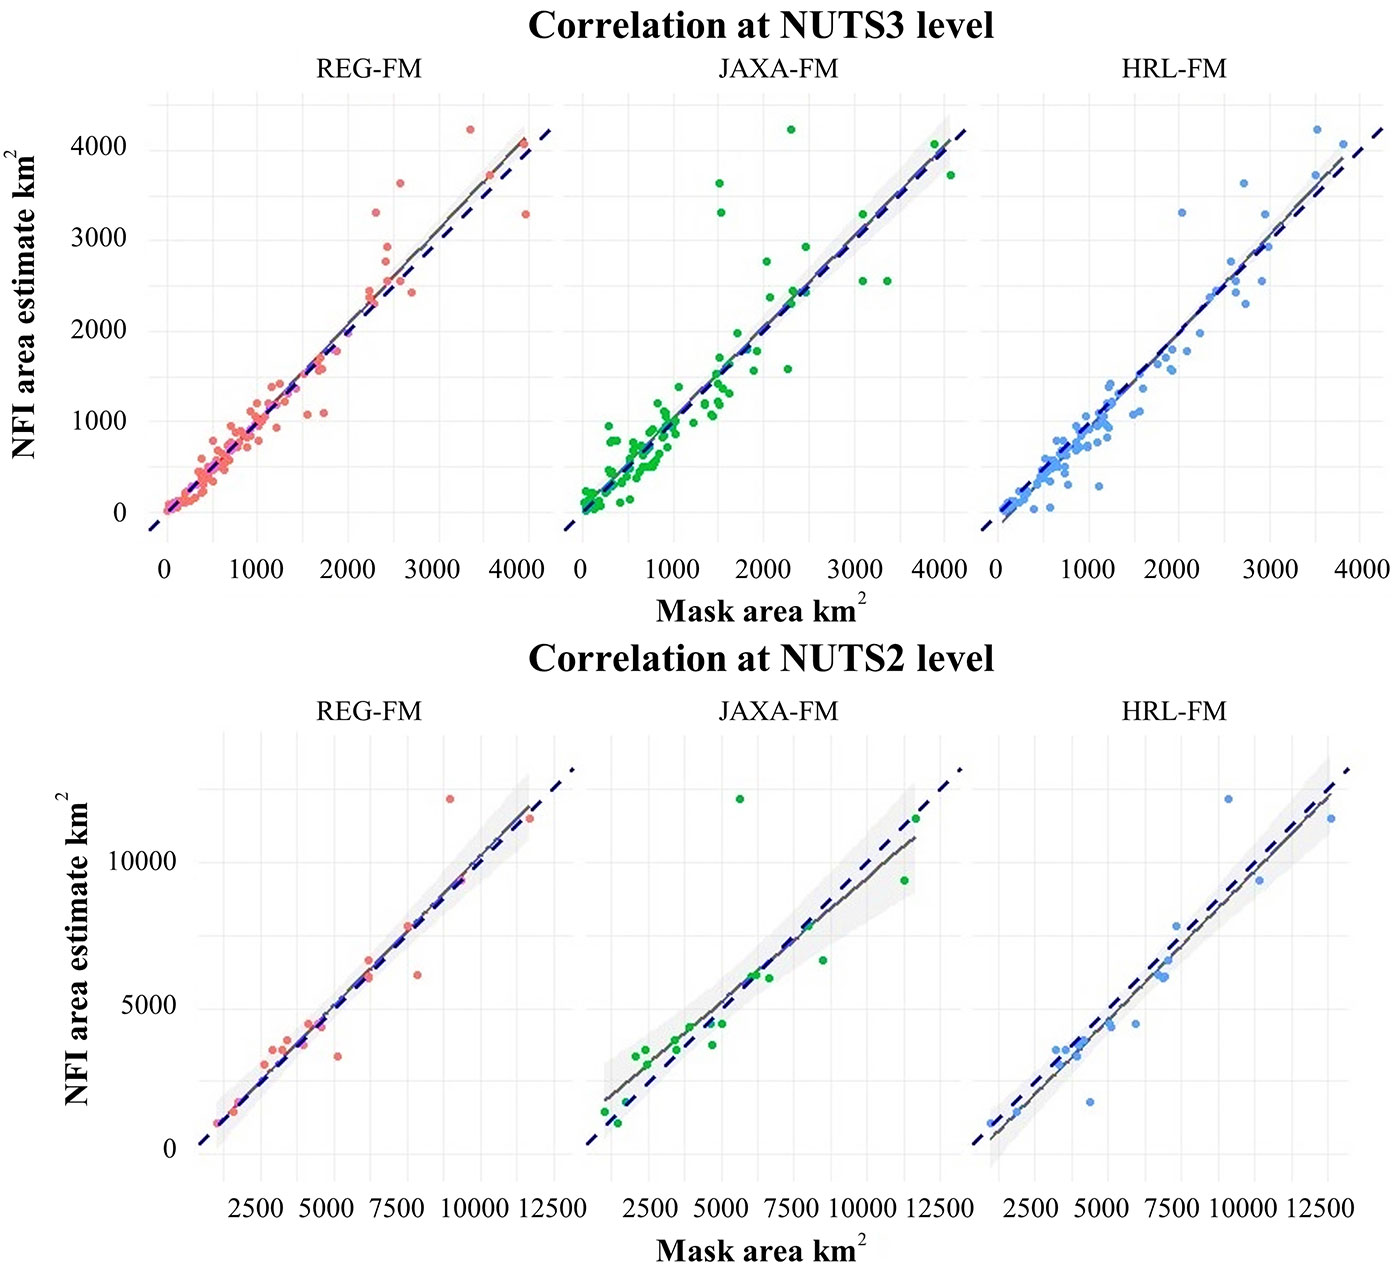
The R2 and RMSE statistics confirmed these results. For Regions (NUTS2) and Provinces (NUTS3) the REG-FM appeared the best performing forest masks, with R2 = 0.91 and RMSE = 19% and R2 = 0.95 and RMSE = 23% for NUTS2 and NUTS3, respectively. HRL-FM and JAXA-FM ranged between 0.80 and 0.90 in terms of R2, and between 21% and 40% in terms of RMSE (Tab. 4, Fig. 3).
Tab. 4 - RMSE, RMSE%, and R2 for the three forest masks (REG-FM, JAXA-FM, HRL-FM) at NUTS3 (Province) and NUTS2 (Region) levels.
| Mask | RMSE (ha) | RMSE% | R2 | |||
|---|---|---|---|---|---|---|
| Province | Region | Province | Region | Province | Region | |
| HRL | 24.943 | 112.940 | 24 | 21 | 0.93 | 0.90 |
| JAXA | 41.340 | 154.774 | 40 | 29 | 0.82 | 0.80 |
| REG | 23.254 | 103.133 | 23 | 19 | 0.95 | 0.91 |
Fig. 3 - Correlation between the forest area estimates derived from the different forest masks (REG-FM, JAXA-FM, HRL-FM) and the NFI estimates at NUTS2 (Region) and NUTS3 (Province) level. The dotted blue line is the y = x line.
Italian National CHM
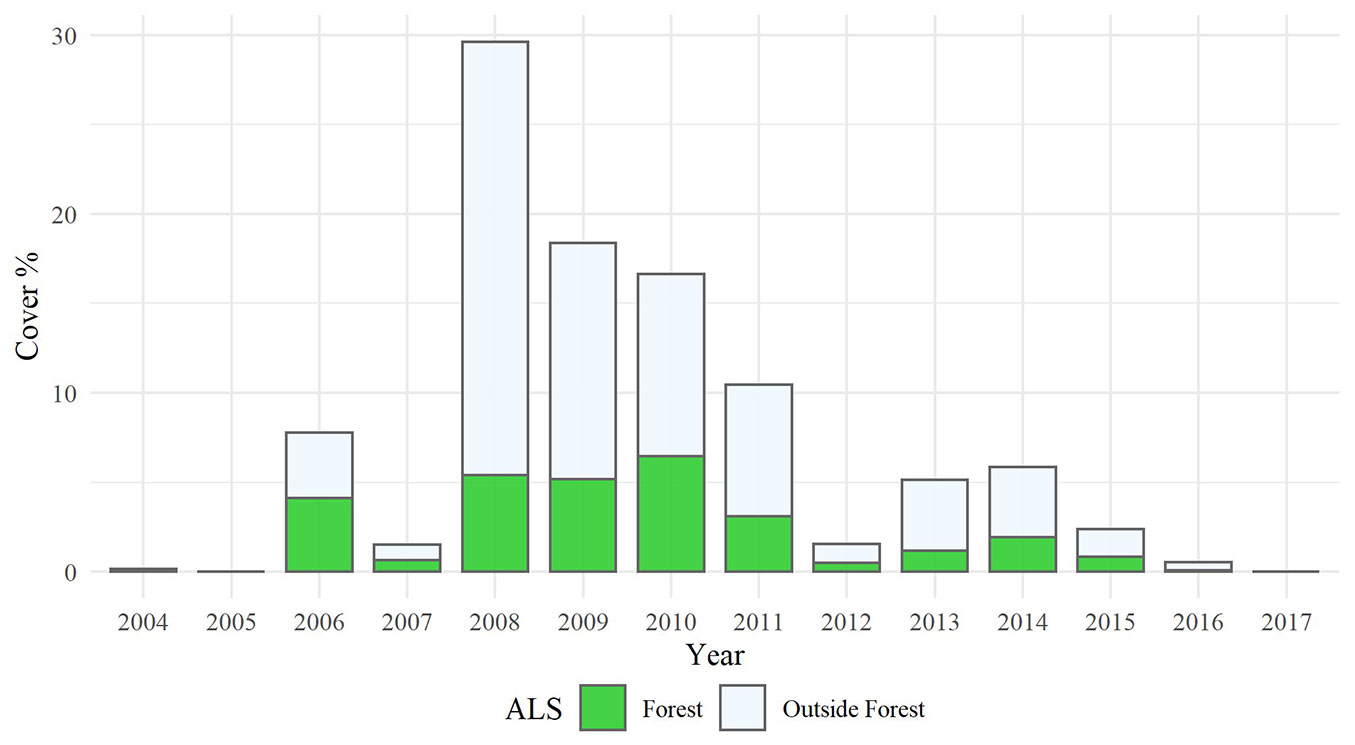
As a result of mosaicking the ALS data sets, we produced a 23-m resolution CHM over an area of 191,076.52 km2, which covers 63% of the Italian territory, and includes 59% of the Italian forest area (based on the REG-FM - Fig. 4). Most of ALS data were acquired between the years 2008 and 2011 (68% of the total area covered by ALS data - Fig. 5).
Fig. 4 - (left panel): The CHM generated in this study; (middle panel): the forest area covered by the CHM (59% of the whole forest area); (right panel): the high-resolution nationwide forest mask developed in this study (REG-FM).
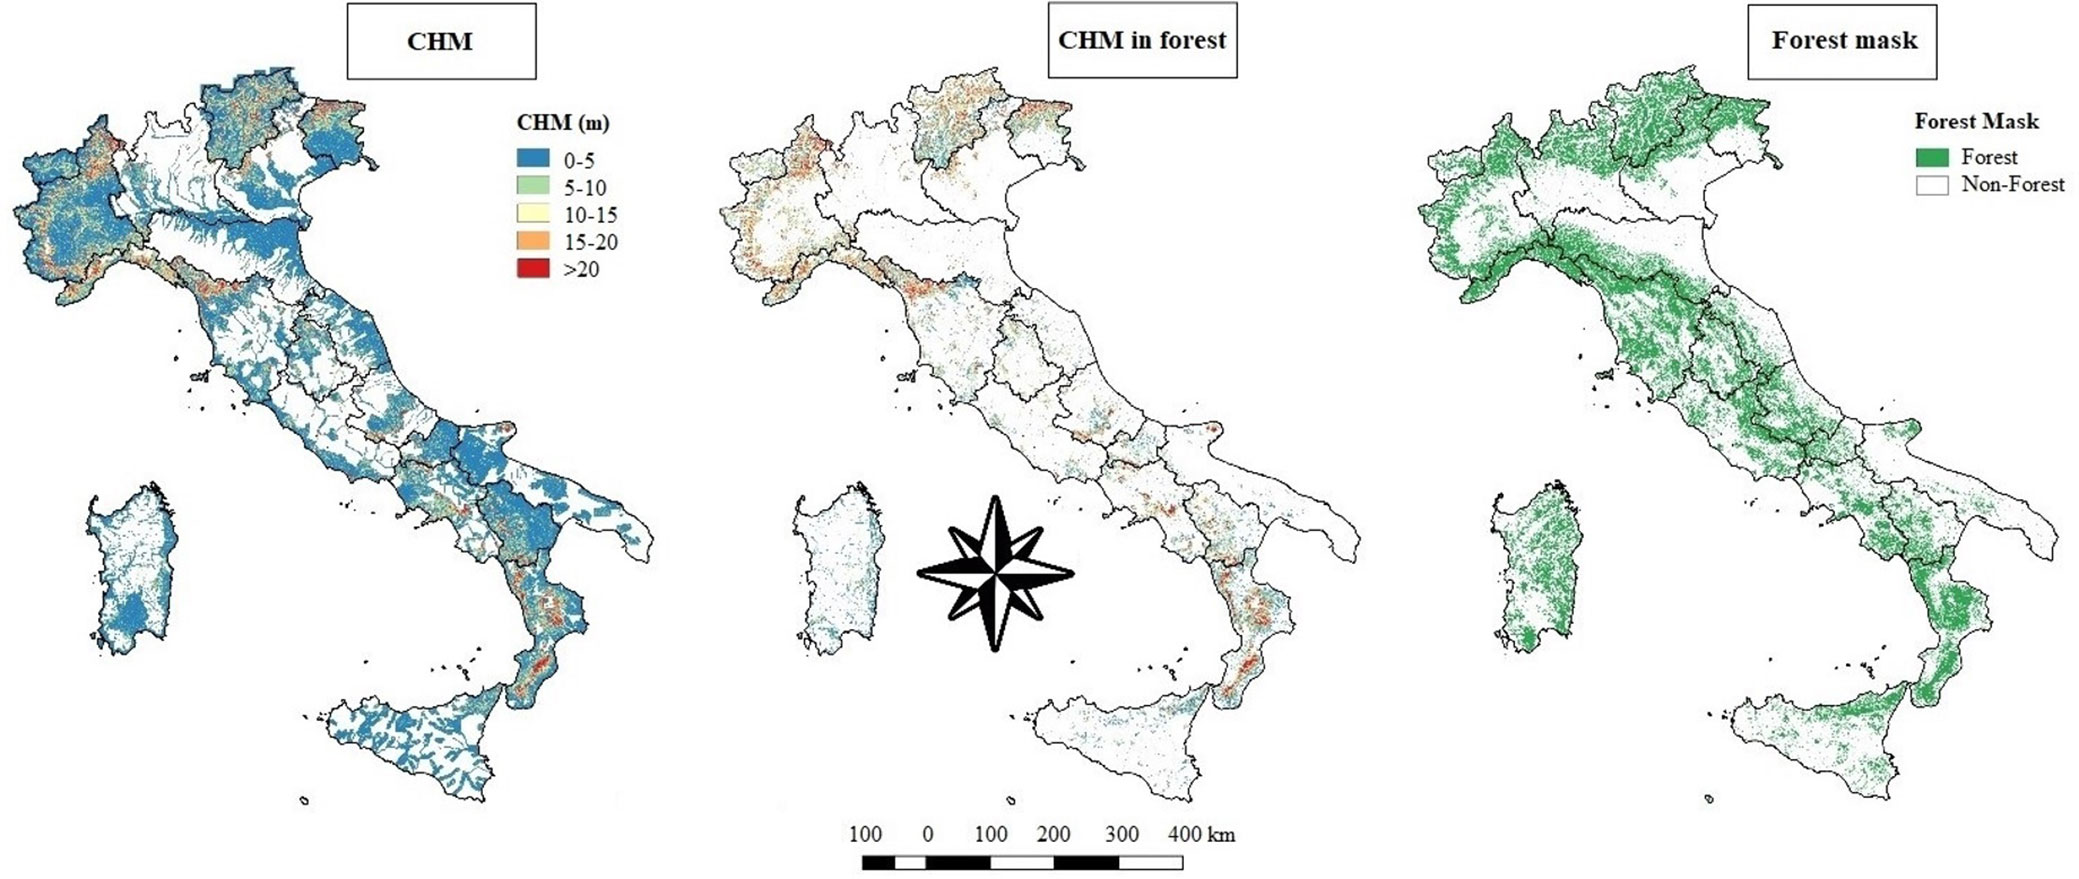
Fig. 5 - Yearly distribution of the area covered by local ALS surveys in Italy.
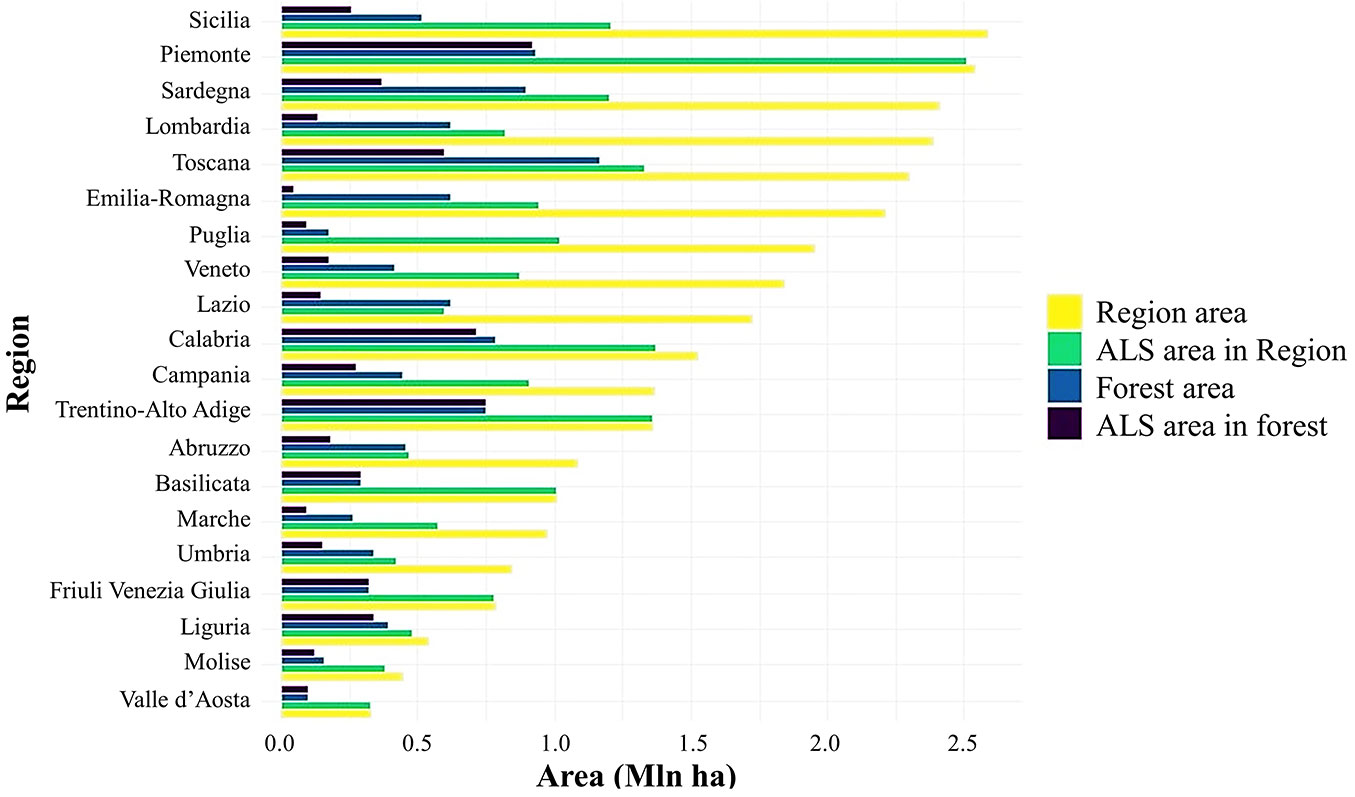
At Regional level (NUTS2) the CHM fully covers the forest area of 4 Regions: Trentino-Alto Adige, Friuli Venezia Giulia, Basilicata, and Valle d’Aosta. In three more Regions, i.e., Piemonte, Calabria and Liguria, the forest area is almost fully included, with 99%, 91%, and 86% coverage, respectively. Emilia-Romagna was the region with the lowest percentage of the forest area covered by the CHM (only 7%), followed by Lombardy (21%), Lazio (23%), and Marche (37% - Fig. 6).
Fig. 6 - Area covered by local ALS surveys in each Italian Region.
Forest Information System web-GIS infrastructure
The harmonized geographic layers described above are available online through an open access web-GIS service representing a possible example of a future geographic Forest Information System. The platform has a user-friendly interface allowing to view and query the Italian National Forest Mask and the national CHM developed in this study. The platform is designed to be scalable and is updated constantly. The first version of the web-GIS platform is available at ⇒ http://forestinfo.it/ (Fig. 7).
Fig. 7 - Forest Information System web-GIS interface (⇒ http://forestinfo.it/).
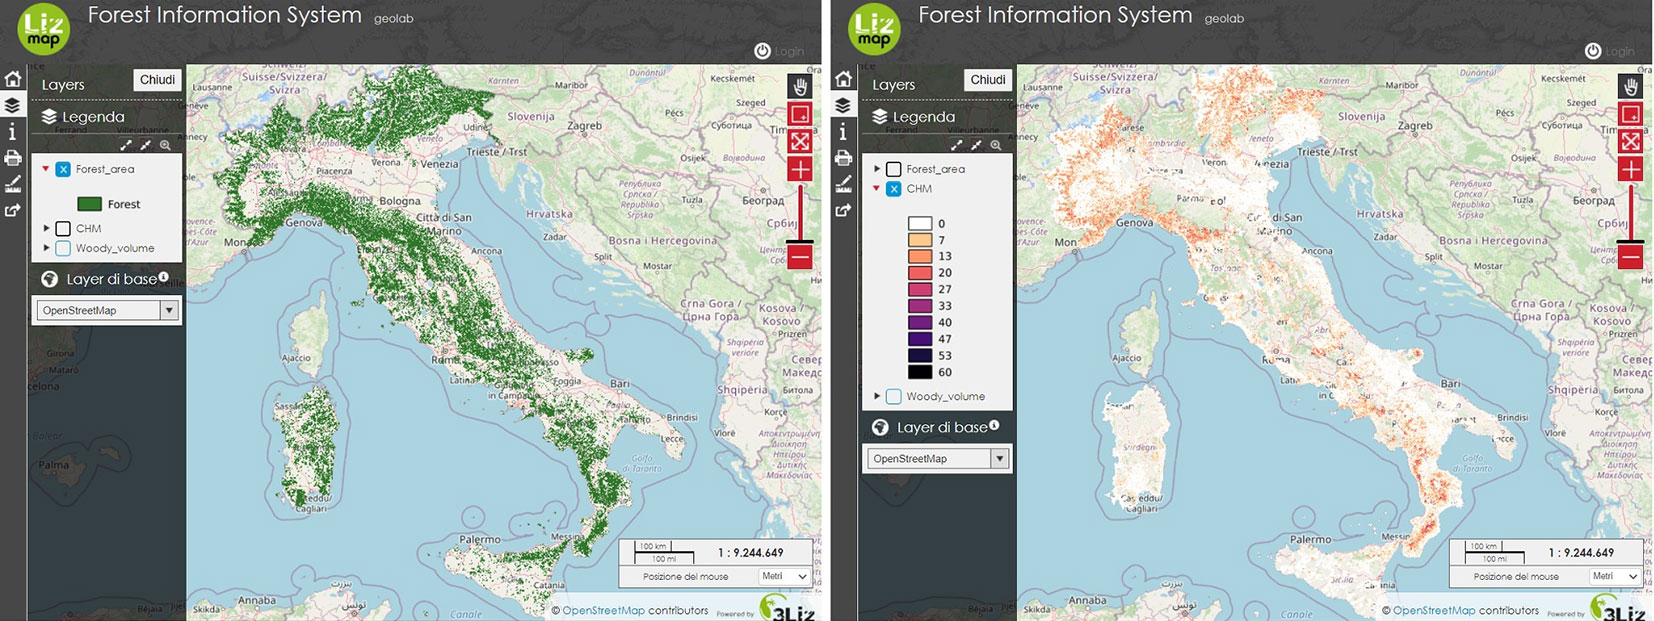
Through the web-GIS, users can interact with the two above data sets (REG-FM and national CHM), though at the moment they cannot be downloaded. The whole platform was developed using free, open-source geospatial libraries. The web-GIS is based on GeoServer® (Java - ⇒ http://geoserver.org/) and Lizmap® (⇒ https://www.3liz.com/) with data stored in a PostgreSQL database, implemented with the extension PostGIS, which allows to select data by query and create customized maps. The web-GIS was structured to allow to manage data independently from data processing. The web platform was designed to host both raster and vector layers.
Discussion
In this study we presented: (i) the creation of a new high resolution Italian National Forest Mask (REG-FM) developed by combining local forest maps; the mask was evaluated against the aggregated forest area estimates derived from the Italian NFI and was compared with two other forest masks based on radar remotely sensed data available globally (JAXA-FM) and for Europe by the COPERNICUS services on the basis of optical imagery (HRL-FM); (ii) a new national high-resolution CHM derived from harmonized datasets at local scale available in Italy; and (iii) the first national forest web-GIS, a platform designed to store and navigate through geographic forest layers. Overall, the size of data collected for this study over three years amount to 24.7 terabytes.
The major problem encountered in the construction of the Italian National Forest Mask (REG-FM) from local forest maps was related to the different forest definitions and classification systems used by the different local Authorities (Tab. 1). In fact, REG-FM was obtained by merging 20 local forest maps (considering the Autonomous Provinces of Trento and Bolzano as a unique Region) created by photointerpretation. Among these, 12 maps used the FAO forest definitions, and 8 the regional forest definitions. For these reasons, the first step of this study was aimed at harmonizing the different forest maps and discarding those forest areas that did not match the FAO definition of forest and other wooded land. In general, the results revealed that REG-FM is more congruent with NFI forest area estimates than JAXA-FM and HRL-FM, at any of the considered spatial scales (i.e., NUTS1, NUTS2 and NUTS3). This was true especially for northern and central Italy, as REG-FM showed more consistent deviations from NFI estimates in the southern regions (i.e., Sardinia, Sicily, Calabria, Basilicata, and Puglia). Such discrepancies can be due to the large presence in these Regions of olive groves, orchards, and abandoned pastures or crops with sparse tree coverage, which can be easily confused with other forest types or shrubby formations typical of the Mediterranean “macchia”. For example, using the HRL-FM in Puglia most of the olive groves were classified as forest, leading to a discrepancy of 145% between HRL-FM and NFI estimates.
Overall, the average difference in forest area estimates between REG-FM and NFI official statistics across regions was about 0.6%, with differences ≥10% for Sicily (+52%), Calabria (+28%), Sardinia (-26%), Marche (-15%) and Umbria (-13%). It is important to note that the larger differences were observed for those Regions where NFI had larger standard errors (between 1.1% and 1.9% - [24]).
For Sardinia, such discrepancies may partly be attributed to the classification system used to develop the local map, which is targeted on habitat types and not specifically on forests. In addition, such map has a very small nominal scale (1:200.000), which is not consistent with a minimum mapping unit of 0.5 ha that should be adopted to be consistent with the FAO forest definition. Finally, in this region forests and other wooded lands are frequently characterized by different types of Mediterranean macchia that is complex to classify through remotely sensing data, even by manual photointerpretation ([22]). However, large discrepancies between forest area estimates in Sardinia were also observed using JAXA-FM and HRL-FM maps. In the northern Regions, the forest area derived from the HRL-FM map was typically underestimated when compared to NFI statistics (from -0.8% of Piemonte to -9% of Friuli Venezia Giulia - Tab. 3). This is likely due to the presence of numerous high-altitude forest edges, with tree cover between 5% and 10% where the transition between shrublands, bushlands or other wooded lands is difficult to assess by photo interpretation. It should be noted that many northern Italian regions do not use a specific class for other wooded land in their nomenclature systems, hampering the harmonization of these maps.
The satellite-derived forest masks (JAXA-FM and HRL-FM) showed to be less accurate than the REG-FM, especially in the southern Regions, but with different performances. The JAXA-FM underestimated the forest area in the southern Regions where the forest is characterized by low vegetation and a limited accumulation of growing stock volume, most probably because the relatively poor sensibility of SAR backscatter in HV-polarization ([27]) in detecting these vegetation types ([22], [4]). The HRL-FM overestimated the forest area at all the considered spatial scales, though the vegetation in urban and agricultural contests was masked out with the Copernicus Forest Additional Support Layer. This procedure may be a possible source of error since it is based on two other maps: the 2012 Imperviousness Degree layer, available among the HRL, and the CLC 2012. Both the above maps may be source of errors, especially if we consider the MMU of 25 ha adopted by the Corine Land Cover map, which is probably too coarse to capture the fragmented mosaic of the Italian landscape. For more details on the Imperviousness Degree layer and the Forest Additional Support Layer, see Langanke ([29]).
Despite the limitations found for some Italian Regions, our results show that REG-FM is the national forest mask most congruent with the forest area estimates of the Italian NFI. The Italian National Forest Mask could be useful for several applications, e.g., to create wall-to-wall spatial estimates of forest variables ([10]), to mask out non-forest areas when monitoring forest disturbances from clear-cuts ([18], [15]) or windthrow damages, as well as for studying forest fragmentation and ecological networks at national scale level.
As already mentioned, a wall-to-wall coverage of ALS data is still missing for Italy ([10]) and a full catalogue of the main ALS data acquisitions and their extension was also unavailable so far. To the best of our knowledge, this is the first study reporting an exhaustive description of the ALS data currently available in Italy. Moreover, ALS data sets collected by different authorities share some common characteristics which are considered suitable for forestry applications ([19], [53]): flight altitudes of the acquisition between 500 m and 3000 m; spatial resolution of derived DTM and DSM raster ranging between 1 m and 5 m; pulse density between 0.4 and 5 pulses m-2. Low-pulse ALS (0.4-1.0 pulses m-2) usually aimed at the creation of digital elevation models (DTM or DSM) still allow a reliable estimation of typically forest structure metrics at the plot level (~23 m pixel size - [26]).
Most of the ALS data considered in this study were acquired during three years, i.e., 2008 (18.4%), 2009 (17.6%), and 2010 (21.9%). Several studies demonstrated that a lag time larger than 5 years between field measures and ALS data can be problematic when ABA approach is used to estimate forest variables ([53], [46]). These means that when the new NFI data for 2015 will be available, most of the currently existing ALS data will be outdated.
In addition to new ALS surveys, new data should be considered for future applications and implementations nationwide, such as those from the NASA’s Global Ecosystem Dynamics Investigation (GEDI) mission, which is a waveform LiDAR sensor mounted on the International Space Station, designed to provide a sample of ground-based and canopy LiDAR metrics for large-scale analysis in the Mediterranean forests as well ([13]).
The availability of the two national geographic layers obtained in this study will allow the possibility of producing additional national forest layers. For example, it will be possible to derive spatial estimation of NFI forest variables using model-assisted estimators, which require the availability of a forest mask ([35], [37], [5], [10]) or hierarchical models, which are specifically designed to use partial CHM coverage ([43]). Moreover, these layers can be used to study forest structure ([53], [47], [37], [5]), species characterization ([32]), habitat modeling ([48]), or mapping forest disturbances using optical remote sensing data ([18], [15]).
To ensure a wide use of the two national layers, and other forest layers that will be released in the future, a FIS web-GIS platform was developed. The platform has free access and allows users to perform query on specific areas of interest using maps consistent and aligned with a national grid with cell size of 23 × 23 m. Expected future improvement of the FIS web-GIS are: the implementation of additional tools specifically designed for forest applications to overcome the limitation of the regional geo-portal, which are usually designed just for cartographic purposes; the release of additional national forest geographic layers, such as the growing stock volume map based on NFI data ([10]).
Finally, it is important to note that the availability of national spatial forest data sets such as forest/non-forest mask, forest types, forest roads, and growing stock volume is a basic requirement to develop precision forestry applications ([11]) and forest decision support systems at national level, similar to those already tested at regional scale in Italy to support forest planning and management ([42]), and to map and value forest ecosystem services ([49]).
Conclusion
We generated the first high resolution forest mask of Italy (REG-FM) by combining local forest and land use maps. Although the original input data sets were created with different forest definitions and at different dates, the resulting forest mask undestimated for less than 2% the official NFI estimation of the total forest area.
The REG-FM resulted more congruent with NFI statistics than forest masks based on radar (JAXA-FM) and optical (HRL-FM) imagery at national level. However, in some Regions and Provinces the REG-FM was affected by large discrepancies, most probably for a mix of different causes (differences in forest definitions, characteristics of the vegetation especially in Mediterranean macchia and on forest edges). This indicates that the REG-FM cannot be currently adopted as an official layer for reporting purposes and an operational revision of REG-FM by manual photointerpretation is required.
The harmonized CHM produced by combining all the ALS data sets currently available in Italy covers only the 59% of Italian forests and will be soon outdated. These kind of data are essential for forest monitoring and should be routinely acquired together with aerial images.
We implemented an online freely available FIS web-GIS to share this information to all the potential stakeholders (i.e., forest owners, managers, and technicians of local and national administrations). We hope that this could encourage the launch of an operational project for implementing an online National Geographic Forest Information System in Italy. We also recommend that the different forest mapping and monitoring programs currently active in Italy converge on a common nomenclature system, thus facilitating the production of harmonized maps ([7]). For this purpose, we suggest the adoption of the European Forest Types nomenclature systems ([2]), which covers all the extant forest types in Italy. Lastly, we hope for both NFI data and the exact coordinates of the measured plots to be publicly released by the Italian NFI in the framework of the 3rd National forest inventory, to support the development of future forest maps with ABA approach, such as those of growing stock volume or biomass.
Finally, we strongly suggest the evolution of the Italian NFI program into a permanent monitoring system, in order to update the ground data over a period of 5-10 years by visiting a sub-sample of the field plots each year, as it is currently done in other EU and non-EU NFI programs.
References
Gscholar
CrossRef | Gscholar
CrossRef | Gscholar
CrossRef | Gscholar
CrossRef | Gscholar
Online | Gscholar
CrossRef | Gscholar
Online | Gscholar
Gscholar
CrossRef | Gscholar
CrossRef | Gscholar
Gscholar
CrossRef | Gscholar
Authors’ Info
Authors’ Affiliation
Elia Vangi 0000-0002-9772-2258
Saverio Francini 0000-0001-6991-0289
Francesca Giannetti 0000-0002-4590-827X
Davide Travaglini 0000-0003-0706-2653
Gherardo Chirici 0000-0002-0669-5726
Dept. of Agriculture, Food, Environment and Forestry (DAGRI), University of Florence, v. San Bonaventura, 13, 50145 Florence (Italy)
Dept. of Bioscience and Territory (DiBT), University of Molise, c.da Fonte Lappone, I-86090 Pesche, IS (Italy)
Yamuna Giambastiani 0000-0002-3613-2975
Bluebiloba startup Innovativa s.r.l., v. C. Salutati 78, 50126 Florence (Italy)
Gherardo Chirici 0000-0002-0669-5726
ForTech, University of Florence joint laboratory, v. San Bonaventura 13, 50145 Florence (Italy)
Dept. of Computer Engineering, Modeling, Electronics, and Systems Science (DIMES), University of Calabria, v. P. Bucci 41C, I-87036 Rende, CS (Italy)
Geoportale Nazionale, Italian Ministry of the Environment, v. Cristoforo Colombo 44, 00147 Rome (Italy)
Corresponding author
Paper Info
Citation
D’Amico G, Vangi E, Francini S, Giannetti F, Nicolaci A, Travaglini D, Massai L, Giambastiani Y, Terranova C, Chirici G (2021). Are we ready for a National Forest Information System? State of the art of forest maps and airborne laser scanning data availability in Italy. iForest 14: 144-154. - doi: 10.3832/ifor3648-014
Academic Editor
Matteo Garbarino
Paper history
Received: Sep 07, 2020
Accepted: Feb 18, 2021
First online: Mar 23, 2021
Publication Date: Apr 30, 2021
Publication Time: 1.10 months
Copyright Information
© SISEF - The Italian Society of Silviculture and Forest Ecology 2021
Open Access
This article is distributed under the terms of the Creative Commons Attribution-Non Commercial 4.0 International (https://creativecommons.org/licenses/by-nc/4.0/), which permits unrestricted use, distribution, and reproduction in any medium, provided you give appropriate credit to the original author(s) and the source, provide a link to the Creative Commons license, and indicate if changes were made.

Web Metrics
Breakdown by View Type
Article Usage
Total Article Views: 43439
(from publication date up to now)
Breakdown by View Type
HTML Page Views: 33762
Abstract Page Views: 4535
PDF Downloads: 4408
Citation/Reference Downloads: 10
XML Downloads: 724
Web Metrics
Days since publication: 1920
Overall contacts: 43439
Avg. contacts per week: 158.37
Article Citations
Article citations are based on data periodically collected from the Clarivate Web of Science web site
(last update: Mar 2025)
Total number of cites (since 2021): 28
Average cites per year: 5.60
Publication Metrics
by Dimensions ©
Articles citing this article
List of the papers citing this article based on CrossRef Cited-by.
Related Contents
iForest Similar Articles
Research Articles
Integrating area-based and individual tree detection approaches for estimating tree volume in plantation inventory using aerial image and airborne laser scanning data
vol. 10, pp. 296-302 (online: 15 December 2016)
Technical Advances
Forest stand height determination from low point density airborne laser scanning data in Roznava Forest enterprise zone (Slovakia)
vol. 6, pp. 48-54 (online: 21 January 2013)
Research Articles
Estimation of forest biomass components using airborne LiDAR and multispectral sensors
vol. 12, pp. 207-213 (online: 25 April 2019)
Research Articles
Optimizing line-plot size for personal laser scanning: modeling distance-dependent tree detection probability along transects
vol. 17, pp. 269-276 (online: 07 September 2024)
Research Articles
Three-dimensional forest stand height map production utilizing airborne laser scanning dense point clouds and precise quality evaluation
vol. 10, pp. 491-497 (online: 12 April 2017)
Research Articles
Estimation of aboveground forest biomass in Galicia (NW Spain) by the combined use of LiDAR, LANDSAT ETM+ and National Forest Inventory data
vol. 10, pp. 590-596 (online: 15 May 2017)
Research Articles
Determining basic forest stand characteristics using airborne laser scanning in mixed forest stands of Central Europe
vol. 11, pp. 181-188 (online: 19 February 2018)
Research Articles
Integration of tree allometry rules to treetops detection and tree crowns delineation using airborne lidar data
vol. 10, pp. 459-467 (online: 04 April 2017)
Review Papers
Integration of forest mapping and inventory to support forest management
vol. 3, pp. 59-64 (online: 17 May 2010)
Research Articles
Comparing image-based point clouds and airborne laser scanning data for estimating forest heights
vol. 10, pp. 273-280 (online: 23 February 2017)
iForest Database Search
Search By Author
- G D’Amico
- E Vangi
- S Francini
- F Giannetti
- A Nicolaci
- D Travaglini
- L Massai
- Y Giambastiani
- C Terranova
- G Chirici
Search By Keyword
Google Scholar Search
Citing Articles
Search By Author
- G D’Amico
- E Vangi
- S Francini
- F Giannetti
- A Nicolaci
- D Travaglini
- L Massai
- Y Giambastiani
- C Terranova
- G Chirici
Search By Keywords
PubMed Search
Search By Author
- G D’Amico
- E Vangi
- S Francini
- F Giannetti
- A Nicolaci
- D Travaglini
- L Massai
- Y Giambastiani
- C Terranova
- G Chirici
Search By Keyword


