Integration of tree allometry rules to treetops detection and tree crowns delineation using airborne lidar data
iForest - Biogeosciences and Forestry, Volume 10, Issue 2, Pages 459-467 (2017)
doi: https://doi.org/10.3832/ifor2093-010
Published: Apr 04, 2017 - Copyright © 2017 SISEF
Research Articles
Abstract
Airborne laser scanning (ALS) has recently gained increasing attention in forestry, as ALS data may facilitate the efficient assessment of forest inventory attributes and ecological indicators related to forest stand structure. This paper presents a novel workflow for individual tree detection and tree crown delineation using ALS data. The developed point-based approach included several tree allometry rules on permissible tree heights and crown dimensions to increase the likelihood of detecting the actual tree profiles. The accuracy of the method was assessed in a heterogeneous forest with a complex stand structure in Slovakia (Central Europe). ALS measurements were taken using a RIEGL Q680i scanner at 700 m of height with a point density of 20 echoes per m2. The ground reference data included the measured positions and dimensions of 1332 trees in nine plots distributed across the region. We found that the number of individual trees detected by the algorithm using ALS data was systematically underestimated by 34 ± 15% relative to the reference data. The delineated crown coverage was underestimated by 2 ± 6% as well, but the latter difference was not statistically significant (p>0.05).
Keywords
Tree Allometry, Airborne Laser Scanning, Individual Tree Detection, Point-based Approach
Introduction
In recent years, airborne laser scanning (ALS), also referred to as airborne light detection and ranging (LiDAR), has become established as a novel technology for estimating forest inventory attributes (e.g., tree or stand height and diameter, basal area, volume - [13], [28]). The capability of ALS to penetrate tree crowns enables the collection of data on tree and stand characteristics that would otherwise require on-site measurement ([38]). Moreover, the recognition that stand structural diversity has a positive effects on the quality of most ecosystem services has further fostered the application of new remote sensing approaches to stand-structure mapping ([2]). In general, there are two broad groups of forest inventory methods based on ALS data: area-based approaches (ABA) and individual tree detection approaches (ITD).
The area-based prediction of forest attributes relies on the statistical dependency between the field-measured and ALS-derived variables ([25]), i.e., forest attributes are regressed against the ALS-derived metrics. Such statistical relationships can be approximated using linear models ([27]), non-parametric approaches including nearest-neighbors imputation ([1]), linear mixed effects models with random stand-level intercepts ([43]) or Bayesian methods ([10]). ABA methods have been used to assess forest attributes for nearly 20 years ([30], [14], [47]), though their reliability in terms of information on tree species, tree size distribution and the number of trees still remains limited ([11]).
ITD methods involve a sequence of steps that includes tree detection, feature extraction, and estimation of tree attributes ([45]). Direct detection of individual trees and assessment of tree heights usually involves a raster-based or point-based techniques ([31], [23]), whereas tree or stand parameters are usually inferred indirectly ([42]). For example, tree or stand diameters are estimated based on tree height, crown size or stem density using allometric models, geometrically weighted regression methods ([37]) or various non-parametric approaches ([32]). The precision of estimates of tree and stand volume, which are the primary variables of forestry interest, ultimately depends on the accuracy of the underlying characteristics, and is affected by the accumulation of both detection and estimation errors ([26]). Although numerous tree-level algorithms have been reported in the literature, their accuracy is still inadequate for ITD methods to be applied in forest inventories ([45]).
Many approaches have been developed to detect individual trees based on ALS data. Overviews were provided by Vauhkonen et al. ([44]), Kaartinen et al. ([16]), Koch et al. ([21]), and Eysn et al. ([4]). Typically, the smoothed canopy height models (CHM) or laser point clouds are used for local maxima detection and expansion ([20], [50]), watershed-based delineation ([48]) and point-cloud clustering ([33], [8]). Hybrid techniques that combine the ALS data with different kinds of geo-data and a variety of a priori information are also used ([9], [22]). A promising solution for improving tree detection accuracy is based on the use of tree allometry. For example, the region-growing algorithm by Tiede & Hoffmann ([41]) stops the tree detection process based on the minimal height and maximal permissible width of a tree crown. Ene et al. ([3]) proposed to use the area-based estimate of stem number for optimizing the CHM resolution and filter size. Swetnam & Falk ([39]) included a rule based on the expected canopy radius in the treetop detection algorithm that prevents branches of a single tree crown to be classified as local maxima, which usually reflect the treetops.
The comparability of accuracy assessments conducted under different conditions is limited. However, it has been suggested that the extraction method from ALS data is the main factor affecting the accuracy of tree detection, while point cloud density has a lesser impact ([15]). Plot size may also affect the accuracy of estimates of forest structure attributes. In particular, larger plots can increase the accuracy since the edge effect and co-registration errors are significantly reduced as compared with smaller plots ([7], [36]). Research has also suggested that accuracy of tree detection in terms of the relative root mean square error (RMSE%) is in the range of 32-89% and the detection rate is in the range of 40-93%.
The aim of this paper is to present a point-based workflow for detecting individual trees and delineating their crowns based on ALS data. The proposed algorithm attempts to improve several shortcomings of the current extraction methods through the following steps:
- the algorithm uses the complete information contained in ALS data in all procedures of tree detection workflow, and optimizes the computationally demanding operations by tiling and thinning techniques applied on the raw ALS data;
- treetops detection and tree crowns delineation is done iteratively, and each iteration includes tests for treetop identification based on tree allometry rules, aiming to ensure that the permissible spatial and the dendrometric structure of a forest stand and a tree are not violated, and that the likelihood of falsely identified trees is reduced;
- users can modify a number of parameters and customize the algorithm for matching specific stand conditions and/or meeting specific objectives.
The presented algorithm is implemented in the reFLex (remote Forest Land explorer) software, which was developed by the National Forest Centre, Slovakia. The objective was to develop an easy-to-use application to be employed in the forestry practice.
Materials and methods
Algorithm description
The algorithm for treetop detection and tree crown delineation includes five connected procedures which are described in detail in the following sub-chapters.
The input file is a classified point cloud containing ground and vegetation classes. The initial procedures are applied to: (i) divide the points into a 3-dimensional regular tiles (Tiling procedure); (ii) calculate the absolute height above ground for each point (Normalization procedure); and (iii) reduce the number of points in the input file by applying a minimum tree height threshold (Height restriction procedure). These operations yield a point cloud that is further used for an iterative search of treetops and tree crowns (Finding the local maxima, Geo-Dendrometric test, Delineation of tree crowns). Finally, the outputs of all procedures are exported to point and polygon vector files in the ESRI shape (shp) format.
Point cloud tiling and normalization
The tiling procedure is used to divide the raw point cloud to a regular 3-dimensional tiles. This procedure is applied to efficiently use the computer memory and allow for parallel processing of points allocated to the tiles. The user-defined tile size (TS) is a variable that can significantly affect output accuracy.
The normalization of raw point cloud was applied to calculate the absolute height above ground (hnor) for each point in each tile (eqn. 1):
where hnor is the normalized height of points in the tile (in m), zmax is the elevation of points in the tile (m a.s.l.), zmin is the elevation of the lowest point in the tile interpolated from the three adjacent tiles (m a.s.l.).
Height restriction
The height restriction procedure defines the minimal height (m) of trees to be identified, thereby all points below this threshold are discarded. This operation reduces the initial number of points and the required computation time, and defines a shortest tree to be identified in the next steps.
Finding the local maxima
A moving-window analysis ([6], [24]) is applied to search iteratively for local maxima (as presumed treetops) in the processed point cloud. The search is performed in an area covering eight neighboring tiles (fewer at edge locations). The detected local maxima are referred to as the theoretical treetops (Tteo), and then subjected to a geo-dendrometric (GD) test.
Geo-dendrometric test
As part of the local maxima detected in the previous operation might not be indicative of true treetops, an additional test is applied to select a subset of Tteo that is considered to include the real treetops. We conceived a set of dendrometric criteria which define a permissible tree and stand structure in terms of tree distribution, height relationships between trees, and the relationship between tree height and crown dimensions. The values of such criteria can be derived from ground-sample data collected in the evaluated area or taken from literature on tree allometry. The Tteo that pass the GD test conditions are referred to as true treetops (Ttrue). The remaining Tteo become false treetops (Tfalse) and are processed along with the remaining points in a cloud in the next operations of the workflow. The GD test consists of the following steps:
Fig. 1 - (a) Test for height difference between trees: a testing area (rlim) is created around each theoretical treetop (Tteo, grey trees) with radius equal to the ratio of mean crown radius to tree height in the investigated forest (crmean, 0.15 or 0.3 of tree height in the example); (b) If only one Tteo is found in the rlim, it is marked as real treetop (Ttrue, green tree); (c) otherwise, all co-occurring Tteo are marked as testing tops (Ttest, brown trees).
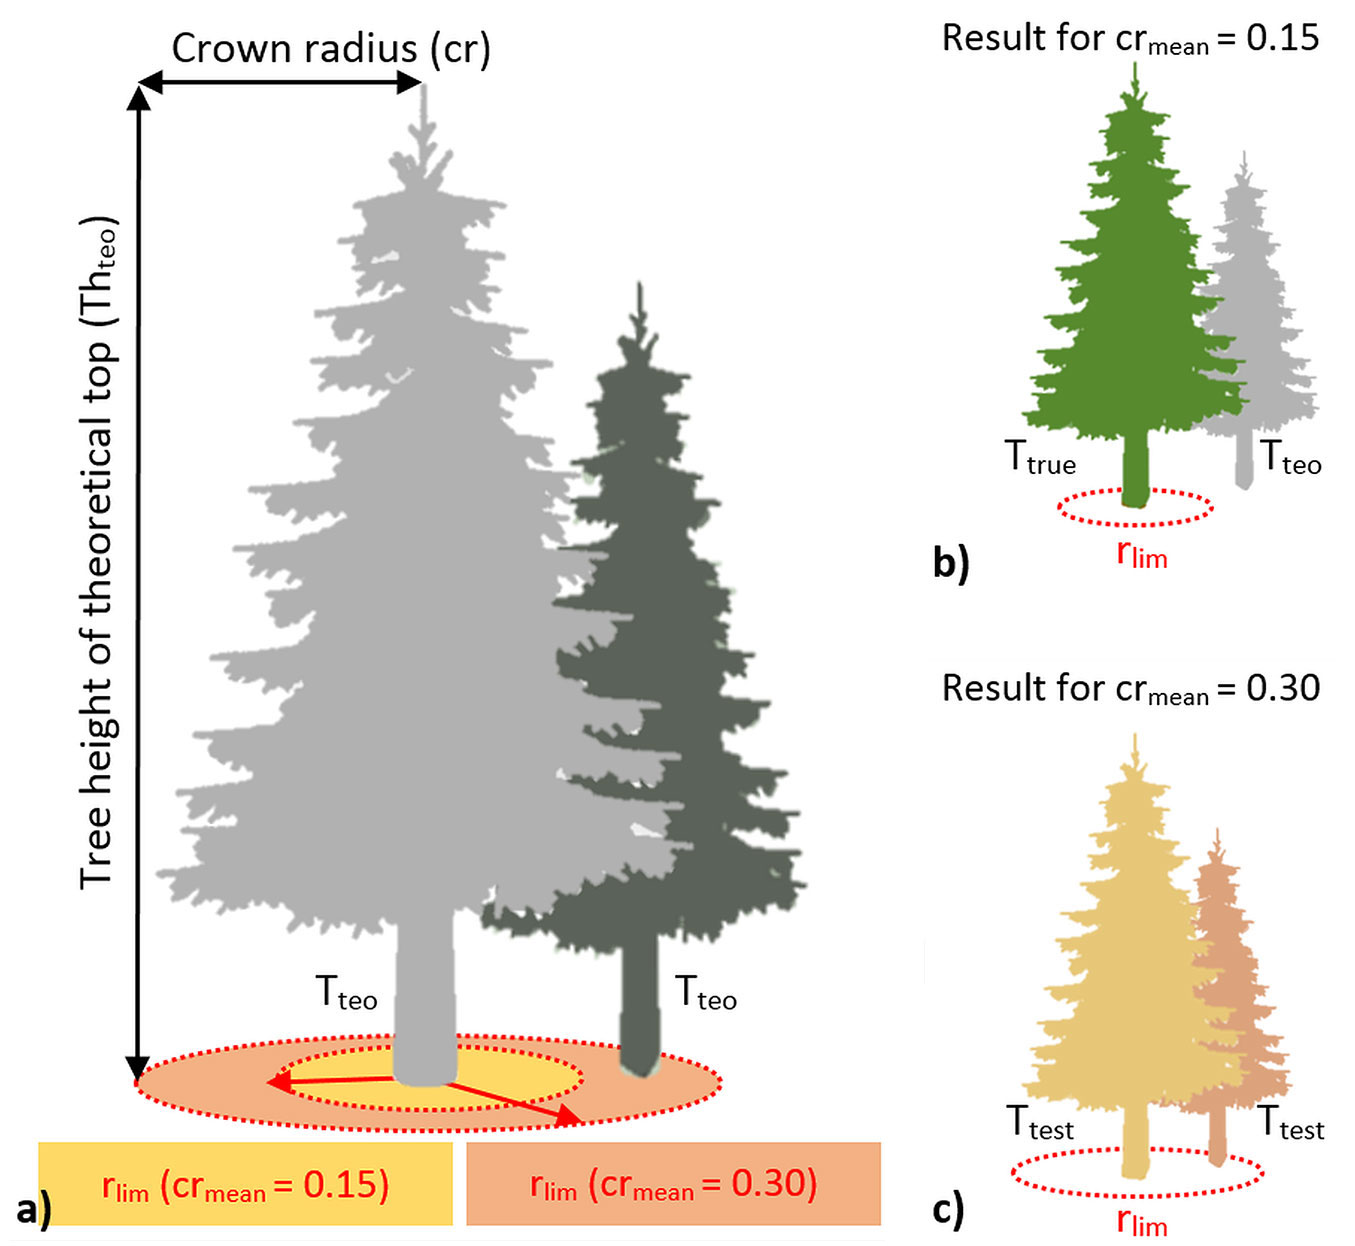
(a) Testing for height differences between trees. A circular test area with radius that approximates the ratio of mean crown radius to tree height in the stand (crmean), is created around each Tteo (Fig. 1a), and the presence of other Tteo within the test area is evaluated. The size of the test area rlim (m) is defined as (eqn. 2):
Fig. 2 - Test for height difference between trees (second part). (a) The normalized heights hT.nor (black points) between the pairs of Ttest are calculated using the point cloud data. Then, the height difference limit hlim is calculated for the lower Ttest in each pair of Ttest (light brown tree). The limit depends on the ratio of mean tree height differences to tree height in the stand (hdmean, 0.15 and 0.3 in the example); (b) If any hT.nor is lower than the hlim, the Ttest is marked as real treetop (Ttrue, green trees); (c) otherwise, Ttest is marked as false treetop (Tfalse, dark brown tree).
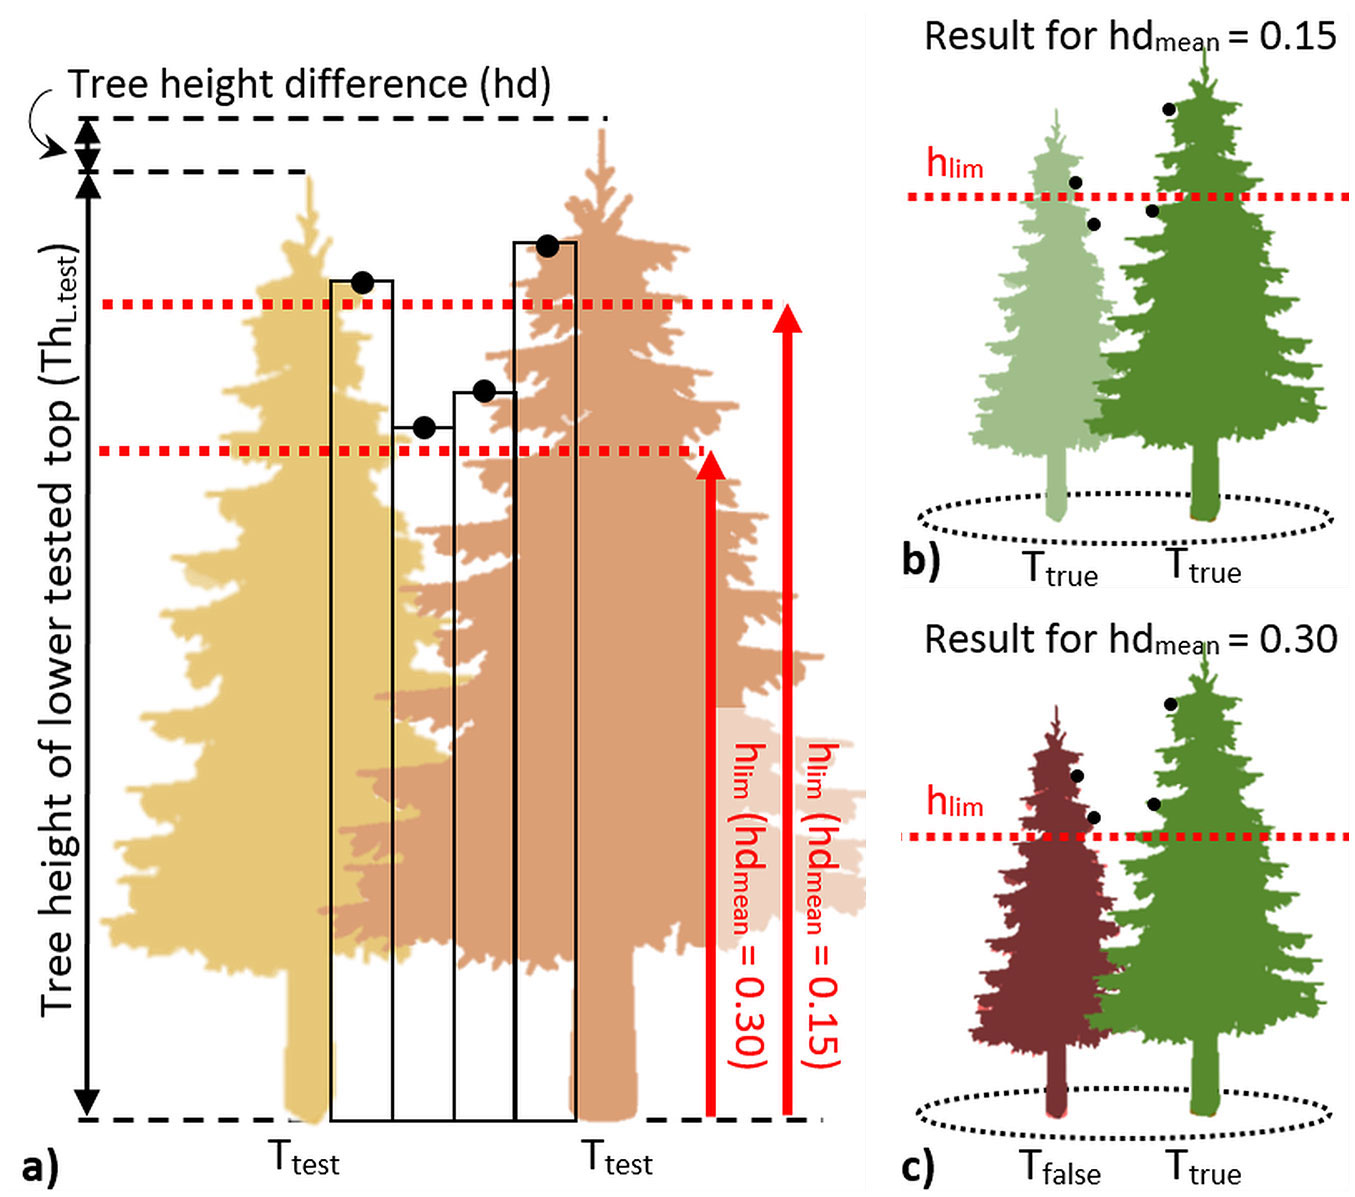
where Thteo is the tree height of the theoretical top (m), and crmean is a user-defined estimate of the ratio of mean crown radius to tree height in the investigated forest. If no additional Tteo occurs at a distance < rlim, such Tteo is accepted as a real treetop and is maked Ttrue (Fig. 1b). Contrastingly, when others Tteo occur within the rlim, such Tteo are marked as Ttest and tested for height differences (Fig. 1c). The rationale underlying this test is that if the heights between the two tested Tteo are convex, such Tteo represent two treetops. In the opposite case, the lower Tteo is discarded, and only the higher Tteo is marked as a real treetop, while the discarded Tteo is considered as a part of crown of the higher Tteo. To decide which Ttest in the tested pairs is the real treetop, the normalized heights (hT.nor) connecting the respective pair of Ttest are evaluated (Fig. 2a). The next step requires a customized value that approximates the ratio of mean tree height differences to tree height in the investigated forest (hdmean). Then, the limit hlim (m) is calculated for each lower Ttest as (eqn. 3):
where hlim is the limit of the test (m), ThL.test is the tree height of the lower tested top (m) and hdmean is the estimate of the ratio of mean tree height differences to tree height in the investigated forest.
Finally, if at least one hT.nor between the evaluated pair of Ttest is below hlim, both tested Ttest are accepted as real treetops (Fig. 2b). In the opposite case, only the higher Ttest is considered as a real treetop (Fig. 2c).
Fig. 3 - Tests of horizontal and vertical distance between trees are performed simultaneously to remove the theoretical treetops in locations where treetops are not expected to exist. (a) A horizontal limit dlim is calculated for each treetop Ttrue to represent a maximum permissible crown width in the stand (cwmax, 0.4 of tree height in the presented example). A vertical limit llim is calculated to define a maximum permissible tree length (clmax, 0.5 and 0.8 of tree height in the presented example); (b, c) Then, all tested treetops (Ttest) are classified as either new real treetops (Ttrue) or false treetops (Tfalse).
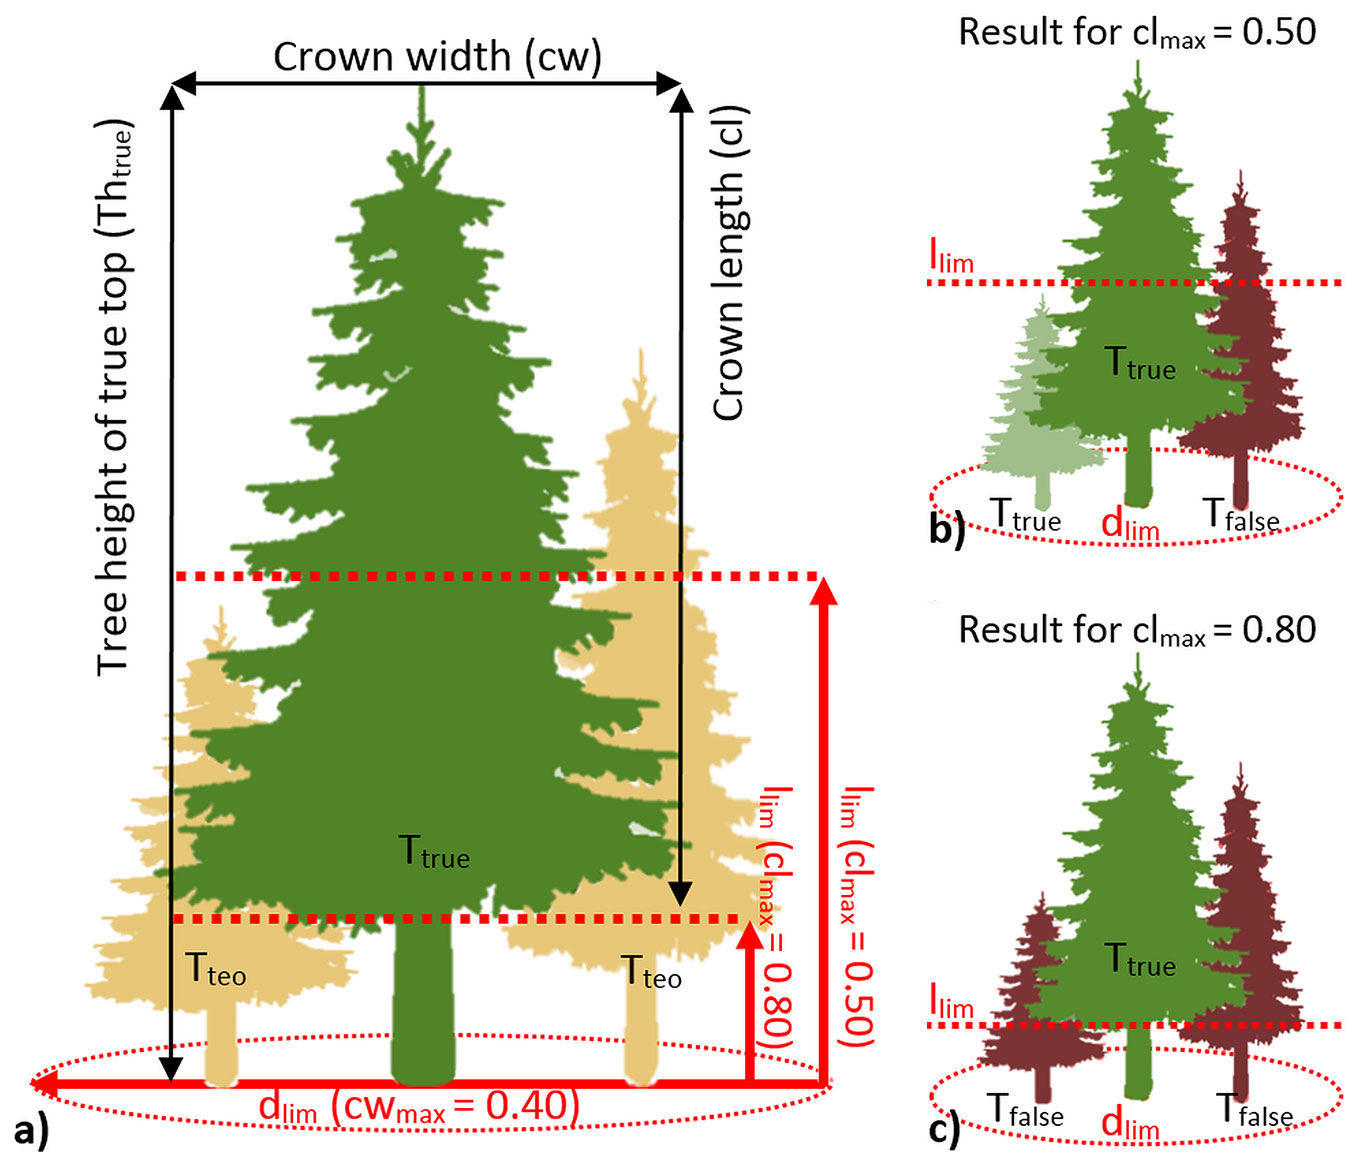
(b) Test of the horizontal and vertical distance between trees. The horizontal distance between trees is calculated in order to discard false treetops situated in the crowns of other trees. First, the distance to the closest Ttrue is calculated for all new Ttest (i.e., those appearing in the second and subsequent iterations of the mowing-window-based search for the local maxima - Fig. 3a). The next step requires the maximum permissible crown width (cwmax - crown width expressed as a proportion of tree height) to be customarily established for the investigated forest. Then, the limit dlim (m) is calculated for each Ttrue (eqn. 4):
where dlim is the limit of the test (m), Thtrue is the tree height of the true top (m), cwmax is the estimate of the ratio of maximum crown diameter to tree height in the evaluated forest. The test assumes that no treetop is allowed to occur within the distance dlim around any Ttrue. The case of trees growing in the understorey is described below.
The vertical distance between trees is tested to discard false treetops situated in the crowns of other trees, and to capture the trees situated under the canopy. The test requires the user to specify the maximum crown length in the investigated forest, in terms of crown length proportion of tree height (clmax). Then, the limit llim (m) is calculated for each Ttrue (eqn. 5):
where llim is the limit of the test (m), Thtrue is the tree height of the true top (m), clmax is the estimate of the ratio of maximum crown length to tree height in the investigated forest. This test assumes that a treetop can occur under the crown of any Ttrue (Fig. 3b, Fig. 3c).
Delineation of tree crowns
Each Ttrue is assigned to its central crown part (CCP), which is a circle of diameter equal to the tile size (TS). Then, the peripheral crown parts (PCP) of the point cloud are repeatedly assigned to the nearest CCP until they meet any point already assigned to any other CCP or until they reach the limits for assigning new crown parts (described below). A height limit ensures that all PCP which are to be assigned to the CCP are lower than Ttrue and in the height range specified by the crown length limit (llim). Distance limit ensures that PCP is situated within the permissible width range specified by the crown distance limit (dlim). The information on the horizontal and vertical positions of all tested PCP is obtained from the point cloud data.
Finally, all parts of the crown (central and peripheral) assigned to the Ttrue are merged to create a single crown object, and its profile is smoothed by Bezier interpolation. We found this method to well approximate the real 2D crown projection, allowing the fast processing of a large number of tree crowns. After the crown delineation phase is completed, the crown coverage is calculated as the ratio of the forest floor covered by the delineated vertical crown projection and the whole stand area.
Parameters used in the current study
We tested the effect of three tile sizes (TS = 1, 2 and 3 m) on tree detection performance. A minimum tree height parameter was set with respect to the conventional forest definitions by IUFRO and FAO to 5 m. Limits for geo-dendrometric test and crown delineation were estimated based on field sample data. The ratio of mean crown radius to tree height (crmean) was set to 0.15, the ratio of mean tree height differences to tree height (hdmean) was 0.1, the ratio of maximum crown width to tree height (cwmax) was 0.4, and the ratio of maximum crown length to a tree height (clmax) was set at 0.7.
Data sources
Study area description
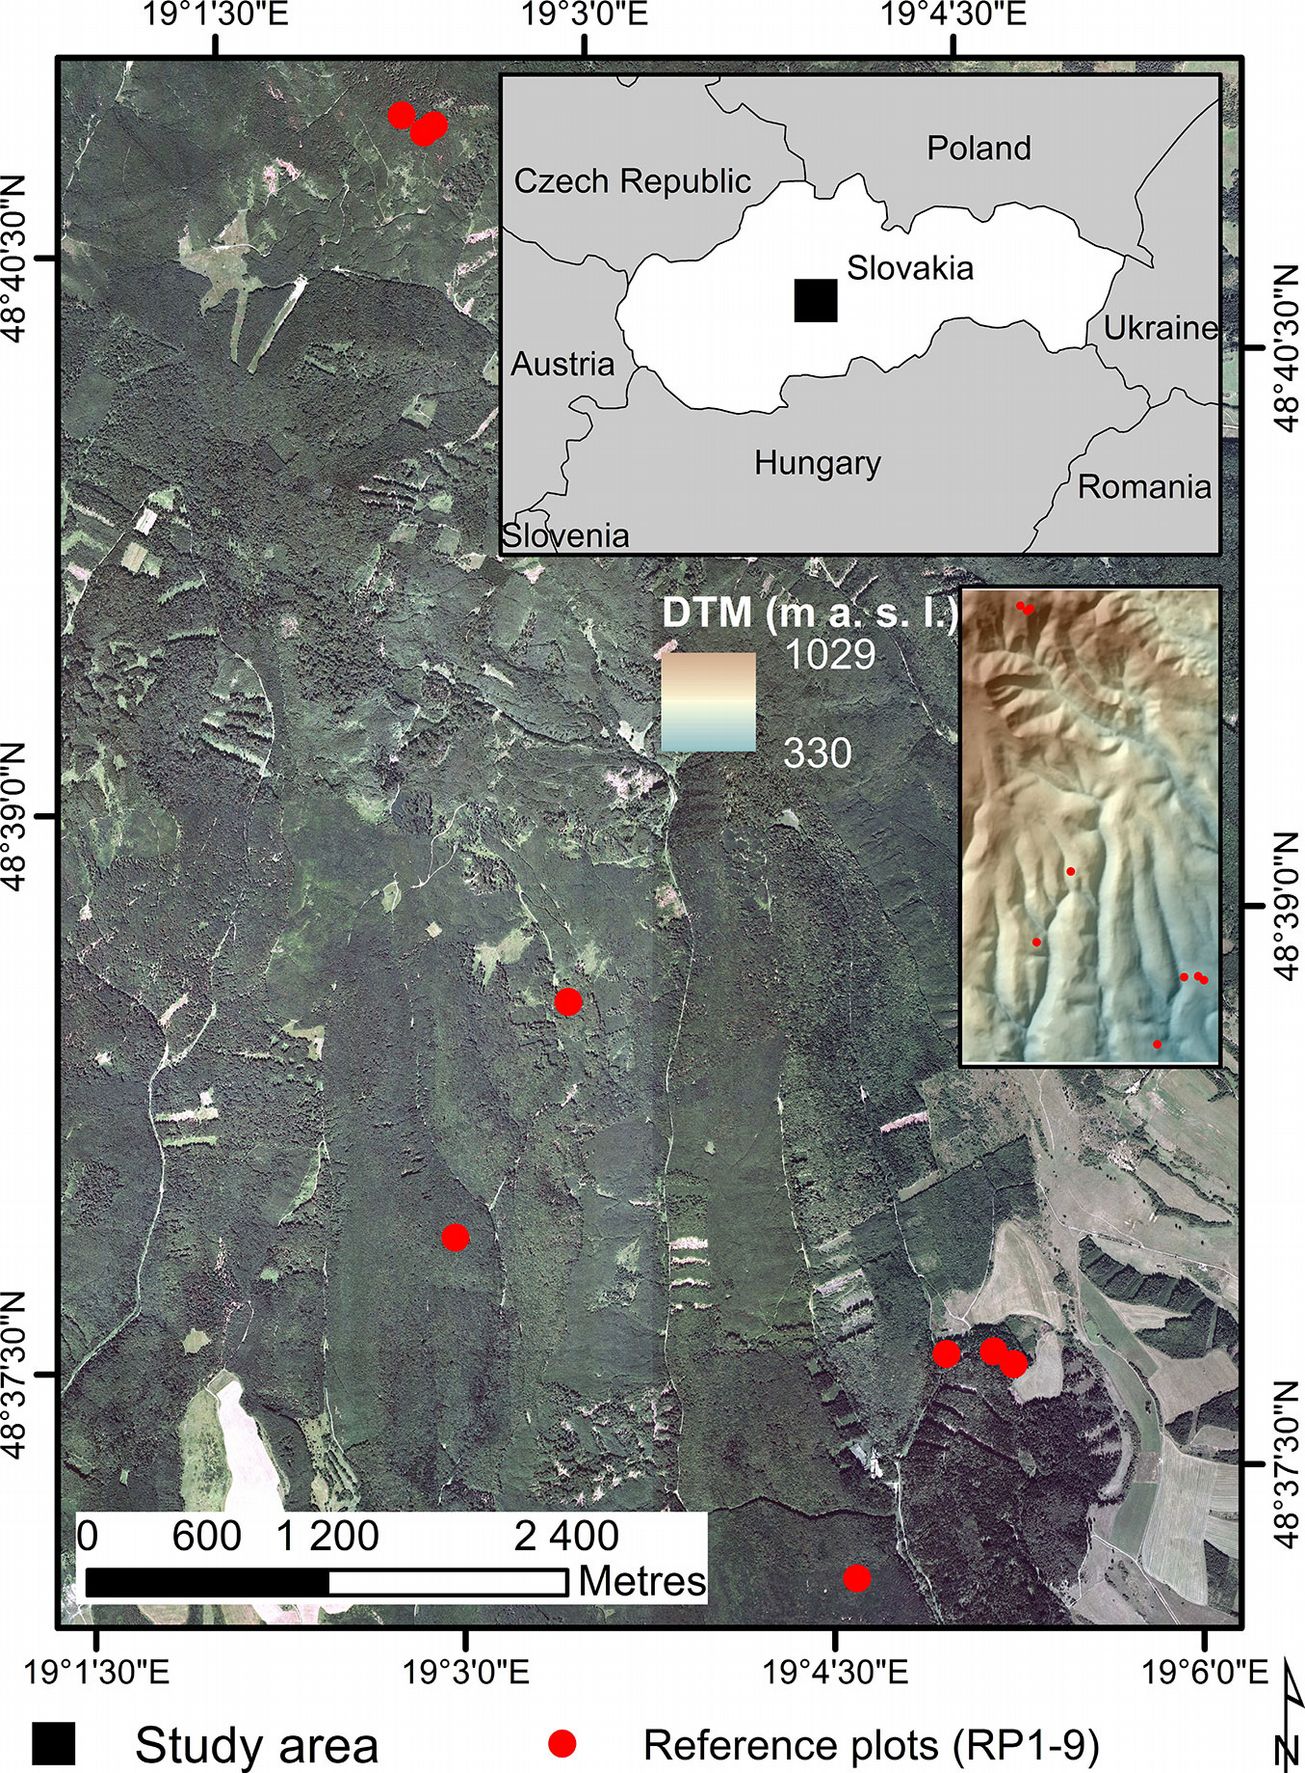
The research was conducted in the Forest Enterprise of the Technical University in Zvolen, central Slovakia (48° 37′ N, 19° 04′ E - Fig. 4). The forest area covers 9964 ha and its prevalent aspects are south, east and south-west. The lowest elevation is at Jalná (280 m a.s.l.) and the highest at the Lavrín peak (1150 m a.s.l.). The territory includes oak, beech-oak, beech, fir-beech and spruce-fir-beech forest vegetation zones.
Fig. 4 - The study area. Elevation and position of the surveyed reference plots (RP1-RP9) are indicated by red circles on the maps.
ALS data
The ALS data used to test the applicability of the presented workflow were acquired in April 2012 using a RIEGL Q680i scanner. The average flying altitude was 700 m. The instrument operated at pulse rate frequency of 320 kHz, with a 122 Hz scan frequency and scan angle of ± 50 degree. The obtained laser data covered the whole study area and had an average density of laser hits of 20 points per m2. From each emitted pulse, a maximum of seven returns were recorded. The point ratios were 56% for the first echo, 21% for the second, 13% for the third, and 10% for other echoes.
Ground reference data
The ground data were obtained by a terrestrial survey in a part of the study area. The survey was carried out in nine reference plots (RP) covering a total area of 3.3 ha (Fig. 4), which represented various relief and stand structure conditions (Tab. 1). The selected RP contained a range of terrain slopes, forest stands at different development stages, and vertical structures.
Tab. 1 - Description of measured stand data in the reference plots (RP).
| Code | Area (ha) |
Number of tree species |
Conifers (%) |
Mean height (m) |
Mean diameter (cm) |
Volume (m3 ha-1) |
Slope (%) |
|---|---|---|---|---|---|---|---|
| RP1 | 0.50 | 6 | 8 | 26.67 | 32.55 | 429.16 | 25 |
| RP2 | 0.30 | 6 | 43 | 27.27 | 34.73 | 611.49 | 33 |
| RP3 | 0.25 | 7 | 61 | 26.64 | 37.75 | 446.25 | 5 |
| RP4 | 0.25 | 5 | 73 | 32.72 | 43.57 | 622.12 | 6 |
| RP5 | 0.25 | 3 | 1 | 26.91 | 26.68 | 584.45 | 37 |
| RP6 | 0.25 | 3 | 80 | 27.31 | 44.31 | 617.80 | 22 |
| RP7 | 0.25 | 5 | 50 | 23.70 | 36.60 | 508.44 | 22 |
| RP8 | 1.00 | 6 | 75 | 28.59 | 43.37 | 507.18 | 25 |
| RP9 | 0.25 | 1 | 0 | 29.20 | 35.98 | 456.33 | 22 |
| Total | 3.30 | 11 | - | - | - | 4783.22 | - |
| Average | 0.37 | 5 | 43 | 27.67 | 37.28 | 531.47 | 22 |
Most tree species occurring in the region were represented in the RPs. The species composition was dominated by Norway spruce (Picea abies L. Karst) with 42% coverage. Other conifers are Silver fir (Abies alba Mill.) with 13% and European larch (Larix decidua Mill.) with 0.1% coverage. Non-conifer species covered less than 45% of the forest area, and were dominated by European beech (Fagus sylvatica L.) with 34%, Sessile oak (Quercus petraea Matusch) with 6%, European hornbeam (Carpinus betulus L.) with 3% coverage, and other deciduous trees, which occurred in less than 2% of the forest area.
The crown canopy closure in the RP was between 78% and 100%. Almost 70% of the measured trees were situated in the main crown level (co-dominant trees, constituting the main canopy), 20% belonged to the upper level (dominant trees higher than the main canopy level) and 10% to the lower level (intermediate and suppressed trees lower than the main canopy).
A total of 1322 trees with diameter ≥ 7 cm were measured for position, species, height and diameter. The crown coverage in each RP was estimated as the proportion of forest floor covered by the estimated vertical projection of tree crowns.
Accuracy assessment
An accuracy assessment was carried out by comparing the ground reference data (TERj) with outputs derived from the ALS data using the method described above (ALSj). The accuracy of both individual trees detection and crown coverage delineation was evaluated for three tile sizes - 1×1 m (TS1), 2×2 m (TS2) and 3×3 m (TS3).
Differences were calculated between ALSj and TERj and the mean difference (eqn. 6 - see below) used as an indicator of systematic error (i.e., of under- or overestimation), and tested for significance. First, the normality of difference distribution was tested using the Shapiro-Wilk W test to allow for a proper selection of the statistical test. If the differences were normally distributed, the Student’s paired t-test was used (α = 0.05) with f = m-1 degrees of freedom (mean difference test). If the differences were not normally distributed, the non-parametric paired Wilcoxon test was used (α = 0.05) with f = m-1 degree of freedom (median difference test). The random error component (eqn. 7) was used to assess the dispersion of differences around the mean difference. The root mean square error (eqn. 8) was used to aggregate both the systematic and the random error components. The relative e%, se%, RMSE% were calculated as the ratio of their absolute value and arithmetic average of the reference data (eqn. 6, eqn. 7 and eqn. 8).
where e is the mean difference, se is the standard deviation of mean differences, ei is the individual difference, RMSE is the root mean square error, n is the number of observation, xi and hat{x}i are the ground-reference and ALS-derived attributes, respectively for the i-th tree.
The following detection rates were used to assess the ratio of detected individual trees and the reference trees: (i) the extraction rate (ER), as the total rate of detected trees (ALS) in respect to the number of reference trees in RP (TER - eqn. 9):
(ii) the matching rate (MR), i.e., the total rate of matched trees (eqn. 10):
where TP indicates the true positives; (iii) the commission rate (CR), i.e., the total rate of detected trees that could not be matched (eqn. 11):
where FP indicate the false positives; and (iv) the omission rate, i.e., the total rate of reference trees that could not be matched, according to Eysn et al. ([4] - eqn. 12).
where FN indicates the number of false negatives.
Results
The analysis of ground survey data revealed a number of treetops larger than that detected by the ALS-based assessment. Especially in densely forested areas, the detected local maxima do not always represent the exact tree positions, thus the matching rate was low. Trees that were standing alone, coniferous and clearly separated trees in loosely stocked areas were correctly detected in most instances.
Accuracy of individual trees detection
First, we evaluated the extraction and matching rates for the three forest types represented in the reference plots (coniferous, deciduous and mixed forest) and for three tile sizes (TS = 1, 2 and 3 m - Fig. 5). The bar graphs show that the optimal tiling size was 2×2 m (TS2). This resolution produced the highest extraction and matching rates (68 ± 14% and 65 ± 14%, respectively) with acceptable commission and omission rates (4 ± 2% and 35 ± 14%, respectively).
Fig. 5 - Detection rates of extracted (orange colour) and matched (blue colour) individual trees for the reference plots (RP1-9) and for different tile sizes (TS1, TS2, TS3).
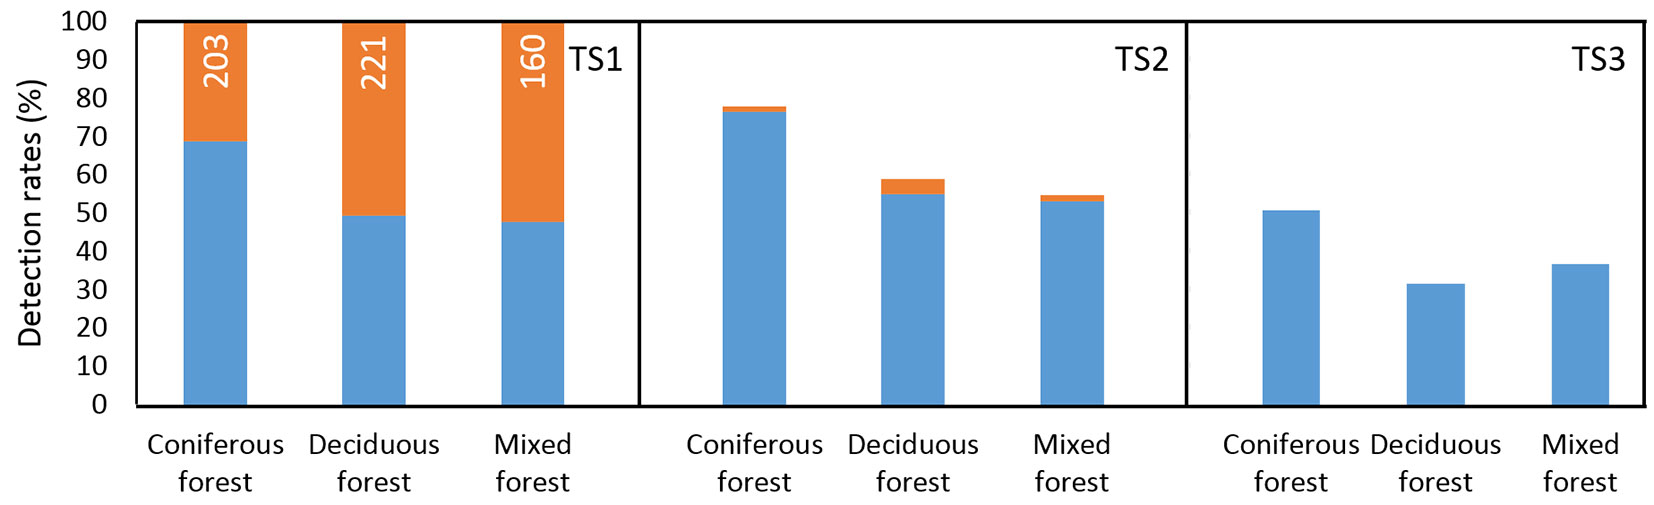
The evaluation of differences in the number of individual trees detected by the proposed method and the number of reference trees on the ground suggested an overestimation using the tile size TS1 and an underestimation using tile size TS2 and TS3. The use of TS2 resulted in the highest accuracy, yielding an underestimation of -34 ± 15%, with a RMSE% of ± 41%. The mean or median paired test confirmed that the differences between number of field-measured and detected trees for each tile size were statistical significant (p<0.05), i.e., the output of individual trees detection was significantly biased (Tab. 2).
Tab. 2 - Differences and paired test between number of reference trees (TERn) and detected trees (ALSn) for different tile size (TS1-3). (e%): relative mean error; (se%): relative standard deviation of mean error; (RMSE%): relative root mean square error; (*): null hypothesis is rejected (p<0.05). Sample size: m=9.
| Compared variables | e% | se% | RMSE% | Normality Test | Paired Test | ||
|---|---|---|---|---|---|---|---|
| W | p-value | t or Z | p-value | ||||
| TERn vs. ALSn_TS1 | 100 | 52 | 118 | 0.802 | 0.022* | 2.666 | 0.008* |
| TERn vs. ALSn_TS2 | -34 | 15 | 41 | 0.931 | 0.486 | 4.299 | 0.003* |
| TERn vs. ALSn_TS3 | -59 | 11 | 68 | 0.837 | 0.053 | 5.315 | 0.001* |
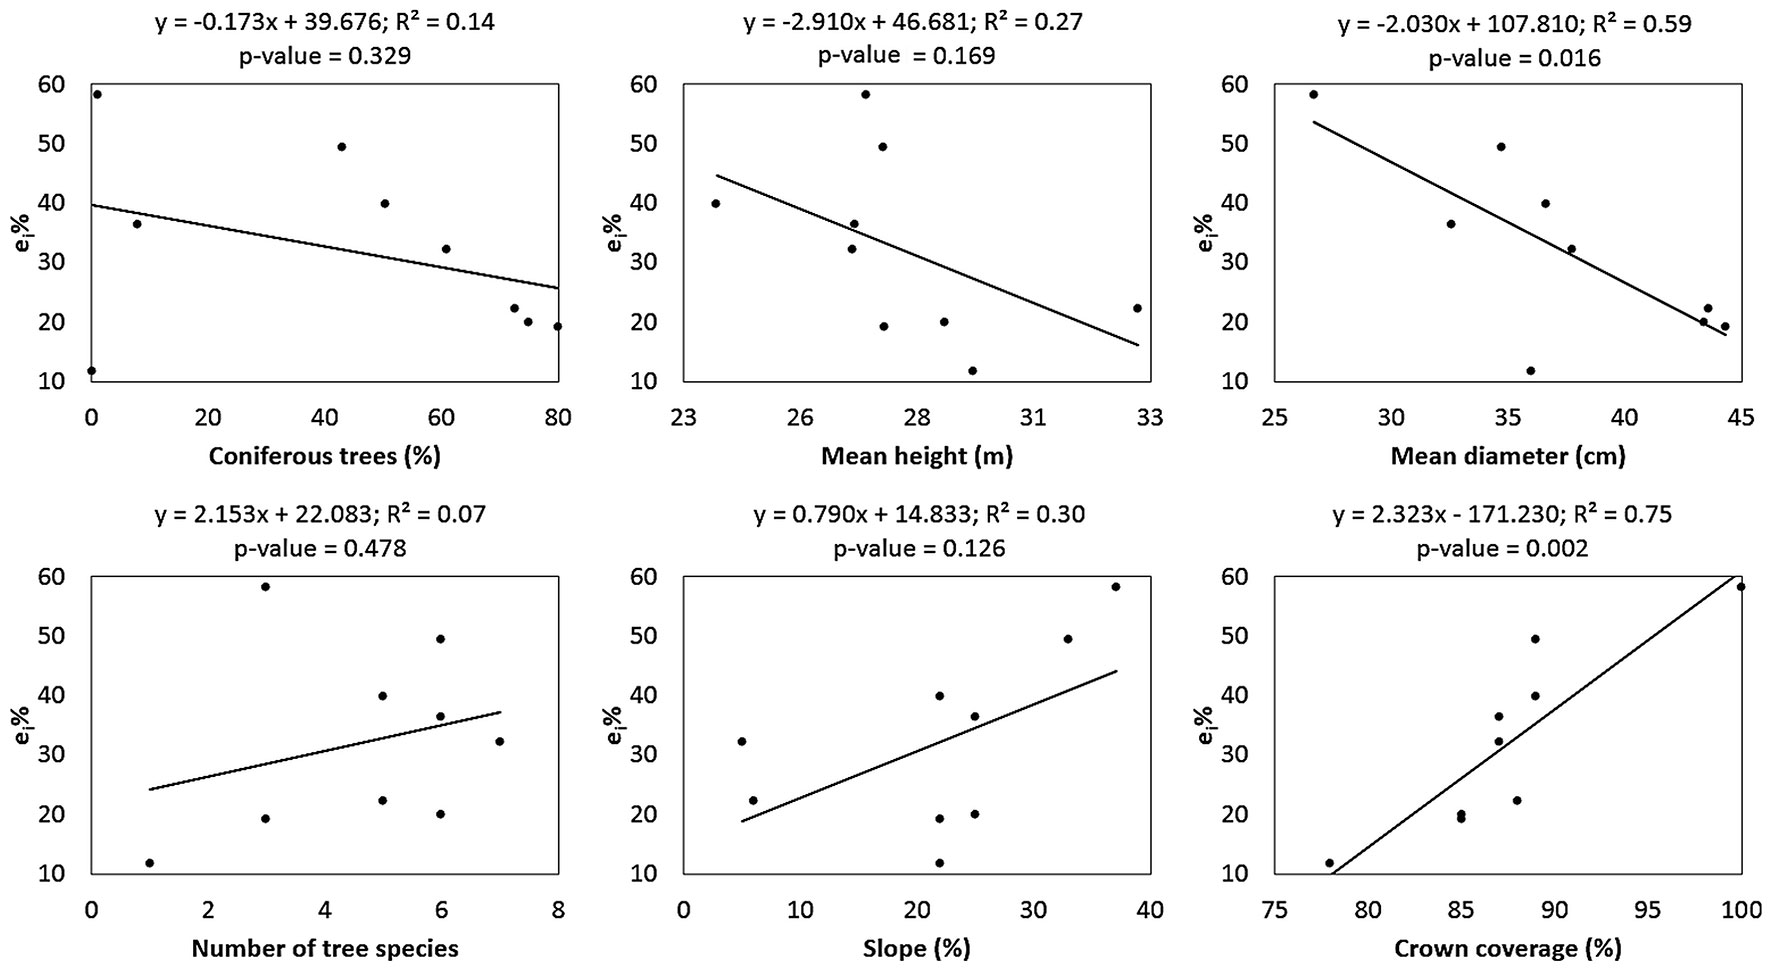
We investigated the effect of the selected stand (in terms of tree species composition, number of tree species, mean height, mean diameter, and crown coverage), and site characteristics (slope) on the quality of the ALS-based tree detection (Fig. 6). A higher accuracy in the detection of individual trees was achieved in stands with a higher share of coniferous trees, as well as in stands with trees of greater dimensions (diameter and height) and higher social levels. A higher accuracy was also achieved in stands characterized by low relief slope, sparse crown canopy, and small number of tree species. However, this trend was significant (p<0.05) only for canopy closure and mean stand diameter. Other parameters did not show any significant effect on the accuracy of tree detection.
Fig. 6 - Regression between selected stand or site characteristics (x-axis) and relative individual difference (y-axis) of treetops detection based on the proposed algorithm in the nine reference plots. The regression functions, coefficients of determination (R2) and F-test of statistical significance of the regression model (p-value) are displayed above each graph.
Accuracy of crown coverage delineation
The crown coverage values obtained using the three alternative tile sizes (TS1, TS2 and TS3) are shown in Tab. 3, which also includes a ground-measured proportion of crown projections of the total area in the reference plots.
Tab. 3 - Reference crown coverage (TERc) and delineated crown coverage (ALSc) for the reference plots (RP1-9) and for different tile size (TS1-3).
| Variables | RP1 | RP2 | RP3 | RP4 | RP5 | RP6 | RP7 | RP8 | RP9 | Average | St. dev. |
|---|---|---|---|---|---|---|---|---|---|---|---|
| TERc (%) | 87 | 89 | 87 | 88 | 100 | 85 | 89 | 85 | 78 | 88 | 6 |
| ALSc_TS1 (%) | 73 | 75 | 78 | 82 | 85 | 76 | 81 | 73 | 80 | 78 | 4 |
| ALSc_TS2 (%) | 85 | 83 | 88 | 90 | 84 | 86 | 92 | 85 | 75 | 85 | 5 |
| ALSc_TS3 (%) | 94 | 91 | 96 | 98 | 97 | 94 | 96 | 93 | 93 | 95 | 2 |
The proposed algorithm underestimated the crown coverage by -11 ± 6% with tile size TS1 and overestimated the crown coverage by 8 ± 6% with tile size TS3. The RMSE% was ± 12% for TS1 and ± 10% for TS3. As it was the case for the number of trees, the TS2 setting provided the best estimate of crown coverage, resulting in a slight underestimation (-2 ± 6%). The RMSE% indicated that the crown cover was estimated with an accuracy of ± 7%. Our analyses confirmed that different tile sizes significantly affect the accuracy of crown coverage delineation as well. At the same time, we found that only the TS2 setting provided the output that matched well with the ground measurements, however, this difference was not statistically significant (Tab. 4).
Tab. 4 - Differences and paired test between reference crown coverage (TERc) and delineated crown coverage (ALSc) for different tile size (TS1-3). (e%): relative mean error; (se%): relative standard deviation of mean error; (RMSE%): relative root mean square error; (*): null hypothesis is rejected (p<0.05). Sample size: m=9.
| Compared variables | e% | se% | RMSE% | Normality Test | Paired Test | ||
|---|---|---|---|---|---|---|---|
| W | p-value | t or Z | p-value | ||||
| TERc vs. ALSc_TS1 | -11 | 6 | 12 | 0.887 | 0.187 | 5.347 | 0.001* |
| TERc vs. ALSc_TS2 | -2 | 6 | 7 | 0.811 | 0.027* | 0.770 | 0.441 |
| TERc vs. ALSc_TS3 | 8 | 6 | 10 | 0.906 | 0.290 | -4.213 | 0.003* |
Discussion
In this study we explored the performance of a newly-developed point cloud-based algorithm for the detection of treetops and the delineation of tree crowns in a temperate mixed forest in Slovakia. We were particularly interested in evaluating the benefits of integrating customizable tree allometry information in the model for the detection of individual tree.
Although the accuracy of the proposed method did not exceed that reported by other researches ([44], [16], [21]), our study involves several innovations which might contribute to improve tree detection from ALD-derived data. In the following sections, we discuss the assets and limits of our results.
Accuracy of tree detection
Our findings indicated that the application of the developed algorithm using optimal settings can correctly capture approximately 65% of all trees in the study area. According to previous studies ([29], [17]), the detection was less successful in stands with higher presence of deciduous species with closed crown canopy, due to their crown morphology with indistinct treetop. On the other hand, the crown projections were delineated with a very high accuracy (-2 ± 6%) and the shape of delineated crowns represented the real 2D crown projection very well.
There are several factors which could have affected the accuracy of tree detection in our assessment, and which should be considered when interpreting our findings. First, the RPs selected for the assessment included a broad range of site condition (including different tree species mixtures, stand density and relief slopes). This allowed the evaluation of the effect of site variables on tree detection accuracy. However, the selected RPs reflected a more complicated stand structure than commonly occurs in the study region, and this could have affected our results. Second, the geo-dendrometric criteria included into the tree position test decreased the number of detected trees, thus increasing the underestimation rate. On the other hand, such criteria reduced the false positive detections, thus preserving the permissible tree and stand structure and generating more realistic stands.
Although the accuracy of the proposed method suggests a limited applicability, the analysis of detected and undetected trees can provide a different perspective. The majority of undetected trees in the RPs had small size which poorly affects the assessment of the total stocking volume. Indeed, our previous research suggested that 32% of the undetected trees in the RPs contained only 11% of the growing stock ([40]). Therefore, when the growing stock volume has to be assessed, an average tree detection rate of 65% might not be thought as limiting the use of the proposed algorithm.
Our results showed that the tile size had significant effect on the detection performance. We expect that testing the effect of a broader range of non-integer tile sizes could greatly improve the accuracy of the method, providing also a better adaptation to different stand structures and scanning densities ([16]). Moreover, the inclusion of tree allometry criteria in the method allow to preserve the permissible stand and tree structure. Such criteria can be significantly improved by considering the specific morphometry of the dominant tree species, age classes and other tree and stand parameters. These parameters can be subjected to calibration based on measured data, thus improving tree detection performance with respect to particular stand conditions or specific mapping objectives.
The scanning density could affect tree detection performances as well. Kaartinen & Hyyppä ([15]), however, suggested that scanning density has a lower effect on tree detection that the extraction algorithm. In this study, we used a density of 20 hits per square meter, and we do not expect that an increase in scanning density could further improve the accuracy of detection of dominant and co-dominant trees. However, a higher scanning density could allow a deeper penetration through tree crowns, thus enhancing the detection of suppressed trees growing under the canopy.
Additional improvement in the accuracy of tree detection can be attained by statistical correction of the results. In this study, a significant underestimation in the number of tree detected was observed and a bias correction could be applied. However, such correction should be applied with caution, particularly when the sample size is small, as it was the case of the current study.
Comparison with other studies
Unlike the proposed method, most studies used a canopy height model (CHM) as input for tree detection algorithms ([18]). Because such approach reduces the size of the initial point cloud, computational time and demands on hardware are reduced as well. On the other hand, part of the information supporting tree detection is lost by transforming the raw ALS data to a CHM. Consequently, a point-based approach was developed which retrieves a part of point cloud data linked with the crown segments, which were extracted from the CHM ([34], [35]), or point cloud is directly used to detect the treetops ([46], [5]). The former approach still requires processing ALS data to derive the CHM, while the latter approach might require time-consuming calculations. The algorithm proposed in this study was developed to compensate for such drawbacks. Specifically, the initial procedures optimize the number of points via tiling and height restriction operations. Subsequently, treetop detection and tree crown delineation are performed using the reduced and tiled point cloud in the original 3-dimensional data structure.
Most of the commonly used algorithms for tree detection from ALS-derived data consider all the local maxima detected as actual trees ([19], [49]). Contrastingly, our workflow applies an additional verification based on the presented geo-dendrometric criteria. Such criteria increase the probability that the local maxima represent real treetops rather than protruding branches, multiple terminals and other morphological patterns of tree crowns.
A distinctive feature of the developed algorithm is the crown delineation procedure. While other authors used mostly the CHM-based crown delineation ([4]), our method detects each crown by gradually adding crown parts to the tree top and testing the match to the required dendrometric criteria at each iteration.
The tree detection accuracy attained in this study (65%) is approximately in the middle of the range of tree detection accuracy (40-93%) reported by Kaartinen et al. ([16]) in an international benchmarking study. Moreover, in this study the accuracy of estimates of crown coverage was high (± 7%), and within the range reported for similar studies (4-22% - [12]). Furthermore, we found that the crowns delineated using the developed algorithm are morphologically similar to the 2D crown projection of field-measured trees. All the above evidences support the applicability of the proposed approach in evaluating forest tree and stand attributes.
Conclusions
ALS-based mapping of forest structure is an innovative component of forest inventory efforts, and has potential to significantly reduce the laborious field works and related costs.
We proposed a new method which integrate tree allometry criteria for detecting individual trees and delineating their crowns using ALS data. The method was validated using 1332 trees from 9 reference plots with heterogeneous stand structures. A significant underestimation rate in the accuracy of tree detection was obtained, while the accuracy of estimates of crown coverage was high and consistent with similar studies. Based on our findings we conclude that ALS-based forest inventory can provide reliable information only in particular stand conditions, specifically in commercial forests with simple structure, while their use in heterogeneous, vertically differentiated forests still remain limited.
The implementation of the proposed algorithm in the freely-available and easy-to-use reFLex software is intended to support a broader use of ALS data and promote new researches aimed at improving the presented tree detection methods.
Acknowledgments
This research was supported by the Slovak Research and Development Agency, in the framework of the projects “Innovations in the forest inventories based on progressive technologies of remote sensing” (APVV-15-0393) and “Innovative methods of close-to-nature forests management” (APVV-0439-12).
References
Gscholar
CrossRef | Gscholar
Gscholar
Gscholar
CrossRef | Gscholar
Online | Gscholar
Online | Gscholar
Gscholar
CrossRef | Gscholar
CrossRef | Gscholar
Authors’ Info
Authors’ Affiliation
Tomáš Hlásny
Tomáš Bucha
National Forest Centre - Forest Research Institute Zvolen, T. G. Masaryka 22, Zvolen, 960 92 (Slovakia)
Czech University of Life Sciences Prague, Faculty of Forestry and Wood Sciences, Kamýcká 129, 165 21 Prague 6 (Czech Republic)
National Forest Centre - Institute for Forest Resources and Information Zvolen, Sokolská 2, Zvolen, 960 52 (Slovakia)
Corresponding author
Paper Info
Citation
Sačkov I, Hlásny T, Bucha T, Juriš M (2017). Integration of tree allometry rules to treetops detection and tree crowns delineation using airborne lidar data. iForest 10: 459-467. - doi: 10.3832/ifor2093-010
Academic Editor
Davide Travaglini
Paper history
Received: Apr 25, 2016
Accepted: Jan 16, 2017
First online: Apr 04, 2017
Publication Date: Apr 30, 2017
Publication Time: 2.60 months
Copyright Information
© SISEF - The Italian Society of Silviculture and Forest Ecology 2017
Open Access
This article is distributed under the terms of the Creative Commons Attribution-Non Commercial 4.0 International (https://creativecommons.org/licenses/by-nc/4.0/), which permits unrestricted use, distribution, and reproduction in any medium, provided you give appropriate credit to the original author(s) and the source, provide a link to the Creative Commons license, and indicate if changes were made.

Web Metrics
Breakdown by View Type
Article Usage
Total Article Views: 57412
(from publication date up to now)
Breakdown by View Type
HTML Page Views: 47187
Abstract Page Views: 3990
PDF Downloads: 4843
Citation/Reference Downloads: 27
XML Downloads: 1365
Web Metrics
Days since publication: 3405
Overall contacts: 57412
Avg. contacts per week: 118.03
Article Citations
Article citations are based on data periodically collected from the Clarivate Web of Science web site
(last update: Jul 2026)
Total number of cites (since 2017): 28
Average cites per year: 2.80
Publication Metrics
by Dimensions ©
Articles citing this article
List of the papers citing this article based on CrossRef Cited-by.
Related Contents
iForest Similar Articles
Research Articles
Integrating area-based and individual tree detection approaches for estimating tree volume in plantation inventory using aerial image and airborne laser scanning data
vol. 10, pp. 296-302 (online: 15 December 2016)
Research Articles
Three-dimensional forest stand height map production utilizing airborne laser scanning dense point clouds and precise quality evaluation
vol. 10, pp. 491-497 (online: 12 April 2017)
Technical Advances
Forest stand height determination from low point density airborne laser scanning data in Roznava Forest enterprise zone (Slovakia)
vol. 6, pp. 48-54 (online: 21 January 2013)
Research Articles
Determining basic forest stand characteristics using airborne laser scanning in mixed forest stands of Central Europe
vol. 11, pp. 181-188 (online: 19 February 2018)
Review Papers
Accuracy of determining specific parameters of the urban forest using remote sensing
vol. 12, pp. 498-510 (online: 02 December 2019)
Research Articles
Optimizing line-plot size for personal laser scanning: modeling distance-dependent tree detection probability along transects
vol. 17, pp. 269-276 (online: 07 September 2024)
Research Articles
Identification and characterization of gaps and roads in the Amazon rainforest with LiDAR data
vol. 17, pp. 229-235 (online: 03 August 2024)
Research Articles
Comparing image-based point clouds and airborne laser scanning data for estimating forest heights
vol. 10, pp. 273-280 (online: 23 February 2017)
Research Articles
Efficient measurements of basal area in short rotation forests based on terrestrial laser scanning under special consideration of shadowing
vol. 7, pp. 227-232 (online: 10 March 2014)
Technical Reports
Remote sensing of american maple in alluvial forests: a case study in an island complex of the Loire valley (France)
vol. 13, pp. 409-416 (online: 16 September 2020)
iForest Database Search
Search By Author
Search By Keyword
Google Scholar Search
Citing Articles
Search By Author
Search By Keywords
PubMed Search
Search By Author
Search By Keyword


