
Different harvest intensity and soil CO2 efflux in sessile oak coppice forests
iForest - Biogeosciences and Forestry, Volume 9, Issue 4, Pages 546-552 (2016)
doi: https://doi.org/10.3832/ifor1773-009
Published: Mar 25, 2016 - Copyright © 2016 SISEF
Research Articles
Collection/Special Issue: IUFRO division 8.02 - Mendel University Brno (Czech Republic) 2015
Coppice forests: past, present and future
Guest Editors: Tomas Vrska, Renzo Motta, Alex Mosseler
Abstract
Soil CO2 efflux accounts for about 45-80% of total ecosystem respiration and is therefore an important part of the ecosystem carbon cycle. Soil CO2 efflux has been poorly studied in forests managed in the ancient coppicing manner. In our study, soil CO2 efflux, temperature, and moisture were measured in sessile oak stands with different harvesting intensity (control: 0% intensity; V1: 75%; V2: 80 %; V3: 85%; and V4: 100%) during the fifth and sixth years after harvesting. Soil CO2 efflux was in the range 2-8 µmol CO2 m-2 s-1 and indicated an increasing pattern with increasing harvesting intensity. The slope of that pattern became less steep from the fifth to the sixth year after harvesting, thus indicating gradual recovery of soil carbon dynamics in the coppiced stand toward the equilibrium state existing before harvesting. Temperature sensitivity of soil CO2 efflux ranged between 2.1 and 2.8, with the lowest values measured in the control stand. Soil CO2 efflux in the control stand was more sensitive to changes in soil moisture than was that on harvested plots. By our calculations, 6.2 tC ha-1 was released from the control stand and 6.2-6.8 tC ha-1 from the harvested stands during the sixth year after harvesting. If mean temperature were to rise by 1 °C, the amount of soil carbon released would increase by 7.7% in the control stand and, depending on harvesting intensity, by 9.0-10.8% in the harvested stands.
Keywords
Low Forest, Soil Moisture, Soil Respiration, Temperature Dependence
Introduction
The increase of the atmospheric concentration of anthropogenic greenhouse gases is recognized as one of the main factors causing global warming during recent decades ([16]). Soil respiration constitutes a predominant part of ecosystem respiration. After photosynthetic carbon assimilation, it comprises the second largest flux of carbon between terrestrial ecosystems and the atmosphere ([34]). Therefore, soil respiration is one of the key determinants of net ecosystem carbon exchange. It is not surprising that much research attention has been devoted to CO2 release from soils, especially with studies interpreting the fate of carbon and evaluating soil as a source or sink of atmospheric CO2 in various ecosystems.
Whether an ecosystem corresponds to a sink or source for CO2 can be estimated from the balance between total net photosynthesis and gross respiration during a given time period. As soil respiration accounts for about 45-80% ([20], [1], [10]) of total ecosystem respiration, it significantly influences temporal (annual and interannual) variability of the net ecosystem carbon balance ([43], [26]). Quantification of soil CO2 efflux is important for understanding the carbon dynamic of terrestrial ecosystems and predicting possible future scenarios.
Forest ecosystems today cover about 44% of Europe’s total area. Soil carbon balance within those ecosystems is predominantly affected by climatic conditions, such as temperature or soil moisture ([15]), and by the developmental stage and management of forests. As forests age, several structural and physiological changes occur that influence soil respiration. Increasing leaf area and gross primary production during forest growth enhance soil CO2 efflux through increased supply of assimilates ([14]). Changes in root density with stand age affect soil CO2 efflux due to the amounts of respiring roots, rhizomicrobial biomass, and dead residua ([8]). Canopy cover and understory plants change the soil’s microclimatic conditions by reducing solar radiation and precipitation reaching the soil surface as well as the amount of litterfall ([35]). The amount and quality of litter affects microbial composition and the decomposition rate of soil organic material ([8], [4]). Different studies have described increase ([25]) and decrease ([37]) of soil CO2 efflux with forest stand age.
Clear-cutting leads to higher rates of soil CO2 effluxes ([23]) and decline in soil carbon stocks ([11]). On the other hand, afforestation increases total soil carbon stocks ([17]). The effects of clear-cutting, afforestation of non-forested areas, and stand age on soil CO2 fluxes have been addressed in several studies. Unlike these effects, the impact of forest management in the ancient coppicing manner on soil carbon fluxes has been poorly studied.
Coppicing is an ancient type of forest management that takes advantage from the vegetative propagation and rapid regeneration of broadleaf tree species when shoots emerge from stumps or roots shortly after the main tree has been cut ([7]). The harvest is usually repeated after a defined time, depending on tree species and site conditions. Compared to trees emerging from seeds, coppiced individuals have roots already established from the previous generation or rotations and therefore grow faster than planted trees ([13]).
In the past coppice management represented a flexible and diverse system and a good source of income that could be adjusted in response to almost annual changes in labor availability and demands for timber, wood and pasture ([31]). The extent and importance of coppicing was changing over time. In the second half of the 20th century, coppicing almost disappeared from many parts of Europe, as the firewood got replaced by the fossil fuels ([39]), and changes in silvicultural practices led to modern forestry ([32]). In some European countries, especially in the Mediterranean region, coppicing still represents an important form of forest management because of the extreme site conditions; for example in Albania (55%), France (47%), Greece (68%), Hungary (29%), Italy (56%), Portugal (37% - [41]), Bulgaria (48%), Croatia (22%), and also Macedonia (60%). In other parts of Europe, most coppice woods have been transformed into high-forests or left to overgrow ([31], [22]). Coppiced trees were often reduced to one or two large trunks (“singled out”), felling cycles were prolonged and canopy structure became more uniform.
In recent years, interest in coppice forest management across some EU countries increases ([29]) and has also indicated the possibility of reintroducing this forest practice for both ecological and economic purposes: as part of nature conservation, where the natural regeneration is compromised by environmental conditions and as a source of sustainable energy ([28]) in countries with limited forest resources for the renewable source of energy.
Coppicing, like other forest management practices, has a significant impact on carbon budget of the forest ecosystem. Due to preservation of root system from the previous generation and according to fast sprout regrowth ability, the response of the ecosystem would differ from the ordinary clear cutting and would be milder. Another open question is the long-term coppice management effect over several rotations on the same site.
The beneficial effects of restoration coppicing are however not guaranteed in all cases. Coppicing can also represent threats to biodiversity by enhancing the spread of ruderal species of native origin or the invasion of aliens ([33]). Problems may be related to environmental changes and also insufficient knowledge on coppicing ([42]).
To correctly evaluate this management, more information about coppices and their ability to sequester carbon under different harvesting practices, forest regrowth and repeating stand rotations is required.
The aims of our study therefore were: (1) to describe relationships between soil CO2 efflux in coppiced sessile oak (Quercus petraea [Matt.] Liebl.) forest stands with different tending intensities and soil properties (temperature, moisture); and (2) to compare soil CO2 efflux among the same coppiced forest stands.
We hypothesized that harvesting will significantly increase soil temperature, soil moisture and soil CO2 efflux. Moreover, we expected no significant differences in the studied parameters among the harvested variants.
Materials and methods
Study site
The studied forest, located 2 km southwest from Sobesice in South Moravia (Czech Republic - 49° 14′ 43″ N, 16° 35′ 60″ E), has been managed with a lower coppiced layer and a higher one of seed origin. The stand was 76 years old in 2013 and predominated by sessile oak (Quercus petraea - 96%). Stand density was 716 trees ha-1 growing on Cambisol (FAO). Annual mean temperature of the site is approximately 7.5 °C and annual mean precipitation is 550-560 mm.
Soil CO2 efflux measurements were performed in the undisturbed stand and in coppiced stands during the fifth and sixth years after tree harvesting (2008) on a square of 4 ha. The square was divided into 16 plots, each 50 × 50 m with four different harvest intensities, where the number of remaining trees was as follows: V1 at 176 trees ha-1; V2 at 139 trees ha-1; V3 at 97 trees ha-1; V4 was clear-cut. The control plots (VC), established in the undisturbed part of the stand at the northwestern edge of the harvested plots, had 716 trees ha-1. The design and characteristics of the plots are presented in Fig. 1 and Tab. 1.
Fig. 1 - Design of the studied area with different harvesting intensities: control (VC), 716 trees ha-1; V1, 176 trees ha-1 (subplots 2, 4, 10, 12); V2, 139 trees ha-1 (subplots 6, 8, 14, 16); V3, 97 trees ha-1 (subplots 5, 7, 13, 15); V4, clear-cut (subplots 1, 3, 9, 11).
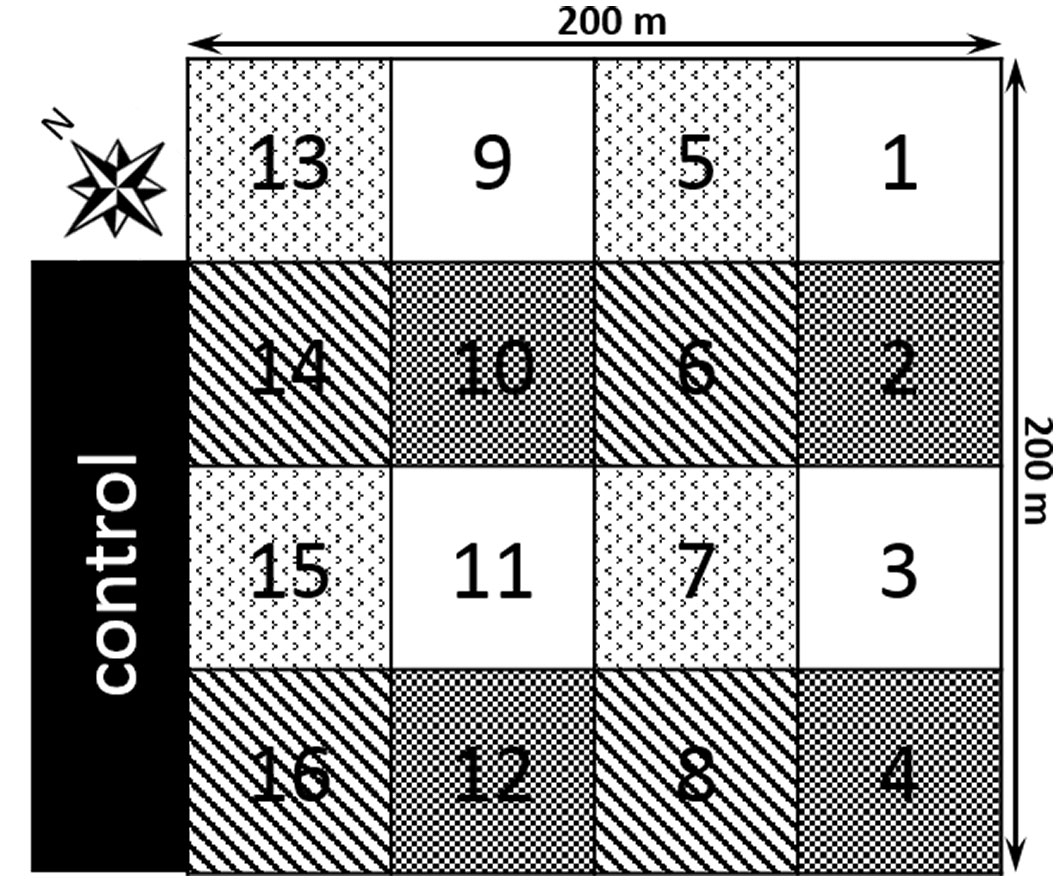
Tab. 1 - Characteristics of the studied subplots with four different harvest intensities designed according to scheme presented in Fig. 1.
| Plot number | Variant | Stems before harvesting (n ha-1) |
Stems after harvesting (n ha-1) |
Harvesting intensity (%) |
|||
|---|---|---|---|---|---|---|---|
| Avg | SD | Avg | SD | Avg | SD | ||
| 2, 4, 10, 12 | V1 | 768 | 91.6 | 176 | 17.2 | 77 | 4.8 |
| 6, 8, 14, 16 | V2 | 704 | 52.0 | 139 | 7.2 | 80 | 1.2 |
| 5, 7, 13, 15 | V3 | 688 | 128.8 | 97 | 9.6 | 86 | 1.7 |
| 1, 3, 9, 11 | V4 | 700 | 74.4 | 0 | - | 100 | - |
Soil CO2 efflux, soil temperature and soil moisture measurements
Measurements were performed during the 2013 and 2014 growing seasons. In the middle of each plot, three measurement positions were established at a distance of 8 m each other. In the control plot, four groups of three positions were set. In this arrangement, 12 positions for each variant with three iterations per sample were measured.
Measurements of soil CO2 efflux on all plots were performed on the following dates: 21 May, 20 June, 1 August, and 5 September 2013 and 18 April, 21 May, 17 June, 8 August, 18 September, and 30 October 2014. The measurements during each day took approximately 4 h, from 9:00-13:00 and were performed in conditions without rain, following the same order each time. In total, 180 measurements were performed in all variants/harvesting intensities.
One month before the first measurement in both years, PVC collars 20 cm in diameter were installed 3 cm into the soil at each position. The green parts of plants were gently removed from the measurement position. Soil CO2 efflux measurements were performed using a Li-8100® portable system (Li-Cor, Lincoln, NE, USA) with a 20 cm survey chamber. After the chamber closed, a period (dead band) of 15 s was set to allow steady mixing of the air in the chamber. During the following 60 s, CO2 concentration was measured repeatedly at 1 s intervals and a linear approach was used to calculate soil CO2 efflux. During each measurement, soil temperature at 1.5 cm (TPD32 penetrate thermometer®, Omega, Stamford, CT, USA) and soil moisture in the 0-6 cm profile (ThetaProbe ML2x®, Delta-T Devices, Cambridge, UK) were measured 5 cm distant outside the collar at three points for each measurement position.
Data analysis
In 2014, mean soil CO2 efflux (Rm) measurement was correlated with mean soil temperature (Tm), separately for each treatment, using the following exponential equation (eqn. 1):
with α and β as the regression coefficients.
The proportional change in CO2 efflux in relation to a 10 °C increase in temperature, known as Q10, was calculated according to Lloyd & Taylor ([21] - eqn. 2):
with α being the regression coefficient from eqn. 1. Q10 was calculated individually for each harvest intensity (VC and V1-V4) in 2014 except for the date 17 June 2014, at which time CO2 efflux was influenced by severely limited soil moisture. Q10 was not calculated during 2013 measurements because of insufficient temperature range. Soil CO2 efflux was normalized for the temperature 10 °C (R10) according to the following equation (eqn. 3):
where RS is the soil CO2 efflux and TS the soil temperature measured at each position. For normalization of soil CO2 efflux on 17 June, Q10 was set at 1.2, in accordance with Yuste et al. ([46]).
A nonlinear model for the dependence of R10 on soil moisture was used. R10 was assumed to follow a sigmoidal function ([9]) of soil moisture (SWC) as follows (eqn. 4):
To evaluate the trend of the tending impact on soil CO2 efflux, the treatments were ordered from VC over V1 to V4 and values from 1 to 5 were assigned to them on the x-axis. The corresponding means of soil CO2 efflux were plotted on the y-axis. Finally, the slope from VC to V4 was calculated from the linear fit.
Mean soil temperature, soil moisture and soil CO2 efflux from three positions was calculated for each plot, therefore four values were obtained for each treatment on each date.
To test differences in soil temperature, soil moisture and soil CO2 efflux over two experimental years, a two-way repeated measures ANOVA was applied with treatment and date of measurement as factors. Statistical significance of the analysis was tested at the level of probability α=0.05.
To confirm permanency of the impact of thinning on soil CO2 efflux over two experimental seasons, differences in mean soil CO2 efflux of VC (treatment without thinning) from soil CO2 efflux of individual treatments with thinning (V1-V4) were calculated for each measurement day. The differences for each treatment (V1-V4) were compared to zero by applying a t-test. Significance level was set to α = 0.05 and Bonferroni’s correction for multiple testing was applied.
Statistical analyses were performed using SigmaPlot® 11.0 analytical software (Systat Software, San José, CA, USA).
Results
Mean soil temperature from all positions during soil CO2 efflux measurements ranged from 20.2 ± 2.6 to 27.1 ± 2.4 °C in 2013 and from 9.3 ± 1.1 to 20.9 ± 1.9 °C in 2014, with maxima occurring in the middle of the season.
Two-way repeated measures ANOVA confirmed the statistically significant interaction between treatment and date of measurement. Significant differences among the treatments was, however, found only in May and August 2013 (Fig. 2).
Fig. 2 - Soil temperature at a depth of 1.5 cm (a), soil moisture at a depth of 1-6 cm (b), and soil CO2 efflux (c) during the 2013 and 2014 growing seasons in the control plots (VC) with 716 trees ha-1 and the harvested plots V1 (176 trees ha-1), V2 (139 trees ha-1), V3 (97 trees ha-1), and V4 (clear-cut). The points show mean values with standard deviation indicates by the bars. The small letters indicate statistically significant differences (p<0.05) among the treatments within measurement dates for soil temperature and moisture; for these variables, significant interaction between treatment and date of measurement was confirmed by two-way repeated measures ANOVA.
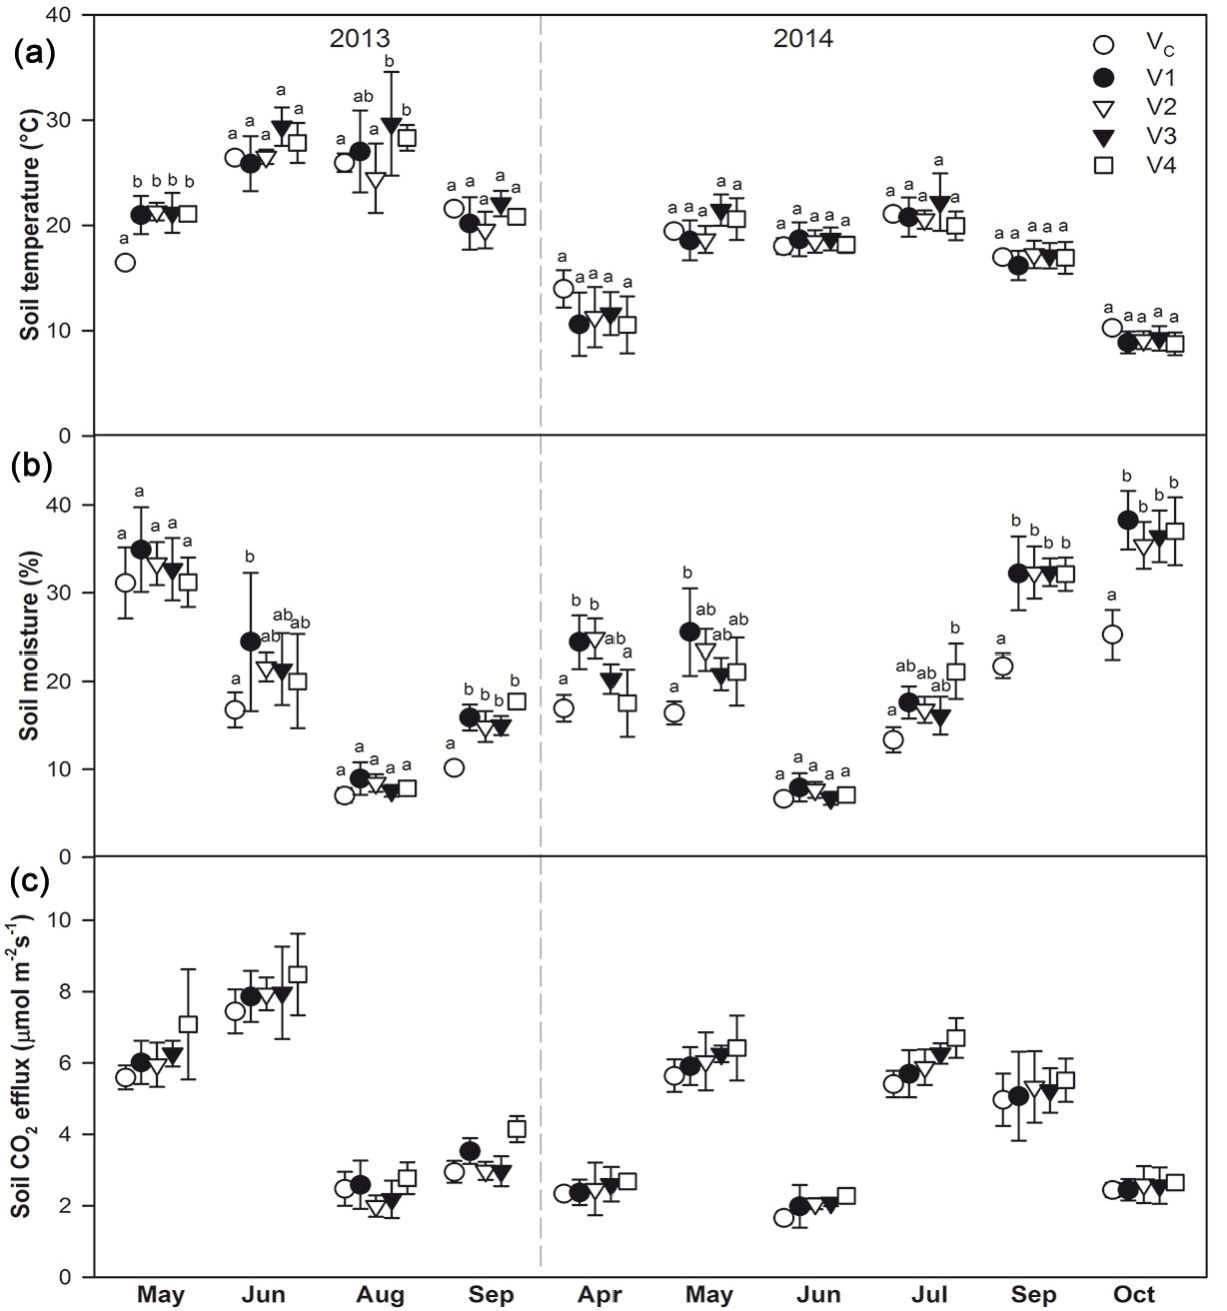
In 2013, mean soil moisture calculated from all positions was the highest in May, reaching 32.5 ± 5.0%. It then decreased to 8.0 ± 1.7% in August and then increased slightly until the last measurement (14.7 ± 3.2%). In contrast, during 2014 the highest soil moisture was measured in the autumn (reaching 34.7 ± 6.3% in October), while the lowest value was detected in June (7.2 ± 1.4%).
Soil moisture proved significant interaction between treatment and date of measurement. Soil moisture in VC was in most cases the lowest out of all treatments. Detailed results of statistical analyses are shown in Fig. 2.
Soil CO2 efflux followed the pattern of soil temperature, with the highest values occurring in summer when the mean values from all positions reached up to 8.0 µmol CO2 m-2 s-1 (Fig. 2). Exceptions were the days when soil moisture was low, especially in August and September 2013 during the long-term period of drought and also in June 2014.
Soil CO2 efflux did not proved significant interaction between treatment and date of measurement. Subsequent Tukey’s post-hoc test confirmed the significant difference between VC and V4 (Tab. 2).
Tab. 2 - P and F values of the two-way repeated measures ANOVA testing differences in soil CO2 efflux among five treatments and p-values of all pairwise multiple comparison procedures (Tukey’s test). Asterisks indicate significant differences between two treatments (p<0.05).
| ANOVA Results | Pairwise multiple comparison | |||||
|---|---|---|---|---|---|---|
| Param | Value | Plots | V1 | V2 | V3 | V4 |
| F | 3.4 | VC | 0.777 | 0.816 | 0.521 | 0.017* |
| P | 0.035 | V1 | - | 1.000 | 0.991 | 0.161 |
| - | - | V2 | - | - | 0.983 | 0.142 |
| - | - | V3 | - | - | - | 0.321 |
Mean soil CO2 efflux showed an increasing pattern with increasing harvesting intensity (from VC through V1 to V4) during most of the measurement dates. The mean differences of soil CO2 efflux in VC from soil CO2 efflux in individual treatments (V1-V4) amounted 0.19 ± 0.14, 0.21 ± 0.28, 0.36 ± 0.35, 0.62 ± 0.32 for V1, V2 V3 and V4, respectively, and it increased from V1 to V4. Analyses confirmed that the differences for V1, V3 and V4 were significantly higher than zero (p ≤ 0.001). P-value for V2 reached 0.068. When measurements in August and September 2013, when long-term drought severely limited soil CO2 efflux and suppressed the effect of other factors, were excluded, the mean differences reached values of 0.19 ± 0.11, 0.32 ± 0.15, 0.49 ± 0.24 and 0.64 ± 0.29 for V1, V2 V3 and V4, respectively, and the significant difference from zero was confirmed for all treatments V1-V4 (p > 0.001).
The slope of the increasing curve changed during the studied years: in 2013 the values ranged between 0.21 and 0.23 µmol CO2 m-2 s-1, while during 2014 they ranged from 0.05 to 0.20 µmol CO2 m-2 s-1, indicating a decrease in carbon release from the soil as the harvesting effect became weaker.
From exponential regression of soil CO2 efflux and soil temperature (Fig. 3), values of Q10 were determined for each treatment as follows: VC = 2.05; V1 = 2.55; V2 = 2.47; V3 = 2.46; and V4 = 2.78. Data from June 2014 were not included because of very low soil moisture (the encircled points in Fig. 3). For June 2014, the Q10 value was set at 1.2 in accordance with Yuste et al. ([46]). Mean R10 from all plots ranged between 1.7 and 2.8 µmol CO2 m-2 s-1 in 2014. The lowest values were measured in June under water stress conditions. R10 increased with rising soil moisture in all treatments. The steepest increase was found for VC (Fig. 4). The regression parameters for the relationship between R10 and soil moisture for each harvesting intensity are presented in Fig. 4 and Tab. 3.
Fig. 3 - Soil CO2 efflux over soil temperature in 2014 in the control plots (VC) with 716 trees ha-1 and the harvested plots V1 (176 trees ha-1), V2 (139 trees ha-1), V3 (97 trees ha-1), and V4 (clear-cut). The encircled points are data from June when soil moisture dropped below 10%; these data were not included into calculation of temperature sensitivity of soil CO2 efflux.
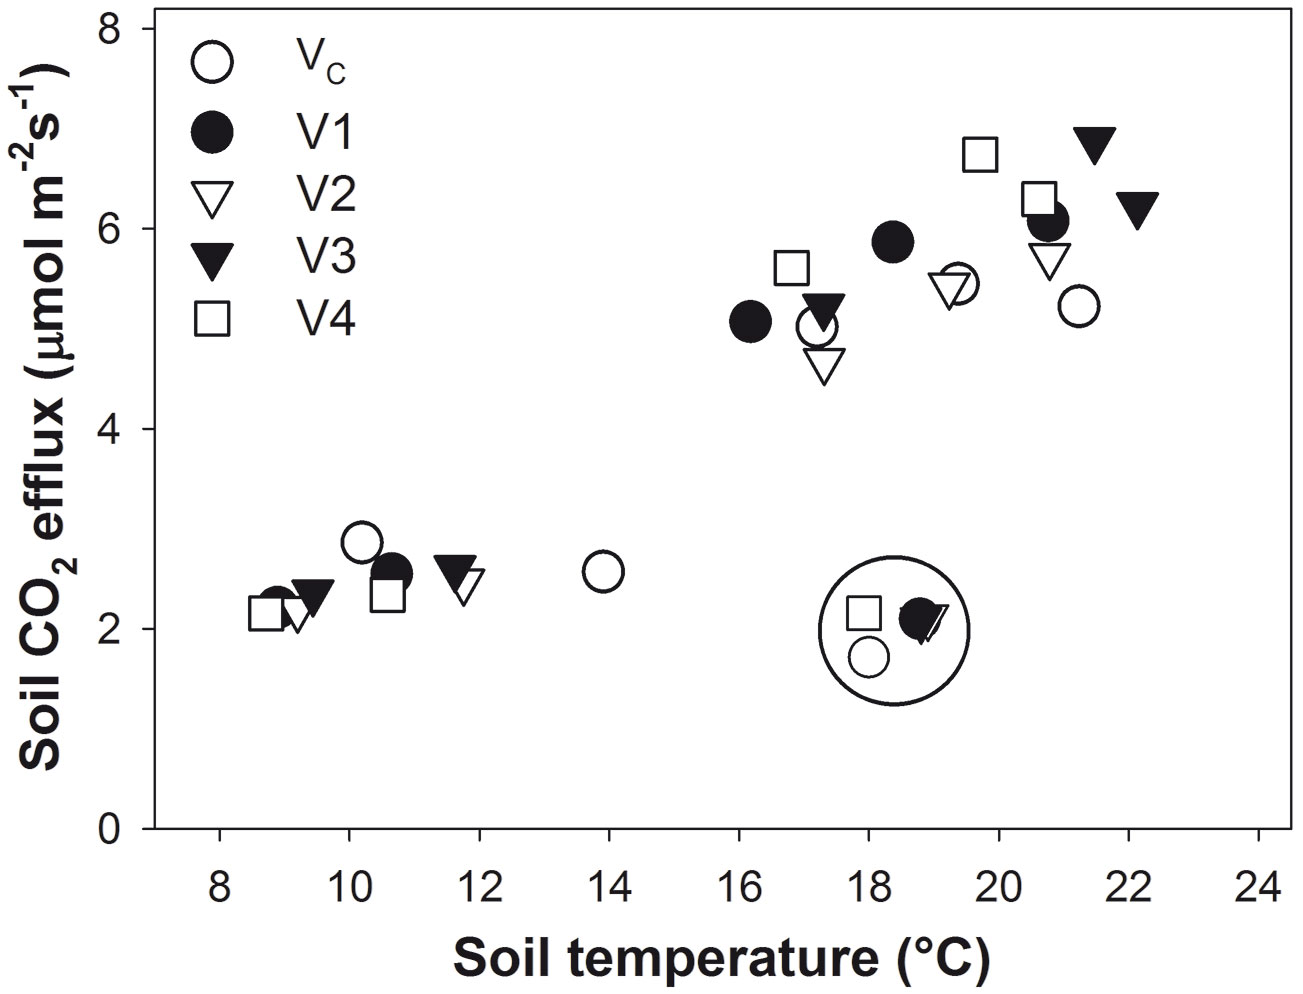
Fig. 4 - Normalized soil CO2 efflux (R10) vs. soil moisture at 1-6 cm depth during the 2014 growing season in the control plots (VC) with 716 trees ha-1 and the harvested plots V1 (176 trees ha-1), V2 (139 trees ha-1), V3 (97 trees ha-1), and V4 (clear-cut) fitted to a sigmoid curve [R10 = a/1+exp(-(SWC-x0)/b))]. The parameters are presented in Tab. 3.
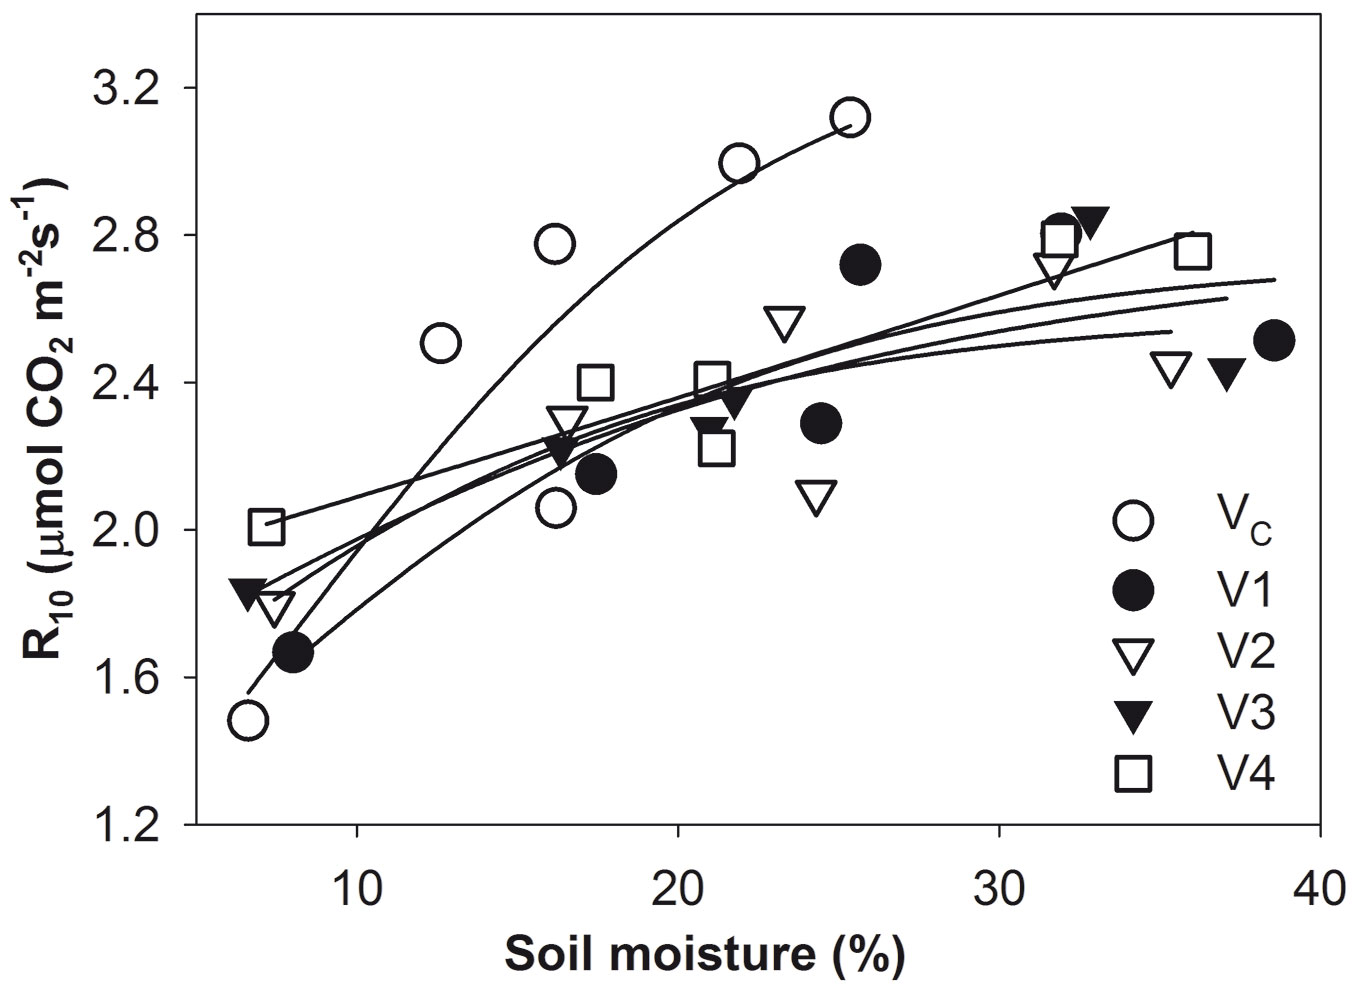
Tab. 3 - The parameters of the sigmoid fit of the relationships between R10 and soil moisture from Fig. 3 [R10 = a/(1+exp(-(SWC-x0)/b))] during the 2014 growing season in the control plot (VC) with 716 trees ha-1 and the harvested plots V1 (176 trees ha-1), V2 (139 trees ha-1), V3 (97 trees ha-1), and V4 (clear-cut).
| Treatment | a | b | x0 | R2 |
|---|---|---|---|---|
| VC | 3.085 | 6.599 | 6.876 | 0.74 |
| V1 | 2.692 | 8.220 | 2.737 | 0.80 |
| V2 | 2.438 | 10.64 | -3.710 | 0.84 |
| V3 | 2.706 | 10.09 | 0.397 | 0.84 |
| V4 | 2.815 | 14.74 | -2.293 | 0.71 |
During the 2014 growing season, mean air temperature at the study site was 15.8 °C (1 May - 31 October) and according to our observations ([5]) was approximately 2 °C higher than was the mean seasonal soil temperature.
By substituting mean seasonal soil temperature, mean (seasonal) R10, and Q10 of each treatment for 2014 into the first equation (eqn. 1), we calculated that approximately 6.25 tC ha-1 was released from the soil at the control stand during the 2014 growing season (May-October). The calculated amounts of carbon released from harvested stands ranged between 6.17 and 6.84 tC ha-1 during the sixth growing season after harvest. If mean air temperature were to increase by 1 °C as a consequence of global warming, the amount of the soil carbon released would increase by 7.7 % in the control stand and by 9.0-10.8% in the harvested stands, depending on harvesting intensity.
Discussion
Seasonal variations in soil CO2 efflux have been observed in almost all ecosystems and often have been associated with changes in temperature, moisture, photosynthate production, and/or their combinations. The main controlling factors may depend on the type of ecosystem and climate. Large spatial variability in soil CO2 respiration results from large variability in such physical properties of soil as soil water content, thermal conditions, porosity, texture, chemistry, biological conditions (e.g., fine-root biomass, fungi, and bacteria), nutrient availability (e.g., nitrogen mineralization), and others (disturbance history and weathering - [12], [8], [19], [45]). Shibistova et al. ([38]) showed a close connection between tree density and soil CO2 efflux in an open boreal forest. Soil CO2 efflux rates in areas in proximity to trees were about double compared with open areas, thus indicating that the developmental stage of trees (e.g., age and height) can explain some of the spatial patterns of soil CO2 efflux in forests.
Canopy removal and exposure to increased solar radiation raise soil temperature in harvested stands, as described by Londo et al. ([23]) and Pang et al. ([30]). Moreover, Mello et al. ([27]) observed increased amplitude range in a harvested stand’s temperature as compared to that of a mature (control) stand. In our study, however, no clear effect of harvesting on soil temperature in the fifth and sixth year after coppicing was confirmed.
Lower soil moisture was detected in the control plot compared to other plots with different harvest intensity, and this confirms the findings reported by Lopez et al. ([24]) and Mello et al. ([27]). The change was caused by removal of the tree canopy and opening of the soil surface to solar radiation, as a consequence of which temperature oscillations increased ([30]).
In several studies, increase in soil CO2 efflux has been observed during the first year after harvest ([23], [40]). According to Raich & Tufekcioglu ([35]), Mello et al. ([27]) and Inclan et al. ([15]), the increase in soil respiration in coppice forests may therefore be attributed to various reasons:
- interruption of the canopy cover resulting in higher soil temperatures and soil moisture, which may induce an increase in microbial respiration;
- decomposition of the woody debris left on the soil surface after harvest;
- increased fine root mortality and decomposition of dead roots after harvest;
- development of a grass or herb ground layer of vegetation and its leaf litterfall and rapid root turnover.
After five years since harvesting, the impact of debris decomposition and increased root mortality can be assumed having vanished. On the other hand, changed soil properties and grass development may have contributed substantially to the increased soil efflux rates.
The effect of harvesting on soil CO2 efflux was confirmed as the efflux remained constantly higher in the harvested plots compare to VC, and the differences of soil CO2 in VC from the individual harvested treatments were significantly higher than zero. Moreover, soil CO2 efflux increased with harvesting intensity from VC through V1 to V4 (Fig. 2).
The steepness of the CO2 efflux increase from VC to V4 declined from the fifth to the sixth year after harvest, thus indicating a gradual return with age of the coppiced stand’s soil carbon dynamics to the state of equilibrium existing prior to harvest. Based on the change in steepness, we may speculate that the effect will wear off within another 5 years such that no difference would be evident between the control and harvested stands.
The recovery of soil carbon balance after harvesting in coppice-type stands may be attributed to the strongly developed root system established during previous rotations, binding of CO2 by rapidly growing aboveground biomass, and transporting of assimilates to the roots ([6]). This constitutes an advantage over sites with pronounced stress conditions due, for example, to soil water content and erosion ([7]). As the established root system preserves carbon for the next generation, the benefits may be evident during its initial developmental stages. This explains why coppice-type management is so effective on extreme sites. If the rotation is too intensive, however, and the carbon stock does not have time to recover, then site conditions may become depleted or even threatened by alien species ([33]).
Temperature is the driving factor behind soil CO2 efflux if it is not limited by high water content in the soil - which results in a lack of oxygen ([18]) - or by low water content ([44]). Because these conditions reduce soil CO2 efflux and its sensitivity to temperature, determination of a single value of Q10 for the entire season can bias the temperature normalization of CO2 efflux. In particular, measuring during periods of low soil water content can cause under- or overestimation of R10 ([5]). Therefore, data from June 2014, when the soil moisture was only 8 %, were excluded from the Q10 calculation. The calculated Q10 was not used to normalize soil CO2 efflux on that date inasmuch as R10 would have been greatly underestimated. On the other hand, neither should the effect of temperature be fully excluded. Although the topsoil (where soil moisture was measured) was dry, the deeper horizons which do not suffer from such drought also contribute to CO2 efflux from the soil surface ([3]). The respiration of these horizons would still be temperature dependent. Therefore, we set the Q10 value equal to 1.2 in accordance with Yuste et al. ([46]), who had determined this value for forest soil under water stress conditions.
In our study, the temperature sensitivity of soil CO2 efflux (Q10) was in the range of 2.05-2.78, and that is comparable with findings from other studies on oak forests ([25], [36]). Q10 was lower in the control plot than it was in harvested plots. That is in accordance with results from Tedeschi et al. ([40]), who found higher Q10 several years after coppicing as compared to older stands. Saiz et al. ([37]) had described a decrease in Q10 with age from a young to mature forest. The difference between the control and harvested plots could be caused by different microclimatic conditions triggered by canopy removal or by different contributions of CO2 sources into total soil respiration, as in our case. As heterotrophic respiration is less temperature sensitive than autotrophic respiration ([2]), we can assume greater contribution of heterotrophic respiration to total soil CO2 efflux on the control plot than in the harvested plots due to the continuous accumulation of organic matter inputs from tree leaf litter ([37]).
Normalized soil CO2 efflux (R10) in VC increased more steeply with increasing soil moisture than it did in the harvested stands. This can be the reason why, despite lower soil moisture in the control compared to the harvested plots, no significant differences between VC and harvested stands was found in the majority of cases.
Conclusions
Coppicing had no impact son soil temperature in the fifth and sixth year after coppicing. On the contrary, the harvesting increased soil moisture in comparison to the undisturbed control forest, because of probable increased throughfall.
Soil CO2 efflux showed significant differences only between VC and V4. However, soil CO2 efflux tended to increase with harvesting intensity from the control to clear-cut plots. The slope of the rising CO2 efflux curve from VC toward V4 became less steep from the fifth to the sixth year after harvesting. On the basis of our results, we assume that in about 10 years after harvesting the soil carbon dynamics of the coppiced stand would return to the balanced stage of the non-harvested stand.
Soil CO2 efflux in the undisturbed stand showed steeper increase with increasing soil moisture compared to the harvested stands. This resulted in small differences in soil CO2 efflux between the control and harvested plots despite the significantly lower soil moisture on the control plot.
The results of this study supported our hypothesis concerning effect of harvesting on soil moisture and soil CO2 efflux, but not the effect on soil temperature. Moreover, differences in soil CO2 efflux among the harvested variants were not as significant as expected.
From the viewpoint of sustainability and soil carbon preservation, the rapid restoration of carbon flux under coppicing points to a seemingly advantageous style of forest management.
Acknowledgements
This work was supported by the Ministry of Education, Youth and Sports of CR within the National Sustainability Program I (NPU I), grant number LO1415 and grant CZ.1.07/2.3.00/20.0267. Authors wish to thank English Editorial services, s.r.o. (Brno, Czech Republic) for revising the English language of this manuscript.
References
Gscholar
Gscholar
Gscholar
Gscholar
CrossRef | Gscholar
Authors’ Info
Authors’ Affiliation
Marian Pavelka
Global Change Research Center, Academy of Sciences of the Czech Republic, v.v.i., Belidla 4a, 603 00 Brno (Czech Republic)
Slovenian Forestry Institute, Večna pot 2, SI-1000 Ljubljana (Slovenia)
Mendel University in Brno, Zemedelska 3, 613 00 Brno (Czech Republic)
Corresponding author
Paper Info
Citation
Darenova E, Cater M, Pavelka M (2016). Different harvest intensity and soil CO2 efflux in sessile oak coppice forests. iForest 9: 546-552. - doi: 10.3832/ifor1773-009
Academic Editor
Tomas Vrska
Paper history
Received: Jul 17, 2015
Accepted: Feb 29, 2016
First online: Mar 25, 2016
Publication Date: Aug 09, 2016
Publication Time: 0.83 months
Copyright Information
© SISEF - The Italian Society of Silviculture and Forest Ecology 2016
Open Access
This article is distributed under the terms of the Creative Commons Attribution-Non Commercial 4.0 International (https://creativecommons.org/licenses/by-nc/4.0/), which permits unrestricted use, distribution, and reproduction in any medium, provided you give appropriate credit to the original author(s) and the source, provide a link to the Creative Commons license, and indicate if changes were made.

Web Metrics
Breakdown by View Type
Article Usage
Total Article Views: 49798
(from publication date up to now)
Breakdown by View Type
HTML Page Views: 40447
Abstract Page Views: 3765
PDF Downloads: 4169
Citation/Reference Downloads: 32
XML Downloads: 1385
Web Metrics
Days since publication: 3746
Overall contacts: 49798
Avg. contacts per week: 93.06
Article Citations
Article citations are based on data periodically collected from the Clarivate Web of Science web site
(last update: Mar 2025)
Total number of cites (since 2016): 15
Average cites per year: 1.50
Publication Metrics
by Dimensions ©
Articles citing this article
List of the papers citing this article based on CrossRef Cited-by.
Related Contents
iForest Similar Articles
Research Articles
Soil respiration along an altitudinal gradient in a subalpine secondary forest in China
vol. 8, pp. 526-532 (online: 01 December 2014)
Research Articles
Seasonal dynamics of soil respiration and nitrification in three subtropical plantations in southern China
vol. 9, pp. 813-821 (online: 29 May 2016)
Research Articles
Soil respiration and carbon balance in a Moso bamboo (Phyllostachys heterocycla (Carr.) Mitford cv. Pubescens) forest in subtropical China
vol. 8, pp. 606-614 (online: 02 February 2015)
Research Articles
Spatial heterogeneity of soil respiration in a seasonal rainforest with complex terrain
vol. 6, pp. 65-72 (online: 07 February 2013)
Research Articles
Thinning effects on soil and microbial respiration in a coppice-originated Carpinus betulus L. stand in Turkey
vol. 9, pp. 783-790 (online: 29 May 2016)
Research Articles
Short-time effect of harvesting methods on soil respiration dynamics in a beech forest in southern Mediterranean Italy
vol. 10, pp. 645-651 (online: 20 June 2017)
Research Articles
Effect of different dolomitic limestone dosages on soil respiration in a mid-altitudinal Norway spruce stand
vol. 12, pp. 357-365 (online: 05 July 2019)
Review Papers
Separating soil respiration components with stable isotopes: natural abundance and labelling approaches
vol. 3, pp. 92-94 (online: 15 July 2010)
Research Articles
The manipulation of aboveground litter input affects soil CO2 efflux in a subtropical liquidambar forest in China
vol. 12, pp. 181-186 (online: 10 April 2019)
Research Articles
Comparison of soil CO2 emissions between short-rotation coppice poplar stands and arable lands
vol. 11, pp. 199-205 (online: 01 March 2018)
iForest Database Search
Search By Author
Search By Keyword
Google Scholar Search
Citing Articles
Search By Author
Search By Keywords
PubMed Search
Search By Author
Search By Keyword


