Spatial heterogeneity of soil respiration in a seasonal rainforest with complex terrain
iForest - Biogeosciences and Forestry, Volume 6, Issue 2, Pages 65-72 (2013)
doi: https://doi.org/10.3832/ifor0681-006
Published: Feb 07, 2013 - Copyright © 2013 SISEF
Research Articles
Abstract
Although numerous studies have been conducted to investigate ecosystem-scale soil respiration, our understanding of this process is still incomplete, especially with respect to the spatial variability and ecological factors that drive such variability in respiration. The present study was conducted to investigate the respiration, structural parameters and soil properties in a seasonal rainforest with complex topography. Specifically, we sampled a 20-ha plot in intervals of 20 m to measure the soil respiration. Based on the entire 20-ha plot, the spatial mean soil respiration rate was 4.09 µmol m-2 s-1 and 2.71 µmol m-2 s-1 during the rainy and dry season, respectively. Strong spatial heterogeneity was observed, with coefficients of variance of 42% and 38% being obtained for the rainy and dry season, respectively. The patch size of soil respiration was approximately 40 m, which was much smaller than that of the soil temperature and water content. Soil-respiration hot spots induced a right-skewed probability density function of soil respiration in space. However, termite mounds did not account for the respiration hot spots. The required number of sampling points in our studied forest was estimated to be 71 and 51 for the rainy and dry season, respectively.
Keywords
Semivariance, Soil Physical and Chemical Properties, Soil-respiration Hot Spots, Stand Structure
Introduction
Soil respiration refers to the flux of root and microbially respired CO2 from the soil to the atmosphere. Soil respiration is a key ecological process that makes ecosystem carbon cycling possible. Soil respiration has been studied for approximately one century ([15]); however, there has been growing concern about soil respiration in recent years ([22], [4]). Indeed, soil respiration is the second largest terrestrial carbon flux, following photosynthesis. Accordingly, small changes in soil respiration will have strong effects on atmospheric CO2 concentration and climate warming. Although numerous studies have been carried out to investigate ecosystem soil respiration, our understanding of it is still limited, especially regarding its spatial variability and related ecological factors.
Most previous studies of soil respiration have tracked temporal variation in one or several small plots. Microclimatic variables (e.g., soil temperature and water content) usually explain most of the observed temporal variation ([8]). However, neither soil temperature nor water content can completely account for the spatial variability of soil respiration (e.g., [37], [30], [33]). Soil respiration shows strong heterogeneity at scales from plants to landscapes ([31], [9]), and its environmental drivers have been found to vary with the experimental design and goals of various studies ([1]). Hanson et al. ([10]) regarded topography as the main factor involved in induction of spatial variation of soil respiration. Measurements in a Canadian boreal forest partly supported this idea and suggested that soil substrate should also be taken into account ([23]). Some studies have emphasized the significance of canopy structure (e.g., root biomass, tree distance, and litter fall amount) on spatial patterns of soil respiration ([29], [11]). Soil microbes and fauna (e.g., earthworms and termites) have also been found to influence the spatial variability of soil respiration ([35], [19]).
Most of the aforementioned studies were conducted in relatively homogenous forests with flat terrain. In this study, we conducted a large-scale (20 ha) series of soil-respiration measurements in a strongly seasonal tropical rain forest with complex topography. Related biotic and abiotic factors, such as the tree mean diameter at breast height (DBH), total root mass (Mroot), litter fall production (Mlf), soil water content at 5 cm (Ms-5), and soil temperature at 5 cm (Ts-5), were also measured to explain the spatial pattern of soil respiration. We expect soil respiration to be strongly spatially heterogeneous in tropical rainforests and that this heterogeneity will be explained by biotic or abiotic factors. The specific objectives of this study were: (1) to provide a large quantity of assessments of spatial heterogeneity; and (2) to identify the factors that drive the spatial patterns of soil respiration.
Methods
Site description
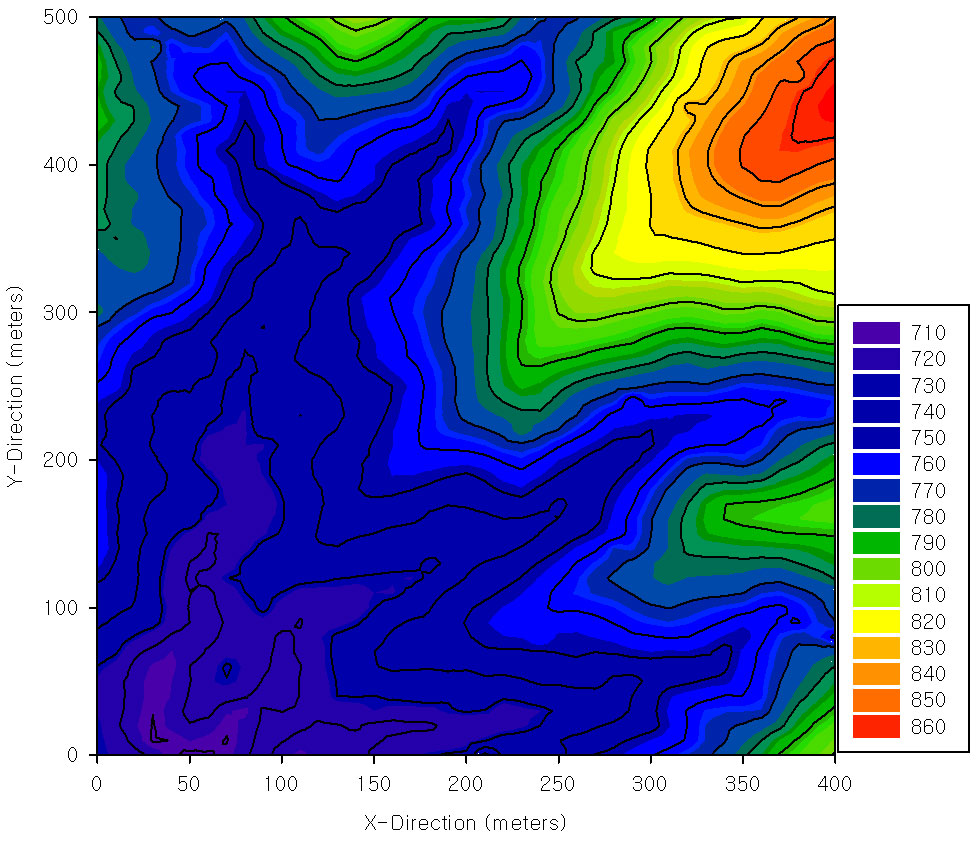
This study was carried out in a 20-ha permanent plot (400 m [north-south] × 500 m [east-west] - Fig. 1) of tropical rainforest in the Xishuangbanna Natural Reserve (101o 34’ 26”-47” E, 21o 36’ 42”-58” N), Yunnan, China. The plot establishment, including topographic mapping (using electronic whole-station theodolites), corner-post setting, and an initial tree census (adopting the techniques developed by the Center for Tropical Forest Science), was started in April 2006 and completed in June 2007. The mean elevation of the plot was 760 m, ranging from 710 m to 860 m. Three small streams pass through the plot.
The climate is dominated by the Indian monsoon cycle. The mean annual air temperature is 21.8 °C, and the total annual rainfall is 1493 mm, approximately 87% of which occurs during the rainy season (May to October - [32]).
The soil in the study area is an oxisol derived from sandstone. The organic matter content of the 0-20 cm mineral soil layer is approximately 20 g kg-1.
The primary vegetation in this area consists of a tropical seasonal rainforest. The forest profile can be divided into five layers. The main layer (>45 m tall) is dominated by Parashorea chinensis H. Wang of the Dipterocarpaceae. The 30-45 m layer is dominated by Sloanea tomentosa (Benth.) Rehd. & E. H. Wils., Pometia tomentosa (Bl.) Teysm. & Binn., and Semecarpus reticulata Lecte. The 20-30 m canopy layer is primarily composed of Garciniacowa Roxb., Ficus langkokensis Drake, and Pseuduvaria indochinensis Merr. Baccaurea ramiflora Lour, while Dichapetalum gelonioides (Roxb.) Engl. dominates the understory (10-20 m). The 5-10 m layer is mainly composed of Pittosporopsis kerrii Craib, Mezzettiopsis creaghii Ridl., Saprosma ternata, Leea compactiflora Kurz, Phoebe lanceolata (Nees) Nees, and Syzygium megacarpum (Craib) Rathakr. & N.C. Nair ([6]). The number of individuals decreased as the DBH increased. Nearly 70 000 individuals (approximately 73% of the total) were in the size class of 1-5 cm. Parashorea chinensis H. Wang ranked second in terms of abundance (8.29% of individuals) and first in the basal area (5.68 m2 ha-1) in the plot.
Soil physical and chemical properties
We divided our 400×500-m plot into grids of 30×30 m, and the 252 generated nodes were considered base points. Together with each base point, two additional sampling points were located at random combinations of 2 and 5 m, 2 and 15 m, and 5 and 15 m along a random compass bearing away from the associated base point. We sampled 500 g of topsoil (0-10 cm) from each sample point and a total of 756 samples were collected. All soil samples were sent to the Central Lab of Xishuangbanna Tropical Botanical Garden at the Chinese Academy of Sciences for chemical and physical analysis.
The pH levels were measured in fresh soil. Briefly, a small sample of soil was collected, and an indicator solution was added to form a paste. The paste was then coated with barium sulfate powder, which changes colour depending on the pH of the soil, and the colours of the powder were compared with a colour chart. The soil samples were subsequently air-dried, crushed, sieved, and packaged for later additional analysis. The corer method was used to determine the soil bulk density ([3]). The soil carbon level was measured using the H2SO4-K2Cr2O7 oxidation method ([18]). The total nitrogen content was measured using the Micro-Kjeldahl method ([17]), while the available nitrogen was estimated using the micro-diffusion method ([26]). The total phosphorus and potassium levels were measured using an inductively coupled plasma atomic-emission spectrometer (Thermo Jarrell Ash Co., Franklin, USA) and HNO3-HClO4 soil solution ([2]). The level of available phosphorus was estimated colorimetrically based on a 0.03 mol l-1 NH4F and 0.025 mol l-1 HCl soil solution ([2]). The available potassium was extracted from a neutral 1 mol l-1 CH3COONH4 solution analysis using the same method as that used for total potassium ([2]).
Stand structural parameters
The DBH of all of the trees was measured and used to calculate the mean DBH of each subplot. We estimated the root biomass using site-specific allometric equations with DBH as an entry variable ([32]). Litterfall was collected with 151 litter traps (1×1 m - placed near the soil-respiration measurement points). Litterfall was collected biweekly for approximately 2 years.
Soil respiration
The soil respiration was measured using a Li-6400 system (Li-Cor Inc., Lincoln, NE, USA), which consisted of an infrared gas analyser and a portable soil chamber (Li-6400-09) with a diameter of 9.5 cm. A polyvinyl chloride collar (diameter of 10.4 cm and height of 7.0 cm) was installed in the forest floor to a depth of ~4 cm. Leaf litter and small branches were left in the collar, while coarse woody debris was removed. The measurements were replicated three times at each sampling point and data collected from 09:00 to 14:00 local time was taken to represent respiration in that day ([28], [36]). Two groups with the same instruments carried out the field work simultaneously to reduce the time required for the field investigation. The soil water content and soil temperature were measured at depths of 5 cm at the same time using a conductivity probe (Theta probe MPM-160B, ICT International Pty Ltd., Armidale, New South Wales, Australia) and a penetration probe inserted into the soil in the vicinity of the collar.
On July 7th 2010, we started the first field campaign to measure soil respiration during the rainy season. A total of 151 of the 500 subplots were selected for soil-respiration measurements (Fig. S1 - Appendix 1). In each subplot, three collars were placed near the litter fall traps. A total of 453 points was sampled; however, because the soil water content often exceeds the field capacity during the rainy season we did not measure the soil temperature and water content in this period. It should be noted that we encountered many termite mounds during the field work; however, none of the litter fall traps were located above a termite mound. Therefore, we selected eight typical large termite mounds for soil-respiration measurements and measured the respiration at 17 points above the selected termite mound.
Several unexpected intensive rainfall events occurred in the 2011 dry season. On February 10th 2012, we started the second field campaign to measure soil respiration during the dry season using the same sampling design used for the rainy season. The diurnal range of temperature and water conditions in the dry season is higher than in the rainy season. To check whether temporal trends could affect the spatial pattern of soil respiration, we measured the temporal variation of the soil respiration, soil temperature and soil water content during the dry and rainy seasons. An automatic soil respiration-measurement system developed by Dr. Naishen Liang of the National Institute of Environmental Studies was used to record the temporal patterns ([14]).
Statistics
The definition of outliers in box plots was introduced to define soil-respiration hot spots in this study. Respiration values larger than the sum of the upper quartiles and 1.5 times the interquartile range were treated as hot spots.
We carried out geostatistical analysis to quantify the spatial structural variance and its range. Semivariance was calculated as follows ([24] - eqn. 1):
where y(i) is the value of the variable y at point i, y(i+h) is its value at a point at a distance h, and N(h) is the number of observation points separated by the distance h. All data were fitted with a spherical model (eqn. 2):
where C0 is the nugget variance, A0 is the range of variance, C is the structural variability, C0+C is a constant, h is the separation distance, and γ is the semivariance.
All statistical analyses were conducted using the SPSS software (SPSS 13.0 Inc., Chicago, IL, USA). One-way analysis of variance (ANOVA) was used to identify differences in the soil respiration between the rainy and dry seasons. Multiple stepwise-regression was used to determine the contributions of different factors (e.g., soil temperature and water content) to the spatial differences in soil respiration. Principal component analysis (PCA) was used to reduce the number of parameters when several parameters reflected the same underlying process.
Results
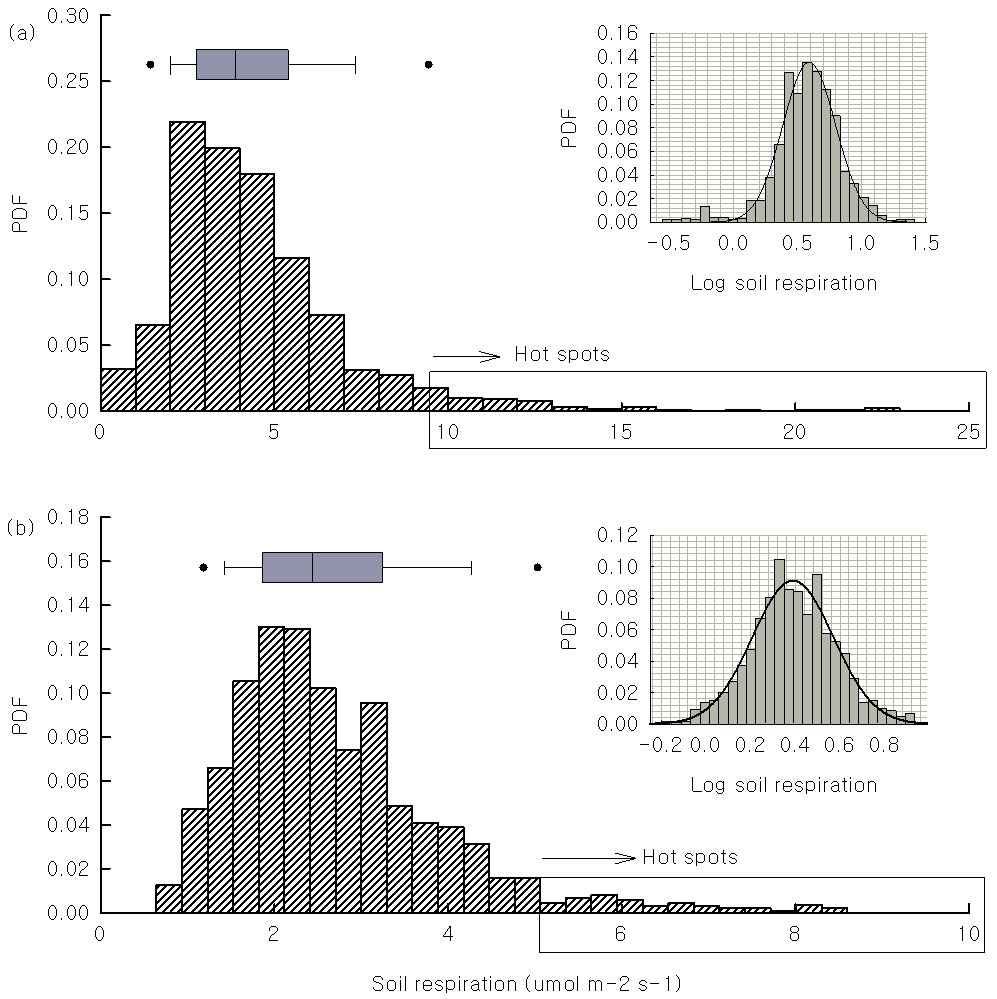
When the entire 20-ha plot was considered, the spatial mean soil respiration was 4.09 µmol m-2 s-1 during the rainy season, which was higher than the median value (3.82 µmol m-2 s-1). This finding reflects the right-skewed probability density function (PDF) of this period (Fig. 2). The spatial mean value of the soil respiration (2.71 µmol m-2 s-1) was also higher than the median (2.53 µmol m-2 s-1) during dry season. The soil respiration differed significantly between the rainy and dry seasons (one-way ANOVA, p<0.001). The skewness was 0.89 during rainy season and 1.27 in the dry season (Tab. 1). The PDF showed a normal pattern after logarithmic conversion in both seasons (Fig. 1 subplots), which allowed us to identify soil-efflux hot spots (values over 9.40 µmol m-2 s-1 during the rainy season and 5.34 µmol m-2 s-1 during the dry season). The PDF of the soil temperature and volumetric water content were both normally distributed, with a skewness of around zero (Tab. 1). The average soil efflux of the termite mounds ranged from 1.63 µmol m-2 s-1 to 3.71 µmol m-2 s-1 (Tab. S1 - Appendix 1). When compared with the mean soil efflux of the entire 20-ha plot during the same period, the soil respiration above the termite mounds was lower.
Fig. 2 - Probability density function (PDF) of the soil respiration in space during the rainy (a) and dry season (b) collected in a 20-ha plot tropical rain forest of Xishuangbanna, China. The black circles in the box plot indicate the statistical outliers. Values larger than the outliers (included in the rectangular box) are respiration hot spots. The right-upper subplot show the log transformed data fitted using a three-parameter Gaussian equation to illustrate a lognormal distribution.
Tab. 1 - Statistical parameters of soil respiration in the rainy season (Rs-rain) and in the dry season (Rs-dry), dry-season soil temperature at 5 cm (Ts-5), soil water content at 5 cm (Ms-5), mean diameter at breast height (DBH), total root mass (Mroot), litterfall production (Mlf), total carbon content (TC), total nitrogen content (TN), total phosphorus content (TP), total potassium content (TK), available phosphorus content (avP), available potassium content (avK), available nitrogen content (avN), pH value (pH), and bulk density (BD). SD is the standard deviation; CV is the coefficient of variance; n is the number of samples. Soil respiration, temperature, and water content are expressed as µmol m-2 s-1, oC, and m3 m-3, respectively. DBH, Mroot, and Mlf are reported as cm, ton dry matter, and g dry matter, respectively. TC, TN, TP, and TK are in g Kg-1. avP, avK, and avN are expressed in mg Kg-1. BD is in g cm-3.
| Parameter | Mean | SD | CV (%) | Skewness | Kurtosis | n |
|---|---|---|---|---|---|---|
| Rs-rain | 4.09 | 1.75 | 42.84 | 0.89 | 2.08 | 151 |
| Rs-dry | 2.71 | 1.04 | 38.58 | 1.27 | 2.09 | 151 |
| Ts-5 | 16.35 | 1.32 | 8.11 | -0.29 | 0.4 | 151 |
| Ms-5 | 0.18 | 0.05 | 27.94 | 0.36 | -0.31 | 151 |
| DBH | 5.69 | 0.98 | 17 | 0.3 | -0.05 | 151 |
| Mroot | 3.57 | 4.16 | 116.36 | 4.17 | 21.6 | 151 |
| Mlf | 23.3 | 6.95 | 29.81 | 0.22 | -0.13 | 151 |
| TC | 18.38 | 5.3 | 28.82 | 2.38 | 13.42 | 756 |
| TN | 1.83 | 0.41 | 22.13 | 1.33 | 5.37 | 756 |
| TP | 0.34 | 0.1 | 29.06 | 1.13 | 2.4 | 756 |
| TK | 11.25 | 3.46 | 30.79 | 0.85 | 1.08 | 756 |
| avP | 4.89 | 6.27 | 128.17 | 5.37 | 41.13 | 756 |
| avK | 181.92 | 89.77 | 49.35 | 2.06 | 7.26 | 756 |
| avN | 180.16 | 41.23 | 22.88 | 1.48 | 6.17 | 756 |
| pH | 4.91 | 0.64 | 13.01 | 0.87 | 0.08 | 756 |
| BD | 1.13 | 0.12 | 10.74 | -0.17 | 1.29 | 756 |
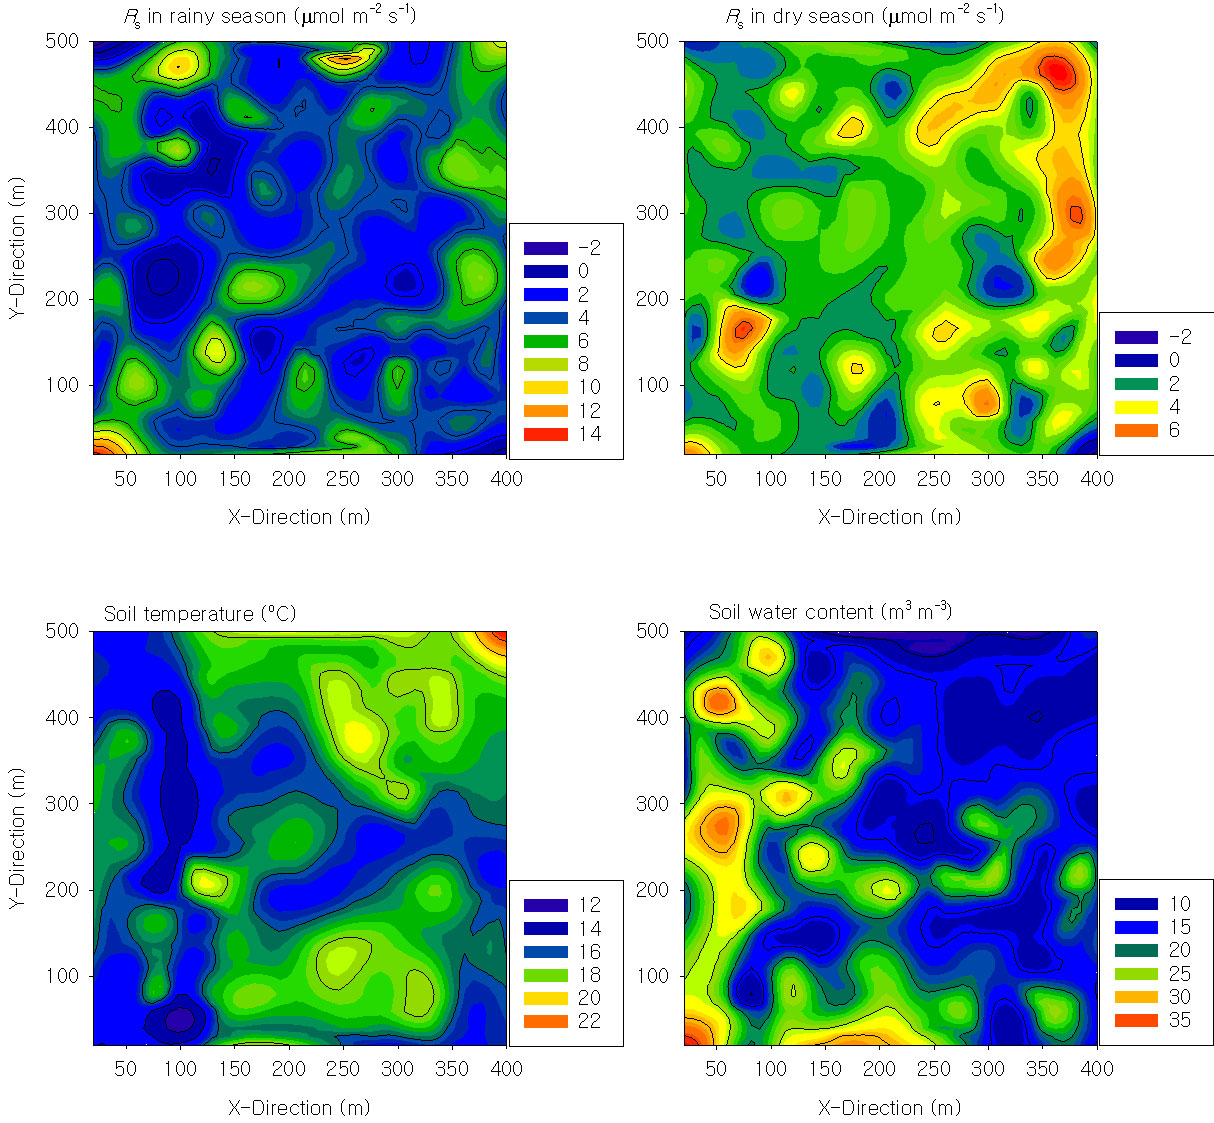
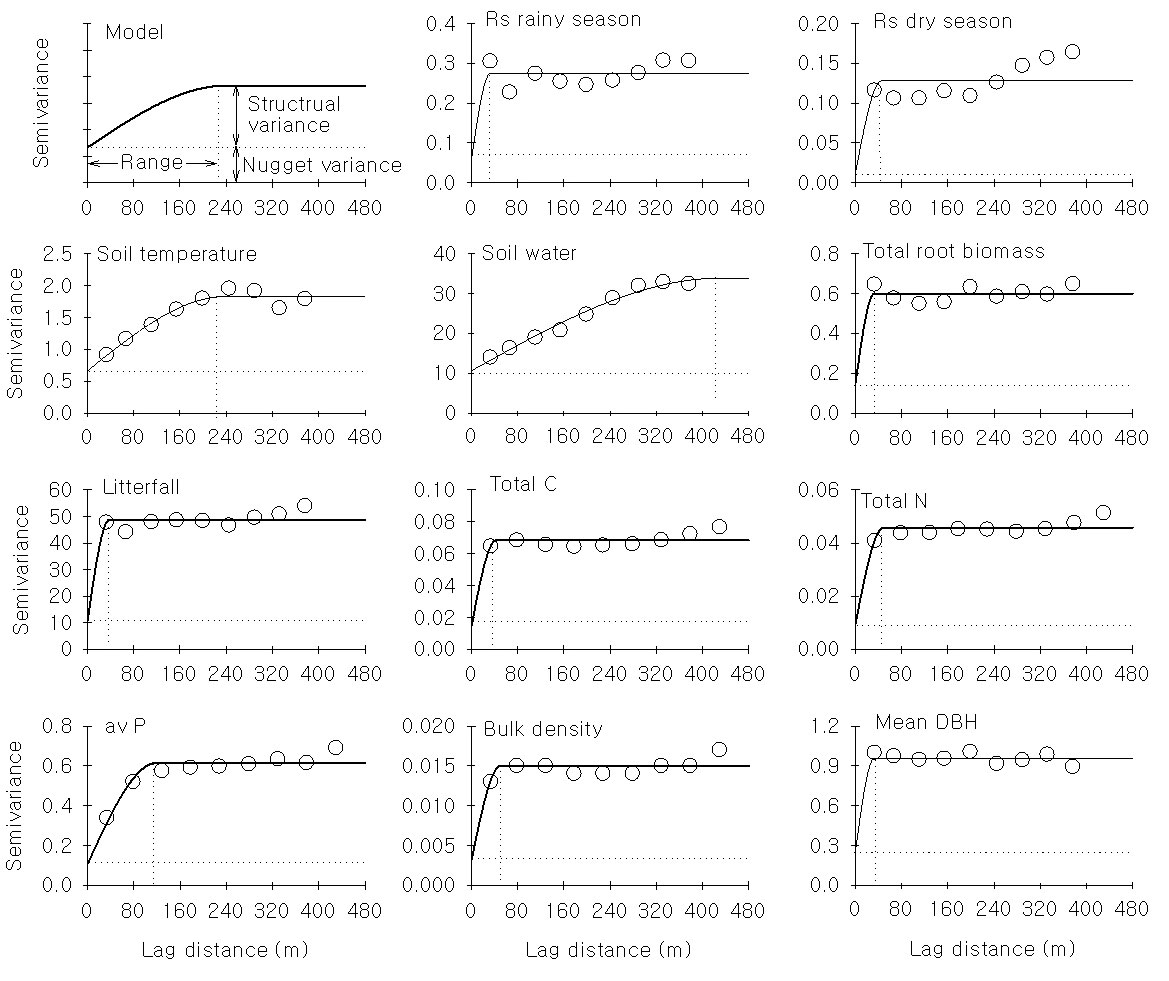
The contour map of the soil respiration showed strong spatial heterogeneity during both the rainy and dry seasons (Fig. 3). The coefficient of variance (CV) of the soil effluxes was higher (38-42%) than that of the soil water content (28%) and temperature (8% - Tab. 1), and this finding was confirmed by semivariogram analysis (Fig. 4). The range of autocorrelation for the soil respiration was 32-45 m, which is far less than that of the soil temperature (240 m) and soil water content (431 m - Tab. 2). These findings suggest that the patches of soil respiration are much smaller than those of soil temperature and water content. The differences in patch size can be illustrated well by a Kriging extrapolation map (Fig. S3 - Appendix 1). The patch sizes of the soil physical and chemical properties (i.e., total carbon and nitrogen content and bulk density) and stand parameters (i.e., mean diameter at breast height and litter fall production) were similar to those of soil respiration and varied between 30 and 50 m, except for that of the available phosphorous (Tab. 2).
Fig. 3 - The contour map of the soil respiration (R s) in the rainy season and in the dry season, soil temperature at 5 cm, and soil water content at 5 cm collected with intervals of 20 m from a 20-ha tropical rainforest plot in Xishuangbanna, China.
Fig. 4 - Variograms for soil respiration and related variables collected from the tropical rain forest of Xishuangbanna, China. A subplot tapped model was used to indicate the meaning of the variogram. The solid line represents the fitted spherical model (details of the fitted parameters were shown in a related table). The dashed line added to illustrate the ratio of the structural variance to nugget variance and the range at which autocorrelation existed.
Tab. 2 - Parameters of the variogram spherical model for soil respiration in the rainy season (Rs-rain) and in the dry season (Rs-dry), dry-season soil temperature at 5 cm (Ts-5) and soil water content at 5 cm (Ms-5), mean diameter at breast height (DBH), total root mass (Mroot), litterfall production (Mlf), total carbon content (TC), total nitrogen content (TN), available phosphorus content (avP), and bulk density (BD). (C0): nugget variance; C/(C0+C): structural variance; (Range): the distance over which the structural variance is expressed; (D) fractal dimension under isotropic conditions.
| Parameter | C0 | C/( C0+C) | Range | D |
|---|---|---|---|---|
| Rs-rain | 0.05 | 0.8 | 32.9 | 1.99 |
| Rs-dry | 0.01 | 0.92 | 45.4 | 1.93 |
| Ts-5 | 0.66 | 0.64 | 240 | 1.85 |
| Ms-5 | 10.62 | 0.69 | 431.9 | 1.81 |
| DBH | 0.25 | 0.74 | 33.1 | 1.99 |
| Mroot | 0.14 | 0.76 | 33.5 | 2 |
| Mlf | 10.3 | 0.79 | 43.4 | 1.98 |
| TC | 0.01 | 0.8 | 43.4 | 1.98 |
| TN | 0.01 | 0.8 | 49.7 | 1.97 |
| avP | 0.11 | 0.83 | 120 | 1.88 |
| BD | 0 | 0.8 | 51.9 | 1.97 |
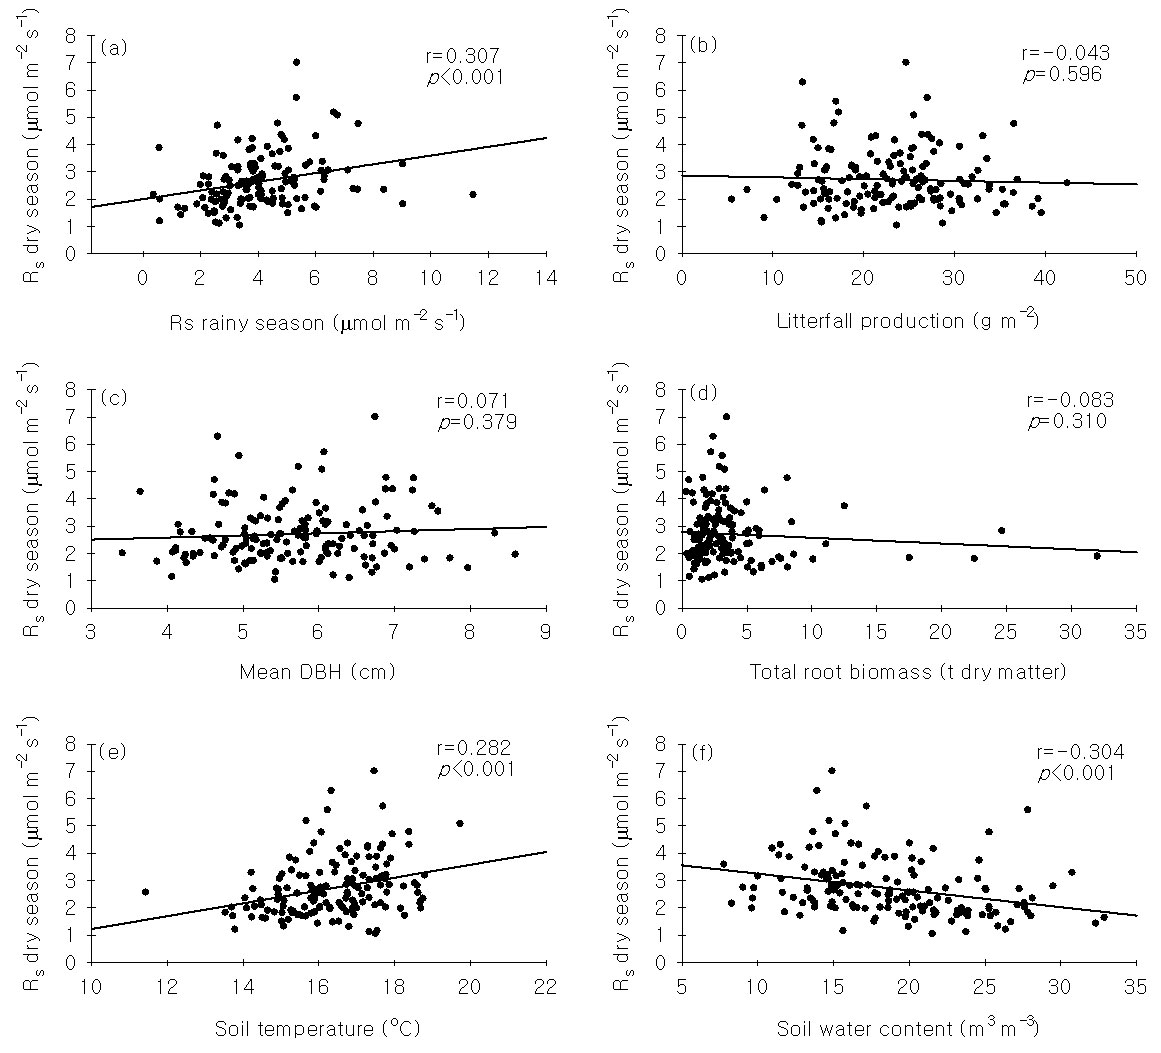
The linear correlation between the soil efflux during the dry and rainy seasons was not as strong as expected, indicating that the spatial pattern changed with time to a certain extent (Fig. 5a).
Fig. 5 - Relationship between soil respiration in the dry season and other related variables in a tropical rainforest of Xishuangbanna, China. The solid line is the linear regression line.
Stepwise multivariate regression rejected all of the studied variables to explain the spatial pattern of the soil respiration except soil temperature (Ts) and water content (Ws) (Rs = 1.018 - 0.042 Ws + 0.151 Ts, r=0.347, p<0.05, n=151). The expected correlation between the stand structural parameters or soil properties and soil respiration was founded on the premise that the respiration measured in three soil collars could represent the 20 × 20 m subplot as a whole. Using PCA, we found that the first principal component (PC1) accounted for 26% of the total variance (Tab. 3). PC1 was a combination of microclimate factors, including the soil temperature at 5 cm and soil water content. The second principal component (PC2) accounted for an additional 22% of the total variance and represented variation in DBH, root biomass and litter fall production (Tab. 3).
Tab. 3 - Results of the principal components analysis. (§): Eigenvectors >|0.30|. Percents reflect the fraction of total variance accounted for by each principal component explained by various components of the PCA.
| Component | PC1 | PC2 |
|---|---|---|
| Eigenvalues | 2.59 | 2.18 |
| Percent | 25.9 | 21.8 |
| Cumulative percent | 25.9 | 47.7 |
| Eigenvectors | - | - |
| Rs-rain | -0.29 | 0.36 § |
| Rs-dry | 0.62 § | 0.08 |
| Ts-5 | 0.80 § | 0.06 |
| Ms-5 | -0.80 § | -0.08 |
| DBH | 0.17 | 0.75 § |
| Mroot | -0.12 | 0.67 § |
| Mlf | -0.16 | 0.60 § |
Discussion
Quantifying the spatial heterogeneity of soil respiration is a challenging matter that is commonly accomplished using the coefficient of variance (CV). Tedeschi et al. ([33]) reported a CV of soil respiration ranging from 31% to ~48% in Mediterranean forests. In a 30 x 30 m plot of a larch plantation, 50 soil-respiration sampling points produced a CV of 28% ([37]). Moreover, a CV of 25% to ~54% was found in a highly heterogeneous beech forest ([29]), while the spatial variability of soil respiration in perhumid Amazonian and Malaysian rainforests was characterized by a CV ranging from 24% to ~45% ([30], [27]) and from 26% to ~62% ([12], [11]), respectively. The soil respiration of a strongly seasonal rainforest in Thailand showed a CV larger than 50% ([1]). For forests in which soil-respiration hot spots were detected, the CV was reduced to 41% to ~59% ([19], [21]). In the present study, the CV was found to be 42% and 38% in the rainy and dry seasons, respectively (Tab. 1). Overall, these results show that the spatial soil-respiration of forests generally varies between 20% and 50%.
The range of autocorrelation depended on the sample size and temporal interval. Randomly placing ten soil collars in a 10 × 10 m plot for soil respiration generated an autocorrelation range of ~4.8 m ([33]). Søe & Buchmann ([29]) reported an autocorrelation range of ~6 m for soil respiration in a 72 × 72 m plot with 144 soil collars. In a 2-m grid 50 × 50 m plot, the autocorrelation range varied from 4.4 m to 24.7 m ([12]). The average range of the spatial autocorrelation for soil respiration was ~40 m in this study (Tab. 2).
Multiscale studies suggested that strong spatial heterogeneity exists at all scales ([34], [16], [13]). A small-scale (< 1 m) assessment of spatial soil-respi ration variability in an agricultural area demonstrated a CV of 64% ([31]). This result was supported by another study of a forest in Wisconsin that also showed considerable variation at scales < 1 m ([16]). At the landscape scale, the CV of soil respiration in space was ~26% ([9]). As an alternative and independent method, eddy covariance can be used to provide information regarding fluxes at larger scales; however, it cannot be used to depict small-scale spatial variations ([13]). We know less about soil respiration in spatial scales between small-scale chamber measurements and large-scale eddy flux observations; therefore, we sampled with an interval of 20 m in a 20-ha rainforest plot in an attempt to address this gap. The soil-respiration heterogeneity (represented by the CV) that we found was comparable to that of point-scale or landscape-scale measurements. A great deal of attention should be paid to patches with a size of ~40 m when attempting to match the observations between the chamber method and the eddy covariance technique. Semivariance, which is a measure of dissimilarity ([25]), increased with distance to 40 m and then leveled off. These results suggest that the soil respiration was autocorrelated in the first ~40 m patch and randomly distributed spatially above this threshold.
It is important to know which factors and mechanisms control the spatial pattern of soil respiration when attempting to scale up and predict patterns. An increasing number of studies have identified a close relationship between the structural parameters of a stand (e.g., mean DBH and basal area) and spatial patterns of soil respiration ([29], [11], [5]). In our studied forest, no spatial correlation between soil respiration and tree DBH was found (r=0.071, p=0.379, n=151 - Fig. 5c). Additionally, no spatial correlation was observed between the soil respiration and other stand structural parameters (i.e., litter fall production and root biomass - Fig. 5b, Fig. 5d). In an Amazonian rainforest, the soil respiration was also not spatially correlated with stand structural parameters (r=0.028, p=0.87, n=32 - [30]). Furthermore, three 10-cm diameter samples did not represent a 20 × 20 m uniform plantation with flat terrain ([35]), let alone a plot of the same size in a tropical rainforest with a strongly seasonal climate and complex terrain. The measurements of soil temperature and moisture were made in the same place as the soil respiration. Although soil temperature and water content play a leading role in controlling the temporal patterns of soil respiration, these factors are frequently found to be unable explain the spatial variation of soil respiration ([37], [30], [33]). In this study, we found only a slight correlation between the soil temperature or water content and soil respiration in the studied forest (r2<0.1 - Fig. 5e, Fig. 5f).
The number of samples required to estimate the mean soil respiration in our experiment using a modified equation ([7]) was 71 and 51 for the rainy and dry seasons, respectively, with a 10% accepted error.
The soil respiration measured above termite mounds was not higher than the mean soil respiration, which coincided with the results of a previous study in a temperate forest ([20]). A systematic study of termite-mound soil respiration in the same forest also showed that termite mounds are not respiration hot spots (Schaefer D, personal communication, unpublished). Our experience is that the soil above termite mounds is particularly clayey and tightly packed, which hampers the diffusion of CO2 to the atmosphere. Termite nests may have unique features for gas outlets, which would result in large soil CO2 effluxes only being detected around these outlets. Another possible reason is that not all of the termites will remain in the nest all of the time. In the present study, all of the mounds that we selected had been abandoned by the termites.
Conclusions
Investigation of an entire 20-ha plot in a seasonal tropical rainforest revealed strong spatial heterogeneity in the rainy and dry seasons. The soil-respiration variability of this plot varied from 38% to 42%. Additionally, there was no spatial correlation observed between soil respiration and tree DBH, litterfall production or root biomass. The patch size of the soil respiration was approximately 40 m. The biotic activity and additional physical parameters should be examined in future studies.
Acknowledgments
We thank Lang Ma, Jiu Ma, Xiao-Long Bai, and Jin-Xiang Xiong and Hong-Li Ji, Han-Mei Wang, and Lian-Yan Yang for their assistance in the field. Constructive comments by Jiao-Lin Zhang and Lu-Xiang Lin are gratefully acknowledged. This work was supported by Xishuangbanna Station for Tropical Rain Forest Ecosystem Studies (XSTRE). The study was funded by the National Natural Science Foundation of China (41001063, 41071071), the Development Program in Basic Science of China (2010CB833501), the “Strategic Priority Research Program” of the Chinese Academy of Sciences (XDA05050601; XDA05050206) and the Chinese Academy of Sciences 135 program (XTBG-F01).
References
Gscholar
Gscholar
Gscholar
Gscholar
Gscholar
Gscholar
Authors’ Info
Authors’ Affiliation
N-S Liang
D Schaefer
Center for Global Environmental Research, National Institute for Environmental Studies, Tsukuba, 305-8506 Ibaraki (Japan)
Corresponding author
Paper Info
Citation
Song Q-H, Tan Z-H, Zhang Y-P, Cao M, Sha L-Q, Tang Y, Liang N-S, Schaefer D, Zhao J-F, Zhao J-B, Zhang X, Yu L, Deng X-B (2013). Spatial heterogeneity of soil respiration in a seasonal rainforest with complex terrain. iForest 6: 65-72. - doi: 10.3832/ifor0681-006
Academic Editor
Roberto Tognetti
Paper history
Received: Jul 10, 2012
Accepted: Jan 14, 2013
First online: Feb 07, 2013
Publication Date: Apr 02, 2013
Publication Time: 0.80 months
Copyright Information
© SISEF - The Italian Society of Silviculture and Forest Ecology 2013
Open Access
This article is distributed under the terms of the Creative Commons Attribution-Non Commercial 4.0 International (https://creativecommons.org/licenses/by-nc/4.0/), which permits unrestricted use, distribution, and reproduction in any medium, provided you give appropriate credit to the original author(s) and the source, provide a link to the Creative Commons license, and indicate if changes were made.
Web Metrics
Breakdown by View Type
Article Usage
Total Article Views: 64646
(from publication date up to now)
Breakdown by View Type
HTML Page Views: 52817
Abstract Page Views: 4359
PDF Downloads: 5720
Citation/Reference Downloads: 41
XML Downloads: 1709
Web Metrics
Days since publication: 4752
Overall contacts: 64646
Avg. contacts per week: 95.23
Article Citations
Article citations are based on data periodically collected from the Clarivate Web of Science web site
(last update: Mar 2025)
Total number of cites (since 2013): 24
Average cites per year: 1.85
Publication Metrics
by Dimensions ©
Articles citing this article
List of the papers citing this article based on CrossRef Cited-by.
Related Contents
iForest Similar Articles
Research Articles
Soil respiration along an altitudinal gradient in a subalpine secondary forest in China
vol. 8, pp. 526-532 (online: 01 December 2014)
Research Articles
Soil fauna communities and microbial activities response to litter and soil properties under degraded and restored forests of Hyrcania
vol. 14, pp. 490-498 (online: 11 November 2021)
Research Articles
Effect of different dolomitic limestone dosages on soil respiration in a mid-altitudinal Norway spruce stand
vol. 12, pp. 357-365 (online: 05 July 2019)
Research Articles
Seasonal dynamics of soil respiration and nitrification in three subtropical plantations in southern China
vol. 9, pp. 813-821 (online: 29 May 2016)
Research Articles
Thinning effects on soil and microbial respiration in a coppice-originated Carpinus betulus L. stand in Turkey
vol. 9, pp. 783-790 (online: 29 May 2016)
Research Articles
Impact of deforestation on the soil physical and chemical attributes, and humic fraction of organic matter in dry environments in Brazil
vol. 15, pp. 465-475 (online: 18 November 2022)
Research Articles
Relationship between microbiological, physical, and chemical attributes of different soil types under Pinus taeda plantations in southern Brazil
vol. 17, pp. 29-35 (online: 28 February 2024)
Research Articles
Wood-soil interactions in soil bioengineering slope stabilization works
vol. 2, pp. 187-191 (online: 15 October 2009)
Research Articles
Short-time effect of harvesting methods on soil respiration dynamics in a beech forest in southern Mediterranean Italy
vol. 10, pp. 645-651 (online: 20 June 2017)
Research Articles
Soil respiration and carbon balance in a Moso bamboo (Phyllostachys heterocycla (Carr.) Mitford cv. Pubescens) forest in subtropical China
vol. 8, pp. 606-614 (online: 02 February 2015)

