Comparison of soil CO2 emissions between short-rotation coppice poplar stands and arable lands
iForest - Biogeosciences and Forestry, Volume 11, Issue 2, Pages 199-205 (2018)
doi: https://doi.org/10.3832/ifor2621-010
Published: Mar 01, 2018 - Copyright © 2018 SISEF
Research Articles
Abstract
Bioenergy crops are considered to have the potential for climate mitigation and socio-economic benefits owing to their capacity to sequester C and partially replace the consumption of fossil fuels. In this study, the effects on soil respiration of a recent conversion of arable land to high (H) and very high (VH) density short-rotation coppices (SRCs), as well as of agronomic treatments (fertilization with or without irrigation) and lane/row location, were investigated in an alluvial area in Italy. A survey of soil variability was carried out by collecting soil cores (0-60 cm depth) at 67 points to characterize surface and subsurface spatial distributions of pH, organic carbon, nitrogen and carbonates and identify comparable points for monitoring soil respiration. Soil CO2 emissions were monitored over the period April 2010-November 2011 at 27 locations covering the whole study site. The influence of land use (H-SRC, VH-SRC, corn and alfalfa) or treatments on soil respiration was evaluated considering both factors as fixed effects in a linear mixed model. Our results showed that (i) the high variability of soil properties even at small spatial scale has to be considered when selecting points for monitoring soil respiration in the field; (ii) the cumulative soil respiration over the study period at the VH-SRC was lower (1299 ± 30 g C m-2) than in croplands (1600 ±145 g C m-2) and higher along the rows than in the lanes; (iii) no significant differences in soil respiration were found between the H-SRC and corn field; (iv) two years after VH-SRC establishment, agronomic treatments did not appear to influence soil respiration; (v) land-use change affected the vertical soil organic carbon distribution and soil surface temperature, as reflected in soil respiration differences.
Keywords
Land-use Change, Soil Spatial Variability, Soil Respiration, Short-rotation Coppice, Cropland, Mixed Model
Introduction
The identification of alternatives to fossil fuels has become a worldwide priority. Various biofuels based on food crops such as corn and soybean, or produced from lignocellulosic compounds of non-food crops, such as grasses and woody crops, play an ecologically and economically fundamental role as renewable energy supplies. In Italy, energy crops have mainly been developed under the regional financial support of EC Regulation 1257/1999. In particular, a short-rotation coppice (SRC) culture, which is a high-density plantation of fast-growing trees (such as poplars or willows) with cutting periods from 2 to 8 years, is considered to have a high potential for climate mitigation and socio-economic benefits owing to its capacity to sequester C and partially replace the consumption of fossil fuels ([30]).
Bioenergy cultivation can be considered carbon neutral since as much carbon is absorbed during the growth of the SRC plantation as it is released upon conversion to energy. Nevertheless, bioenergy cultivation may represent a CO2 source in relation to its associated land-use changes, acting as a CO2 source mainly during the first years of establishment, as a result of the cultivation practices that accelerate the short-term decomposition of organic matter in the soil ([12], [1]).
Many studies have been carried out on poplar short-rotation coppice biomass production and its quality, energy balance and management intensity ([16], [18]), by comparing the advantages of poplar SRC with other bioenergy crops ([15]) or by evaluating the conversion of agricultural lands from food production to poplar SRC ([2], [8]). However, there are few studies on SOC dynamics and CO2 fluxes under SRC ([32], [34], [38]).
To assess the impact of land-use changes on soil properties and CO2 fluxes, space-for-time substitution studies on a paired-plot, for which the assumption of an identical starting point has to be verified, are mainly used ([21], [6]). Since soil spatial variability is reflected in the differences in soil respiration rates ([7]), it follows that an appropriate sampling design should vary according to site conditions and depending on study objectives.
This study is part of the SUSCACE project (⇒ http://www.gruppo-panacea.it/biomasse/progetti/suscace), which aims to investigate the conversion of agricultural lands from food production (sugar beet) to SRC poplar plantations for bioenergy. In the context of the SUSCACE project, the objectives of this study were to: (i) identify comparable soil respiration monitoring points based on a soil spatial variability survey; (ii) assess the effects of recent conversion of arable land to SRC on soil respiration; and (iii) investigate of the influence of agronomic treatments and of lane/row position on soil CO2 efflux in a 2-year-old very high density SRC.
Materials and methods
Study site
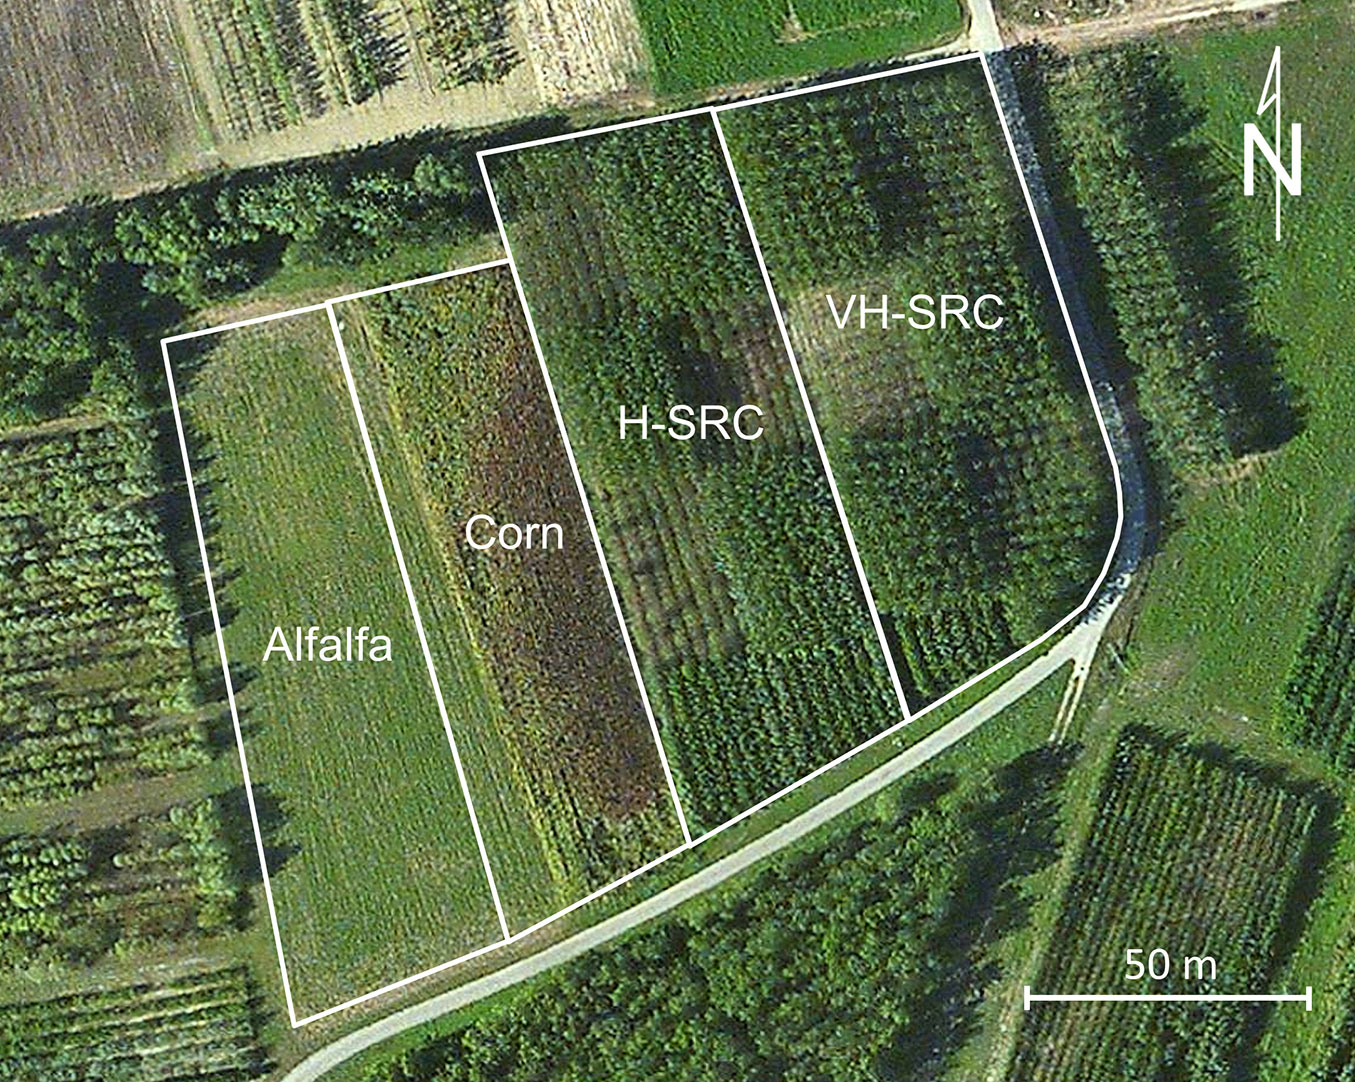
The experimental site (Fig. 1) is located close to the Po River within the CREA (Italian Council for Agricultural Research and Economics) experimental farm at Casale Monferrato in Piedmont, Italy (45° 08′ 07.77″ N; 08° 30′ 42.16″ E). The climate is temperate continental, as monitored by the long-term meteorological station at the experimental site, with a yearly average rainfall of 715 mm and mean air temperature of 12.5 °C.
Fig. 1 - Study area and field subdivision. (Alfalfa): cropfield cultivated with alfalfa; (Corn): cropfield cultivated with corn; (H-SRC): high-density short rotation coppice (1,111 trees ha-1); (VH-SRC): very high-density short rotation coppice (8,333 trees ha-1).
Soils did not exhibit a high pedogenetic degree since they developed on recent alluvial deposits. According to the WRB classification ([14]), they are Calcaric Regosols (Epiloamic, Endoarenic) and sometimes Endoskeletic (see Fig. S1 in Supplementary Materials). The soil surface texture (USDA class) is mostly sandy loam, while the soil texture becomes sandy once deeper in the soil. In agronomical terms ([20]), soils are low in SOM, moderately calcareous and slightly alkaline.
The study area (1.52 ha) had been managed in a uniform manner for at least 60 years before the land was converted. In the autumn of 2006, the total area of former cropland was alfalfa cultivated (Medicago sativa). Beginning in the spring of 2009, the area was subdivided into 4 fields (each field was approximately 0.38 ha): one alfalfa, one corn, and two poplar SRC (Populus × canadensis Mönch) fields. One of the two poplar SRC fields was a high density trial (H-SRC - 1,111 trees ha-1; 3 × 3 m spacing), and one was a very high density trial (VH-SRC - 8,333 trees ha-1; 3 × 0.4 m spacing), with cutting periods of 5 and 2 years, respectively.
For the VH-SRC, four different cultivation treatments were tested: control (CTR), fertilization (F), irrigation (I), and both fertilization and irrigation (FI). The SRC models and treatments were tested using a split-plot design with three replications (each plot covered approximately 50 m2).
The entire area of the experiment, except for a section that remained alfalfa cultivated, was ploughed to a depth of 35 cm and harrowed before field subdivision and planting or seeding. In the VH-SRC trial, post-planting residual herbicides (pendimethalin and metolachlor) were applied for 30-40 days after planting to prevent germination of annual weeds. During the planting year, disc harrowing was carried out in the lanes twice in the VH-SRC and only once in the H-SRC. During the cultivation period, the harrowing was carried out once per year for both the stands.
Every year, three chemical pesticide treatments against insects (Chrysomela populi, Cryptorhynchus lapathi and Hyphantria cunea) were needed for both poplar trials; fertilization was carried out once a year in the early spring using 60 kg of nitrogen per hectare. A drip irrigation system was utilized, and during the summer, a quantity of water corresponding to the estimated evapotranspiration (by a Class A pan) was applied three times a week. Alfalfa and corn were sprinkler irrigated twice every summer (350 m3 ha-1). Only corn was ploughed and fertilized (210 kg ha-1 of nitrogen) once every spring.
Multiple harvestings per year (4-5 times) were applied for alfalfa and once per year for corn, while in the VH-SRC plantation, harvesting was carried out at the end of the first year.
Soil spatial variability
A survey of soil spatial variability was carried out to characterize the surface and subsurface spatial distribution of soil organic carbon (SOC), total nitrogen (Ntot), pH in water and KCl (pHw and pHKCl), and total carbonates (CaCO3) at the time of land-use conversion.
The thickness of soil layers was inferred from the average limits between the horizons, according to description of pedological pits. Soil samples were collected in 67 randomly selected georeferenced points from 4 layers: 0-15 cm (average harrowing thickness, corresponding to the Ap1 horizon), 15-35 cm (35 cm is the depth of recent ploughing), 35-60 cm (60 cm is the depth of the old deep ploughing for poplar planting), and 60-100 cm (corresponding to the C horizon, never affected by ploughing). The sampling was performed during the spring of 2010, using a gouge auger (30 mm diameter - Eijkelkamp, Giesbeek, The Netherlands).
Soil samples were air dried, sieved (2 mm mesh) and analysed to determine the SOC and Ntot content (Flash EA 1112 NCSoil, Thermo Fisher Scientific elemental analyzer, Pittsburgh, USA), pHKCl and pHw (soil to KCl 1 M solution/water ratio of 1:2.5) and CaCO3 (Dietrich-Frühling calcimeter, in the 0-15 cm layer only).
Along with the characterization of the initial soil conditions to monitor soil changes over time, the spatial variability study provided a guide for the selection of points for soil respiration (Rs) monitoring and comparison. Data related to the soil surface layer, from which the major part of a gas flux usually originates, were processed by geostatistical ordinary kriging techniques to map the spatial distribution of soil properties ([11], [35], [36]). The goodness-of-fit of interpolated values to the observed values at each sampling point was evaluated with cross-validation by calculating: (1) the mean error (ME), which proves the unbiasedness of an estimator if its value is close to 0; and (2) the variance of the root mean square standardized error (RMSSE). If the estimation is accurate, the variance of the RMSSE should vary within the 1 ± 3·√(2/n) interval, where n is the number of samples ([4]).
For each variable, an exploratory data analysis, including the calculation of descriptive statistics, identification of data distribution types and detection of outliers were performed.
All geostatistical analyses were performed using the ISATIS software package, release 13.01 ([10]).
Soil respiration
For the comparison of soil respiration (Rs) between land uses, soil CO2 flux was measured every 15-30 days (depending on the season) over a period of 19 months (April 2010 to October 2011) at 15 locations (see below). Measures were taken using plastic collars with a diameter of 10 cm and height of 6 cm. At the beginning of the experiment, the collars were inserted into the soil down to 2.5 cm from the soil surface and remained in place throughout the duration of the experiment. Collars were momentarily removed only during harrowing and repositioned immediately after.
The 15 monitoring sites were distributed throughout the experimental fields, with three locations for each land-use type, except for VH-SRC where each collar in the lane was coupled to a nearby collar in the row. The monitoring points for each land-use type were selected based on the spatial distribution maps of soil properties that were used to identify soils with comparable characteristics, so that the effects of land-use changes could be monitored. Since the soil texture was relatively uniform at the study site, the choice of monitoring sites was based on the spatial distribution of the SOC stock and rock fragment content.
The comparison of Rs between land uses was conducted for the same type of management (fertilization and irrigation), and therefore, only the FI thesis was considered for the VH-SRC.
The assessment of the influence of agronomic treatments on Rs was carried out on the same dates as the land-use comparison was conducted. In the VH-SRC, the soil CO2 fluxes of the three experimental treatments (CTR, F, FI) were compared using the 6 collars already installed for land-use comparison. Moreover, 12 additional collars equally distributed between rows and lanes were placed at the CTR and F treatments, in order to deeper investigate the differences between rows and lanes in VH-SRC.
CO2 soil fluxes at monitoring sites were measured using an EGM-3 portable infrared gas analyser (PP-Systems, Hitchin, UK) equipped with an SRC-1 chamber based on the principle of closed dynamic cylindrical systems with a diameter of 10 cm and volume of 1170 cm3. A small fan in the chamber ensured air mixing. For each monitoring day, a single measurement was performed at each sampling point. To reduce the effects of diurnal variation, measurements were taken during the central hours of the day within a time span of four hours. Simultaneously with Rs, soil water content and soil temperature (Ts) were measured at all points within 10 cm from the collar. Soil water content was measured with a portable TDR system (IMKO Micromodultechnik, GmbH, Ettlingen, Germany) using a 10 cm long trifurcated probe and the results were converted to water-filled pore space (WFPS, %). Ts was measured with the built-in temperature probe of the CO2 analyser at a depth of 5 cm. Soil temperature was also measured at the same depth as Ts and was recorded continuously at the meteorological station of the experimental site.
The Rs and Ts data from each collar were fitted to exponential models (data not shown); consequently, cumulative respiration rates (Rcum, g C m-2) over the period of the experiment (1st of April 2010 - 31st of October 2011) were computed by integrating (hourly base) the Rs estimated as a function of the soil temperature. The average Rcum rates were computed for each land-use type. For the VH-SRC, the average Rcum rates were calculated, weighing the results obtained in the rows and lane.
At the end of the experiment (November 2011), the soil at all the gas monitoring points was sampled (0-15 cm) to determine the root density (RD) and SOC content. For successful separation of the roots from the soil, the soil samples were dispersed in a sodium hexametaphosphate solution. Roots were then washed with water and divided into three diameter classes: (i) fine (f, <2 mm); (ii) medium (m, 2-5 mm); (iii) coarse (c, >5 mm). The roots were oven-dried at 105 °C for 48 h to determine their dry mass.
Soil bulk density (BD) at each monitoring point was determined for the 0-15 cm layers with the cylindrical core method (core diameter = 5.4 cm) on undisturbed core samples, considering the volume of the stones when present. Through the BD and stone volume, the SOC content on an area basis was computed for the mineral 0-15 cm layers in correspondence with the monitoring plots.
Statistical analyses
To compare soil properties between the monitoring locations and test for differences in Rcum and pedoclimate parameters between land-use and management types, the mixed effect model procedure was performed ([3]) and autocorrelation among the model residuals was tested ([28]).
After verifying the absence of a residual spatial correlation (data not shown), the evaluation of each variable response in relation to land use or a treatment was carried out considering land use or treatment as a fixed effect in the linear mixed model. The differences between the mean values were obtained through contrast analysis. The restricted maximum likelihood (REML) procedure was used to estimate the variance components ([17]).
All statistical analyses were performed using the SAS® software (release 9.4, SAS Institute Inc., Cary, NC, USA).
Results
Spatial distribution of soil properties
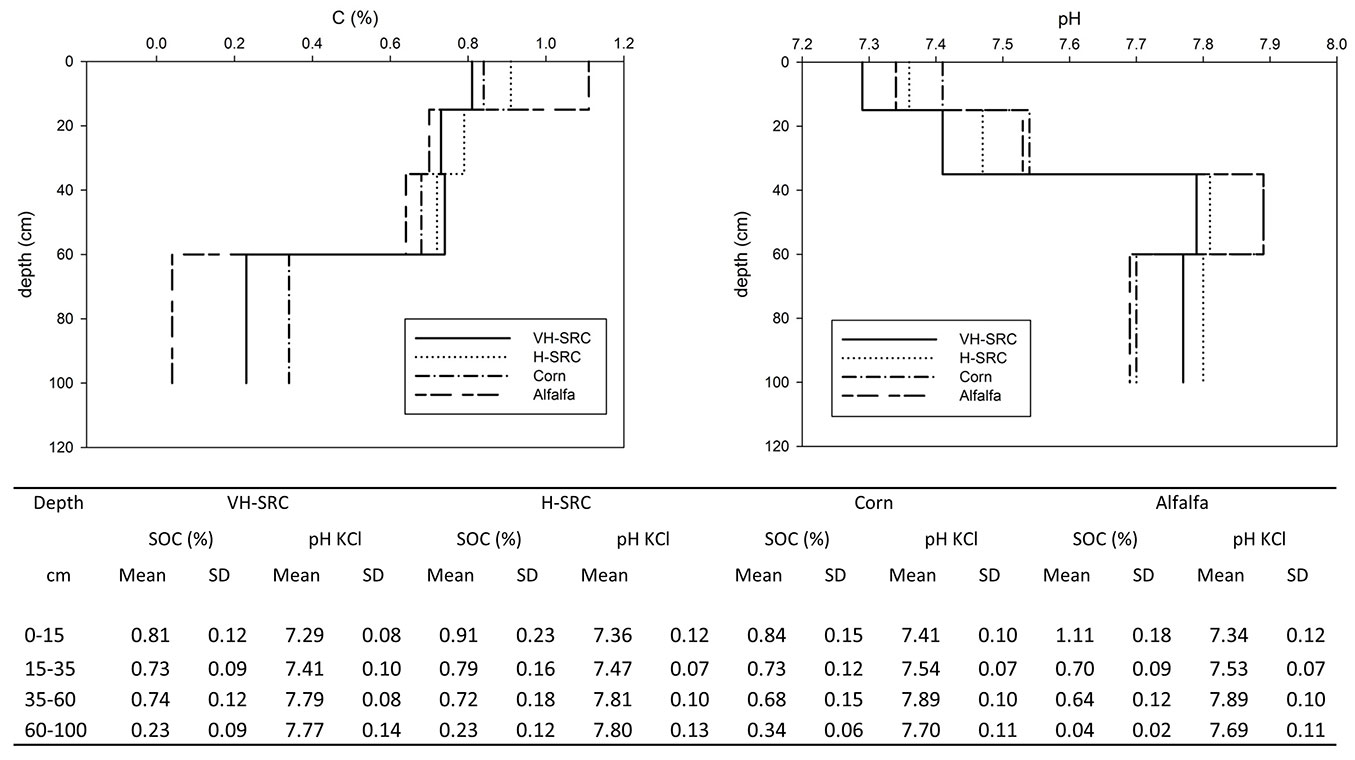
The vertical distribution of the SOC content and pHKCl is displayed in Fig. 2. The average SOC content (± standard deviation, SD) was 0.92 ± 0.20% and 0.74 ± 0.12% at the 0-15 cm and 0-35 cm depths, respectively, with differences in the vertical distribution between the investigated fields. The alfalfa field showed a significantly (p<0.05) higher SOC value (1.11 ± 0.18%) in the 0-15 cm layer than in the 15-35 cm layer (0.70 ± 0.09%), while the remaining fields exhibited a more uniform vertical distribution in the ploughed layer (0-35 cm). Since old, deep ploughing had been made within 60 cm of depth, the SOC content was very low under this limit. The vertical trend of N was comparable with that of SOC (data not shown).
Fig. 2 - Vertical distribution of SOC (% - left panel) and pHKCl (right panel) mean values in the soil cores obtained from the survey of soil spatial variability at the four experimental fields. (VH-SRC): very high-density short rotation coppice; (H-SRC): high-density short rotation coppice; (SD): standard deviation.
The pHw average values increased with depth in all the fields (from 7.7 ± 0.1 to 8.5 ± 0.1); the vertical trend of pHw was comparable with that of pHKCl, except for the deepest layer where the values of pHKCl were lower (corn and alfalfa) or nearly equal (SRCs) to those of the third layer. The average surface CaCO3 content was 8.5 ± 0.9%.
An isotropic variogram model was fitted to the experimental variograms of the surface (0-15 cm) SOC content and stock, pHKCl and coarse rock fragments. The variogram consisted of two basic structures, a nugget effect and a spherical model with 82, 78, 32 and 118 m ranges, respectively, for the four aforementioned variables. The variogram fitting was satisfactory because the mean error was close to 0 and the RMDDE was within the 1 ± 3·√(2/n) interval.
The experimental variogram of CaCO3 content showed a pure nugget effect, which indicated a complete lack of spatial correlation, at least at the sampling scale.
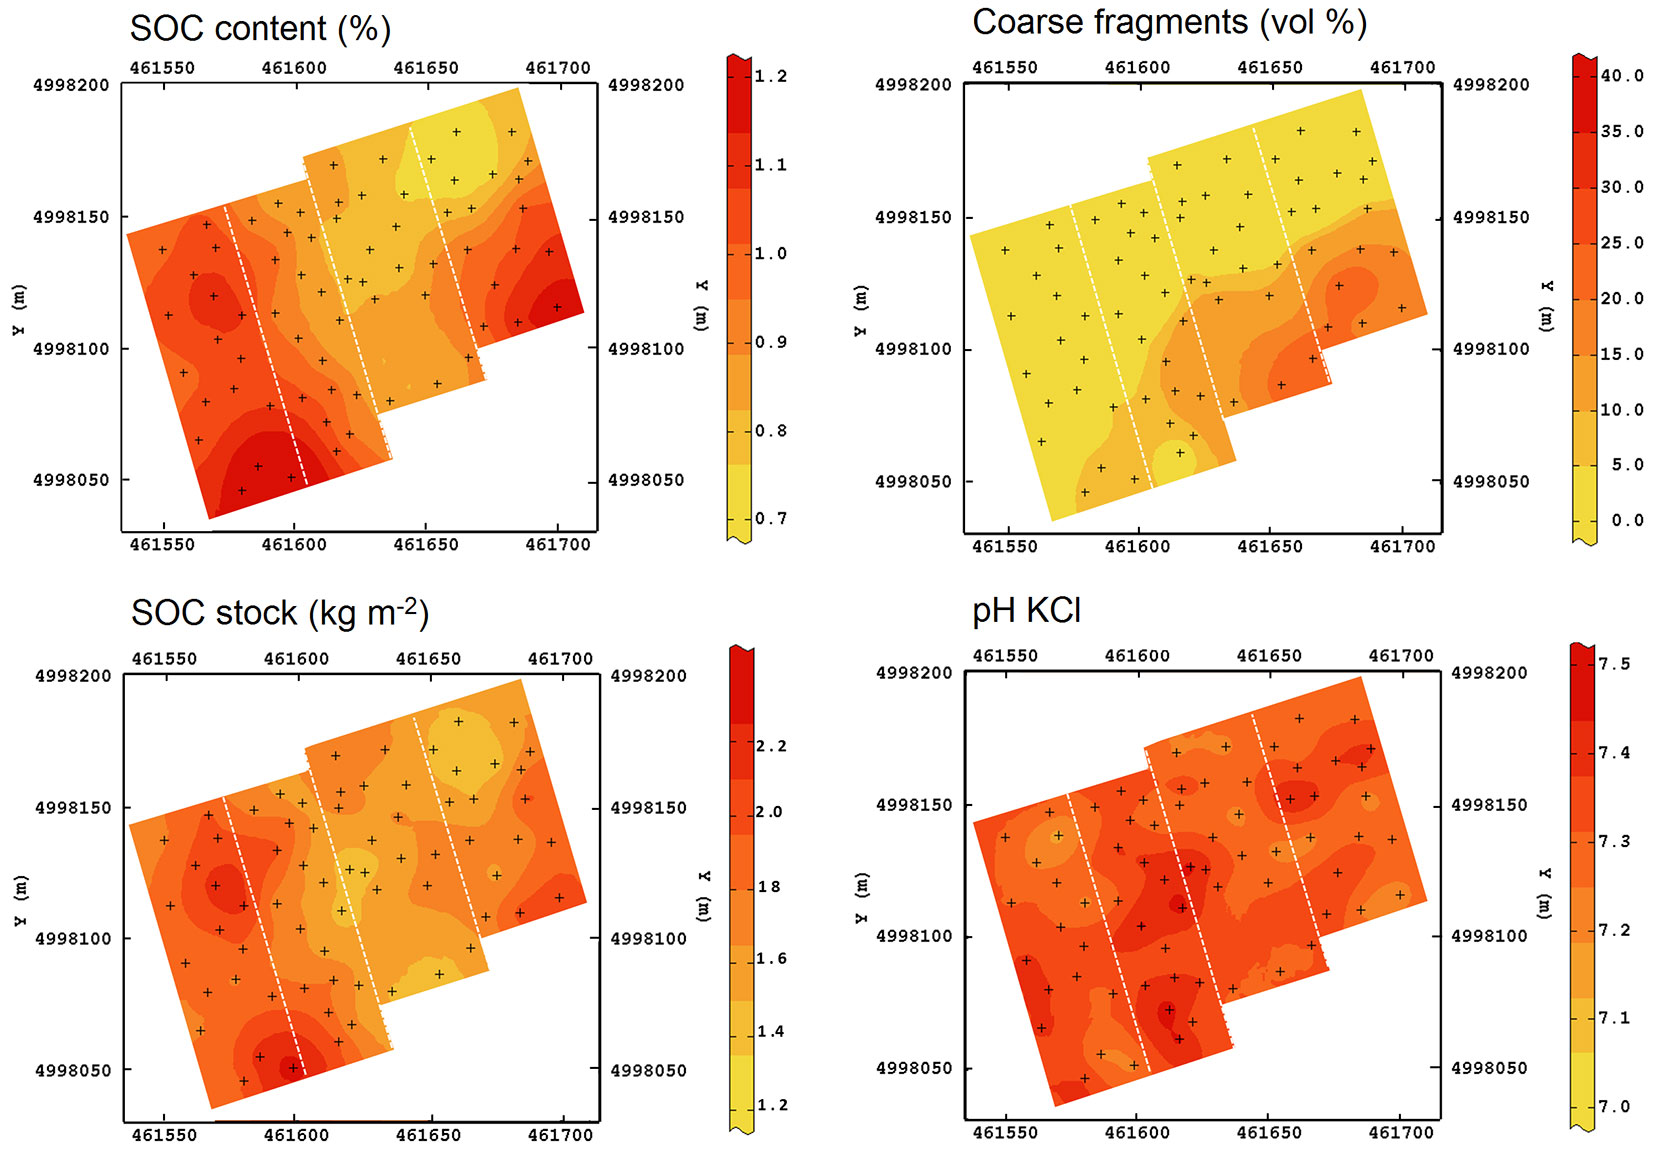
The spatial distribution maps of the SOC content and stock, as well as the pHKCl and coarse rock fragments of the surface layer, are shown in Fig. 3. A clearly increasing gradient in rock fragment percentage was observed in the NW-SE direction, mainly in the eastern part of the study area where the SRC plantations are located. The SOC content in the SRC fields showed a similar spatial distribution trend, while for carbon stock such gradient was attenuated.
Fig. 3 - Maps obtained by spatial interpolation (kriging) of soil parameters (0-15 cm layer). Black crosses represent the soil sampling points of the spatial survey.
The alfalfa field showed a higher SOC surface content and stock than the other fields. As for pHKCl, a substantial homogeneity of values was observed throughout the study site.
Based on the obtained maps, the points for Rs monitoring were identified, taking care of selecting points as similar as possible in terms of properties affecting soil CO2 emissions. The average values of BD, SOC stock and RDf (fine root density) of the 0-15 cm layer for each land-use and management type are shown in Tab. 1. Preliminarily, Rs monitoring points were selected in areas with no rock fragments; however, significant differences in BD were found, with the lowest values at the alfalfa field and the highest values at the VH-SRC field. No significant differences were found in SOC stock and RDf among the selected monitoring points.
Tab. 1 - Average values (± standard deviation) of soil bulk density (BD), soil organic content (SOC) stock and fine root density (RDf) at monitoring points for each land use (VH-SRC, H-SRC, corn, alfalfa - see text) and agronomic treatment (CTR: control; F: fertilization; FI: fertilization and irrigation). Different letters denote significant (p < 0.05) differences between land uses. Number of monitoring points: 3 couples (one in the lane and one in the row) of collars for the VH-SRCs and 3 collars for all the other land uses. Average values at the VH-SRC were obtained by weighing the results in rows and lanes.
| Variable | VH-SRC | H-SRC | Corn | Alfalfa | ||
|---|---|---|---|---|---|---|
| CTR | F | FI | ||||
| BD | 1.6 ± 0.1a | 1.5 ± 0.1ab | 1.6 ± 0.1a | 1.4 ± 0.1b | 1.4 ± 0.1b | 1.3 ± 0.1c |
| RDf | 0.6 ± 0.3 a | 0.4 ± 0.1 a | 0.9 ± 0.5 a | 0.6 ± 0.3 a | 0.1 ± 0.4 a | 0.5 ± 0.1 a |
| SOC stock | 1.7 ± 0.1a | 1.6 ± 0.2a | 1.5 ± 0.1a | 1.5 ± 0.1a | 1.6 ± 0.1a | 1.8 ± 0.2a |
Soil respiration
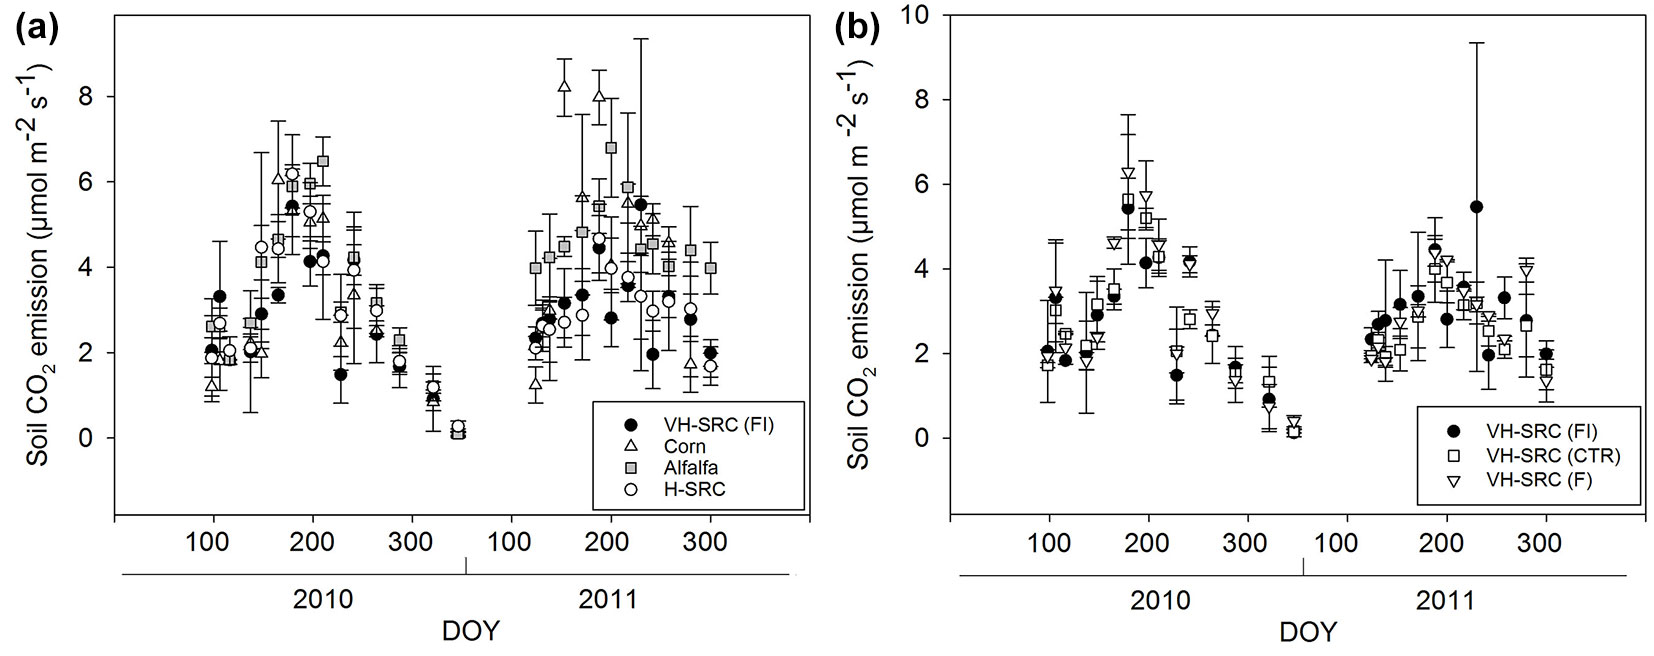
During the monitored period, the measured Rs rates ranged from 0.07 to 8.2 µmol CO2 m-2 s-1 in the corn field, from 0.11 to 6.8 µmol CO2 m-2 s-1 in the alfalfa field, from 0.19 to 5.2 µmol CO2 m-2 s-1 in the VH-SRC (FI) and from 0.34 to 6.2 µmol CO2 m-2 s-1 in the H-SRC (Fig. 4a). The different agronomic treatments in the VH-SRC showed similar soil CO2 emissions (Fig. 4b) with average values (± standard deviation) of 3.3 ± 1.4, 2.8 ± 1.5 and 3.2 ± 1.2 µmol CO2 m-2 s-1 in the FI, F and CTR treatments, respectively. Rs generally showed a typical seasonal pattern following soil temperature (Ts), with the highest soil CO2 fluxes during the summer months and the lowest during the winter months.
Fig. 4 - Comparison of the temporal trends in soil CO2 emissions (µmol m-2 s-1) between land uses (a) and treatments (b).
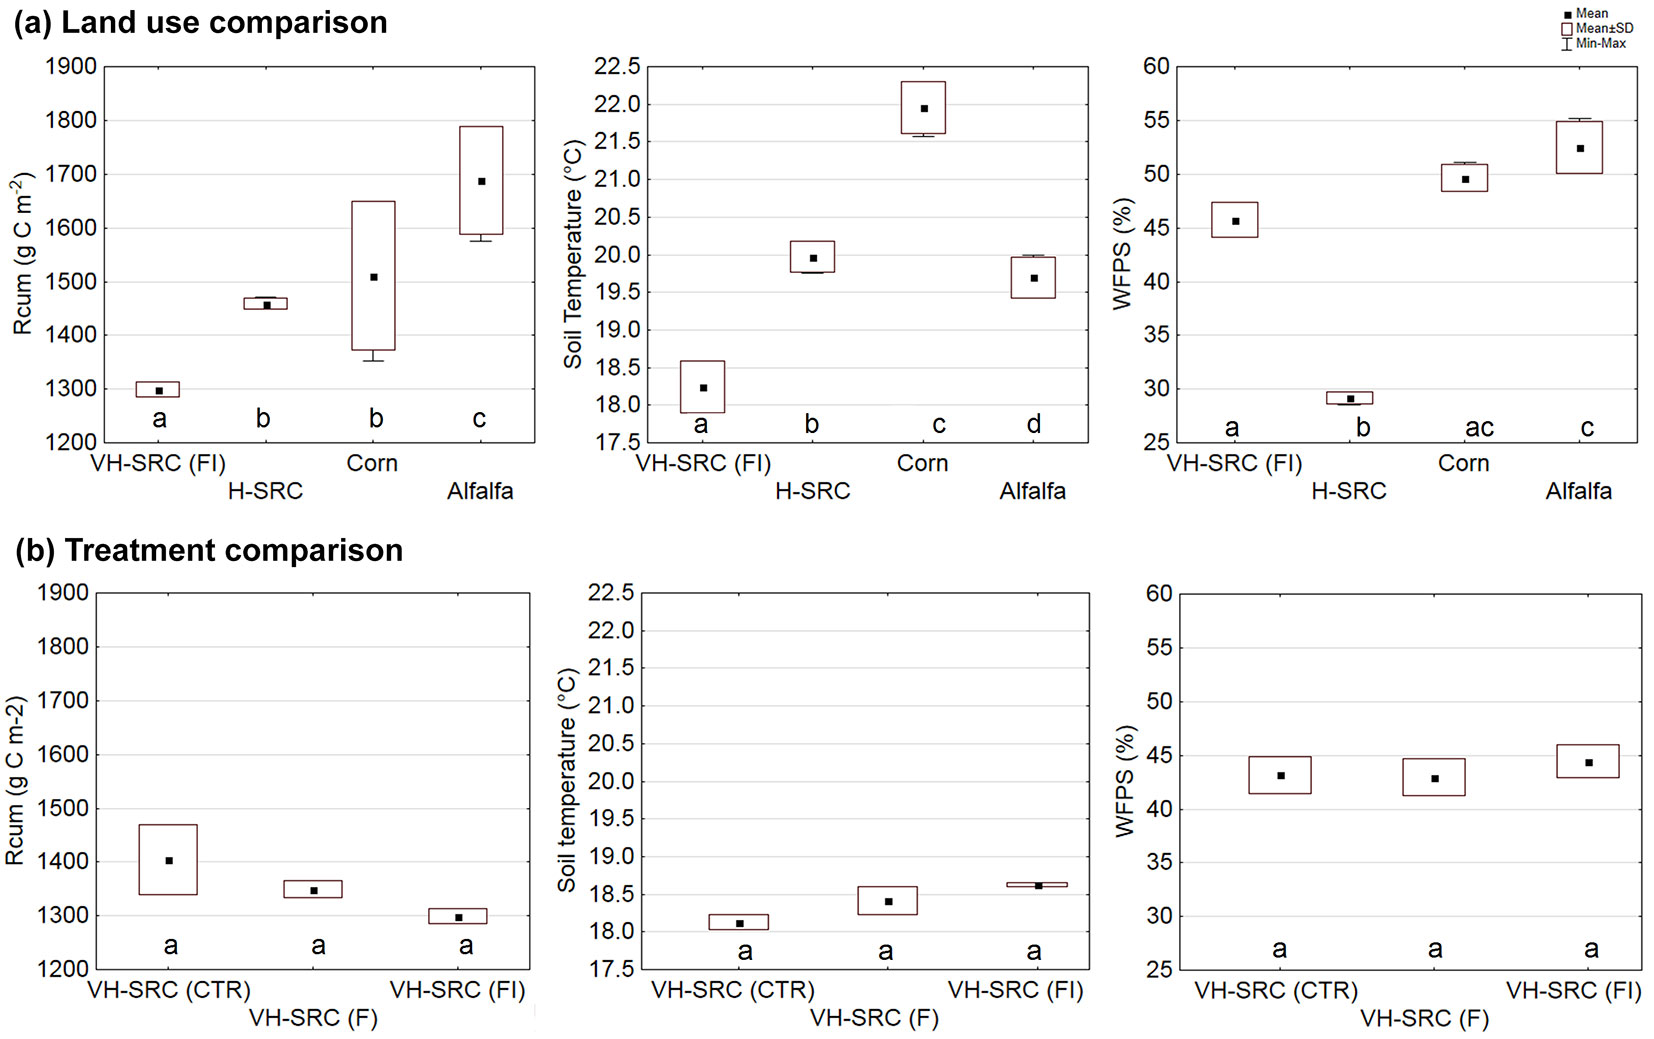
The comparison of average Rcum, Ts and WFPS (water-filled pore space) values for the analysed land uses are shown in Fig. 5a. The corn field, which was more exposed to solar radiation, showed an average Ts significantly higher than that measured in the other plots, followed by the H-SRC and alfalfa fields, whose Ts were comparable to each other and significantly different from the VH-SRC field. The WFPS in the H-SRC was the lowest.
Fig. 5 - Comparison of soil parameters among land use types (a) and agronomic treatments (b). (Rcum): soil cumulative respiration rate (g C m-2); (Ts): soil temperature (°C); (WFPS): water filled pore space (%). Treatments: (CTR) control; (F) fertilization; (FI) fertilization and irrigation. Different letters denote significant differences (p < 0.05) between means. Number of sampling points: four for each VH-SRC treatment and three for H-SRC, corn and alfalfa.
The Rcum in the alfalfa field (1689 ± 100 g C m-2) was significantly higher (p<0.05) compared with that of the other land uses. The H-SRC and corn field showed similar CO2 fluxes (approximately 1500 g C m-2), which were significantly higher than that measured at VH-SRC plantation (1299 ± 30 g C m-2).
The agronomic treatments tested inside the VH-SRC plantation did not result in differences in the Rcum or in differences in the Ts and WFPS (Fig. 5b).
In the VH-SRC stand, the rows and lanes were compared (Tab. 2). The cumulative CO2 emissions in the rows were significantly higher (p value < 0.05) than in the lanes. The SOC was higher (p < 0.10) in the rows, and the BD was higher (p < 0.10) in the lanes.
Tab. 2 - Comparison of soil parameter values (average ± standard deviation) between rows and lanes at the VH-SRC. Number of sampling points: nine for rows and nine for lanes. (1): 0-15 cm; (2): 0-5 cm; (3): 0-10 cm.
| Label | Parameter | Units | Rows | Lanes | p-value |
|---|---|---|---|---|---|
| Rcum | Cumulative soil respiration | g C m-2 | 1621 ± 200 | 1274 ± 60 | 0.002 |
| SOC (1) | Soil organic C | g kg-1 | 7.7 ± 0.8 | 6.8 ± 0.4 | 0.095 |
| RDf (1) | Fine root density | g dm-3 | 0.78 ± 0.09 | 0.62 ± 0.08 | 0.656 |
| BD (1) | Bulk density | g cm-3 | 1.5 ± 0.1 | 1.6 ± 0.1 | 0.092 |
| Ts (2) | Soil temperature | °C | 18.02 ± 0.76 | 18.49 ± 0.98 | 0.406 |
| WFPS(3) | Water filled pore space | % | 46.1 ± 3.5 | 43.5 ± 2.8 | 0.294 |
Discussion
As previously reported by many studies, soil heterogeneity is elevated even at small spatial scales. Therefore, the adoption of an adequate sampling strategy is crucial for monitoring organic carbon changes and respiration rates in soils ([26], [25]). For our purposes, the preliminary analysis of soil spatial variability made it possible to identify areas with soil characteristics as much similar as possible, so that soil CO2 fluxes could be correctly monitored and the effects of land-use changes appropriately investigated. Indeed, the spatial survey revealed a degree of soil variability that could have invalidated any conclusions related to the effects of the land-use changes and management if the plot choice had been random. For example, rock fragment content in the study area showed a spatial variability not connected to the land-use change but to the alluvial origin of the soil. Rock fragments were absent in about half of the study area but strongly influenced the remaining study area. In fact, rock fragment content significantly affected the soil bulk density and SOC stock ([29], [37]), and therefore, the knowledge of its spatial distribution was critical for the identification of comparable Rs in the monitored area.
The observed SOC enrichment in the alfalfa field was probably the consequence of the previous four years of alfalfa cultivation in the same field. In forage production systems, perennial grasses such as alfalfa increase SOM by increasing root biomass and stimulating microbial growth in the rhizosphere ([19], [27]). In such systems, where aboveground biomass is removed through mowing, roots and rhizodeposit-C are the primary sources of SOC ([31]). After land use conversion (2009), the portion of the study area kept with alfalfa cultivation was not ploughed, so that it could be part of the 5-year rotation period. This could have favored the accumulation of SOC in the soil surface layers (0-15 cm), in contrast with deeper layers (0-35 cm). At the end of the rotation period, alfalfa will be replaced by corn; pre-sowing soil preparations include ploughing, which result in a sudden change in the vertical SOC distribution by mixing the upper enriched layer with the deeper depleted one (up to 35 cm). This will likely promote the decomposition of SOC because of the increase in soil aeration.
Due to the heterogeneity of the abovementioned soil properties, we chose to locate the points for monitoring soil respiration in the zones with no rock fragments and similar in SOC stocks. During the monitoring period (April 1st 2010 - October 31st 2011), the calculated SRC cumulative respiration values averaged 1351 ± 56 and 1459 ± 11 g C m-2 for the VH and H stands, respectively. Reporting such values on an annual scale, the observed fluxes were higher than those measured by Verlinden et al. ([33], [34]) in an SRC poplar plantation of the same age and characterized by a similar SOC, and comparable to values reported by Vande Walle et al. ([32]) for an older SRC established on former agricultural land. The latter study also reported a low RDf (fine root density) in the surface layer, similar to that observed in our experimental area, which can be explained by the young age of the plantations.
In our study, only the fine root density was considered, as fine roots were predominant and had higher respiration rates compared to larger roots ([22], [5]). However, poor rooting was observed in croplands as well, likely suggesting a small autotrophic contribution to the total Rs over the whole experimental area. The relatively low root biomass and the short duration of live roots for annual crops usually results in a low contribution of root respiration in croplands ([23]).
According to Verlinden et al. ([33], [34]), our SRCs may present characteristics more similar to croplands than to forest stands, where root contributions are generally higher. This could be the consequence of their young age and the tillage (although of low intensity) applied during the cultivation period. Indeed, we observed lower Rcum values at the VH-SRC stand, while for the H-SRC stand Rcum was similar to that recorded at the corn field.
The higher SOC content and the consequent lower bulk density (BD) in the upper soil layer of the alfalfa plot were mainly responsible for the highest Rcum values. As alfalfa has the ability to fix atmospheric N, it is possible that soil respiration (Rs) was also affected by the biological N fixation process, since that N-fixing bacteria oxidize the organic C to obtain energy, thus releasing large amounts of CO2 ([13]).
Nonetheless, our results showed that the differences in Rs among land uses may also be explained by differences in soil temperature ([24], [9]). Vegetation cover can deeply alter Ts and thereby significantly influence the Rs rates ([23]). Accordingly, we found that the average Ts at the VH-SRC plot was lower than that detected at the other monitoring sites, probably due to the high density of poplar trees and their canopy shading. Moreover, Ts at the H-SRC plot was similar to that of alfalfa rather than VH-SRC, likely because the lower tree density, together with the limited canopy extension of the young stand, led to a higher proportion of bare soil.
Two years after VH-SRC establishment, irrigation and fertilization treatments did not appear to affect soil respiration. However, rows in VH-SRC showed a higher cumulative respiration (Rcum) than lanes, and the higher Rcum coincided with higher SOC and RDf and lower soil BD. The differences between the rows and lanes were likely due to management practices. Indeed, the lanes were subjected to tillage and periodically compacted by tractor transit, while no tillage was performed in the rows, thus avoiding SOC losses through mineralization and allowing the root and soil structure to develop. Moreover, fresh input of organic matter, in addition to that stemming from root turnover, was derived from the litter, whose biomass was higher near the row than in the lane. This input of organic matter, together with a higher (although not statistically significant) root biomass, may have contributed to higher soil CO2 emissions from the rows, through a higher heterotrophic and autotrophic contributions.
It is likely that the SOC enrichment observed only two years after the SRC establishment will increase over time as a result of the type of soil management. The intensity of SRC management is lower in comparison with the management of annual crops such as corn. In the experimental SRCs, trees are cut every 2 and 5 years at VH-SRC and H-SRC, respectively, and trees resprout from stumps that are permanently left on-site. The SRCs are characterized by regular leaf litter and root input and thus a higher SOC input compared to conventional crops, where soil ploughing is required annually (corn) or every 5 years (alfalfa), and the epigeic biomass is completely harvested. Furthermore, the tree canopies provide, at least in the VH-SRC, a significant shading throughout the summer season, limiting the increase in soil temperature and consequently soil CO2 emissions.
Conclusions
Our study provided evidence that: (i) the spatial variability in soil properties is an important feature to be considered in the selection of monitoring points for soil respiration; (ii) the average cumulative respiration rate (Rcum) was lower in the very high-density short rotation coppices (VH-SRC) than in croplands, and higher in the SRC rows than in lanes; (iii) no significant differences in Rcum were found between the high-density coppice (H-SRC) and corn field; (iv) two years after VH-SRC establishment, agronomic treatments including irrigation and fertilization did not appear to affect soil respiration; and (v) land-use change affected the vertical SOC distribution, soil bulk density and soil surface temperature, which were reflected in the differences in soil respiration.
Further studies are needed and will be performed to confirm out results, through soil resampling over time to monitor long-term variation of soil properties in the study area, aimed at better understanding the effect of recent conversion of arable lands to SRC.
Acknowledgements
This work was supported by the SUSCACE project. Special thanks to G. Facciotto and S. Bergante of CREA-PLF (Casale Monferrato, Italy), for their field support and site management information, and to G. Seufert, A. Meijide, M. Duerr and C. Gruening of the Air and Climate Unit of the JRC of the European Commission (Ispra, Varese, Italy) for their assistance in the selection of the sampling design and loaning the instrumentation for soil respiration monitoring.
References
Gscholar
Gscholar
Gscholar
Gscholar
Gscholar
Gscholar
Gscholar
Gscholar
Gscholar
Authors’ Info
Authors’ Affiliation
Roberto Comolli
Department of Earth and Environmental Sciences, Milano Bicocca University, Milan (Italy)
Corresponding author
Paper Info
Citation
Ferré C, Comolli R (2018). Comparison of soil CO2 emissions between short-rotation coppice poplar stands and arable lands. iForest 11: 199-205. - doi: 10.3832/ifor2621-010
Academic Editor
Werther Guidi Nissim
Paper history
Received: Sep 02, 2017
Accepted: Dec 14, 2017
First online: Mar 01, 2018
Publication Date: Apr 30, 2018
Publication Time: 2.57 months
Copyright Information
© SISEF - The Italian Society of Silviculture and Forest Ecology 2018
Open Access
This article is distributed under the terms of the Creative Commons Attribution-Non Commercial 4.0 International (https://creativecommons.org/licenses/by-nc/4.0/), which permits unrestricted use, distribution, and reproduction in any medium, provided you give appropriate credit to the original author(s) and the source, provide a link to the Creative Commons license, and indicate if changes were made.
Web Metrics
Breakdown by View Type
Article Usage
Total Article Views: 47551
(from publication date up to now)
Breakdown by View Type
HTML Page Views: 40505
Abstract Page Views: 2870
PDF Downloads: 3168
Citation/Reference Downloads: 13
XML Downloads: 995
Web Metrics
Days since publication: 2891
Overall contacts: 47551
Avg. contacts per week: 115.14
Article Citations
Article citations are based on data periodically collected from the Clarivate Web of Science web site
(last update: Mar 2025)
Total number of cites (since 2018): 6
Average cites per year: 0.75
Publication Metrics
by Dimensions ©
Articles citing this article
List of the papers citing this article based on CrossRef Cited-by.
Related Contents
iForest Similar Articles
Research Articles
Spatial heterogeneity of soil respiration in a seasonal rainforest with complex terrain
vol. 6, pp. 65-72 (online: 07 February 2013)
Research Articles
Linking biomass production in short rotation coppice with soil protection and nature conservation
vol. 7, pp. 353-362 (online: 19 May 2014)
Research Articles
Soil respiration along an altitudinal gradient in a subalpine secondary forest in China
vol. 8, pp. 526-532 (online: 01 December 2014)
Research Articles
Thinning effects on soil and microbial respiration in a coppice-originated Carpinus betulus L. stand in Turkey
vol. 9, pp. 783-790 (online: 29 May 2016)
Research Articles
Short-time effect of harvesting methods on soil respiration dynamics in a beech forest in southern Mediterranean Italy
vol. 10, pp. 645-651 (online: 20 June 2017)
Research Articles
Seasonal dynamics of soil respiration and nitrification in three subtropical plantations in southern China
vol. 9, pp. 813-821 (online: 29 May 2016)
Research Articles
Soil respiration and carbon balance in a Moso bamboo (Phyllostachys heterocycla (Carr.) Mitford cv. Pubescens) forest in subtropical China
vol. 8, pp. 606-614 (online: 02 February 2015)
Research Articles
Carbon storage and soil property changes following afforestation in mountain ecosystems of the Western Rhodopes, Bulgaria
vol. 9, pp. 626-634 (online: 06 May 2016)
Research Articles
Effect of different dolomitic limestone dosages on soil respiration in a mid-altitudinal Norway spruce stand
vol. 12, pp. 357-365 (online: 05 July 2019)
Review Papers
Separating soil respiration components with stable isotopes: natural abundance and labelling approaches
vol. 3, pp. 92-94 (online: 15 July 2010)
iForest Database Search
Search By Author
Search By Keyword
Google Scholar Search
Citing Articles
Search By Author
Search By Keywords
PubMed Search
Search By Author
Search By Keyword

