Applying complex network metrics to individual-tree diameter growth modeling
iForest - Biogeosciences and Forestry, Volume 18, Issue 4, Pages 176-185 (2025)
doi: https://doi.org/10.3832/ifor4735-018
Published: Jul 01, 2025 - Copyright © 2025 SISEF
Research Articles
Abstract
Mathematical approaches that explain growth increments, while accounting for inter-tree competition, are advancing. As interactions between trees represent a network structure within an ecological system, they can be described by topological metrics. These metrics may support individual-tree growth modeling in line with ecological processes. Our objective was to compare the performance of traditional indices and complex network metrics in modeling diameter growth. The study area is a semi-deciduous seasonal montane forest in Brazil, where Copaifera langsdorffii was naturally dominant from 2010 to 2017. We selected this species as the subject tree in our study. Tree competitors were identified using the Bitterlich procedure (basal area factor = 4). The periodic annual diameter increment (PAId) was modeled using four strategies, including a genetic algorithm and the random forest method, which involved different competition metrics: distance-dependent, distance-independent, and semi-independent indices, as well as topological metrics from complex networks. We assessed modeling performance based on the analysis of error metrics. The approach developed using topological metrics shows strong potential to explain the PAId through a competition network within an ecological context. The innovative approach used in this study offers robust modeling to support forest growth analysis. Therefore, we encourage the application of this interdisciplinary tool to generate insights into forest science.
Keywords
Competition Indices, Tropical Forest, Random Forest, Genetic Algorithm, Feature Selection, Copaifera langsdorffii
Introduction
Understanding the dynamics of tropical forests is crucial for developing effective conservation strategies and sustainable management practices. Tropical forests are complex ecosystems characterized by a high diversity of species interactions, featuring a rich variety of trees and fauna with high levels of endemism ([48]). Given the severe risks posed by land-use changes in these global hotspots, addressing the knowledge gap in tree growth dynamics, particularly the diameter growth of tropical species, is essential for supporting restoration and sustainable production efforts. Tree size and neighborhood competition are key drivers of tree growth patterns ([61]). In this context, addressing inter-tree competition is crucial, as its intensity significantly influences the dynamics of resource availability for each tree.
Inter-tree competition quantifies spatial interactions between trees and their neighborhoods through mathematical formulas that measure the effect of the neighborhood (competitor trees) on a target or subject tree ([1], [55]). These formulas consist of competition indices derived from field data, namely, distance-dependent, semi-distance-independent, and distance-independent indices ([27]). Although these indices perform adequately, a critical issue is that all traditional approaches have limitations in capturing the effects of local variation ([27]). Moreover, there is no consensus on a superior approach due to the inherent variability of forest conditions ([8], [24]). The frontiers of science highlight new methods and data to deepen our understanding of inter-tree competition behavior, such as airborne laser scanning ([46]), spatial structure ([22]), crown area ([24]), light interception ([5]), and complex networks ([40]).
Complex network (CN) science is an interdisciplinary field that applies concepts from statistical physics, computer science, biology, and sociology ([4], [36]). CNs model systems as mathematical graphs, where nodes represent components and edges denote interactions ([2]). In forest science, pioneering studies by Nakagawa et al. ([44]) and Mongus et al. ([40]) explored the association of spatial patterns from CN metrics with tree growth and survival. Forests are natural complex systems where trees are spatially connected, forming ecological networks with heterogeneous interactions. These networks can be represented as graph structures, offering valuable insights for ecological modeling. CNs are a promising technique for effectively organizing and analyzing data from complex natural systems, revealing underlying ecological patterns driven by meaningful interactions among system components ([10]).
The novelty of the current study lies in integrating the CN approach into a feature selection procedure, using a genetic algorithm combined with random forest (GARF). GARF has proven efficient in modeling forest attributes, in terms of accuracy and selecting the most important variables ([21]). Our study moves from a background of developing models based solely on statistical assumptions to contributing valuable insights into tree diameter modeling with ecological significance. Our primary objective was to investigate whether the CN approach overcomes the limitations of traditional methods by providing a more accurate prediction of tree growth through a refined representation of the ecological interrelationships governing the competition at the individual tree level. Accordingly, our study was structured to test the following hypotheses: (i) dendrogram analyses reveal the dissimilarity between traditional competition indices and CN metrics in quantifying inter-tree competition; and (ii) incorporating CN metrics into a modeling tool (GARF algorithm) improves the predictive accuracy of tree diameter increment estimates compared to traditional competition indices.
Material and methods
Site description and tree database
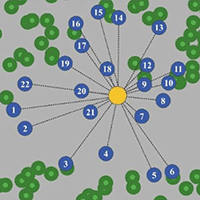
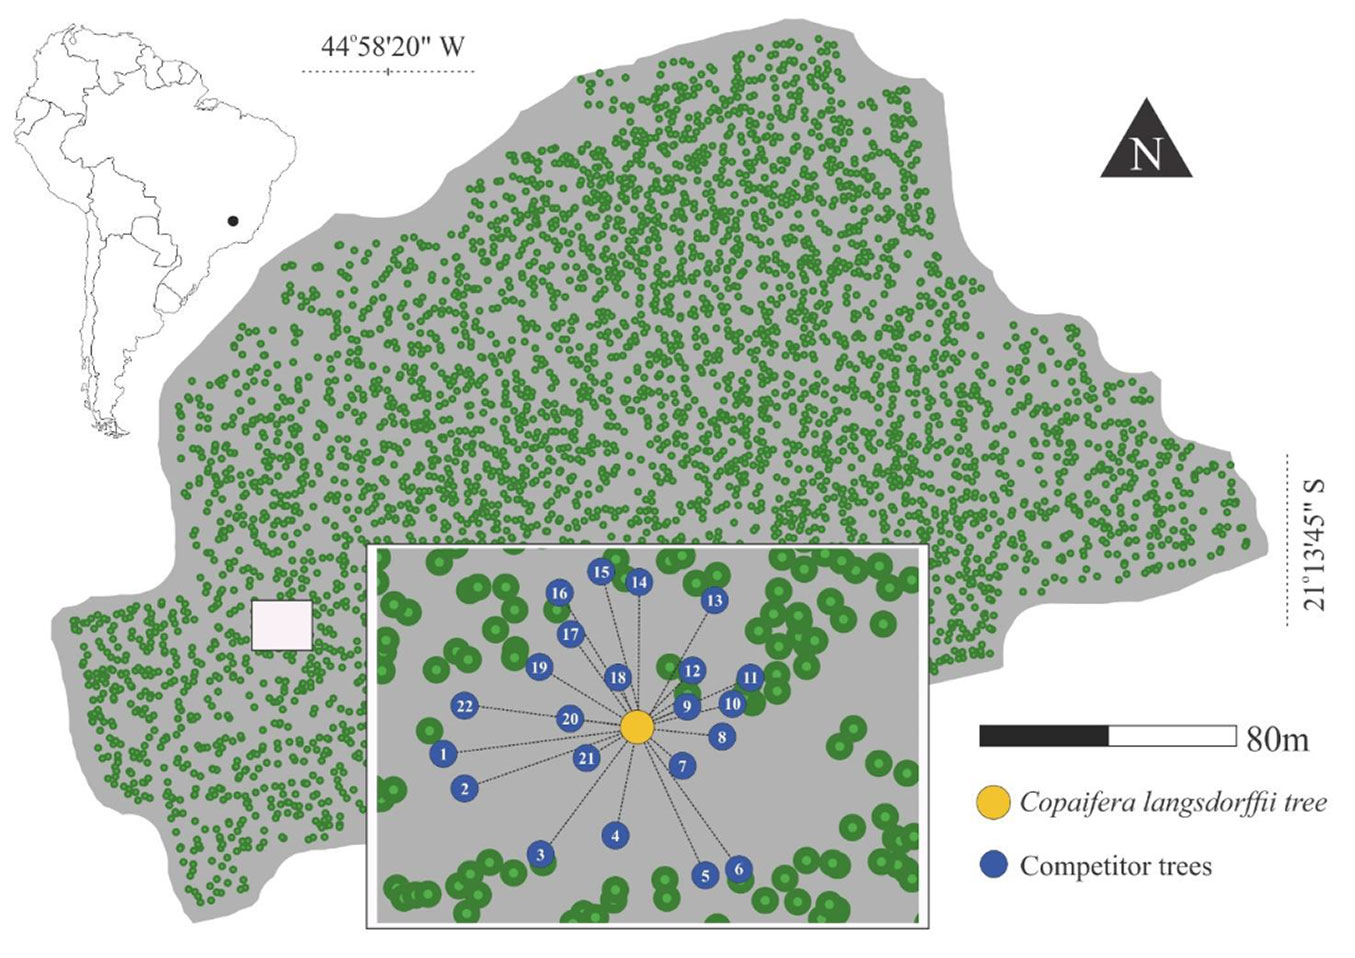
The experimental area covers 5.8 ha of a seasonal semi-deciduous montane forest located at 21° 13′ 45″ S and 44° 58′ 20″ W, approximately 930 m above sea level (Fig. 1). The soil types are mainly dystrophic Red-Yellow Argisol (PVAd) and eutroferric Red Nitosol (NVef). According to the Köppen climate classification, the area falls within a humid subtropical zone with dry winters and temperate summers (Cwb). Most of the precipitation (80%) occurs between October and March, while the dry season extends from April to September ([3]). The study forest has a long-term census program measuring trees with a diameter at breast height (DBH) of 5 cm or greater. For this study, we analyzed data from the 2010-2017 measuring period. During this interval, the stand density varied between 872 and 953 trees ha-1, and the basal area ranged from 20.7 to 23.3 m2 ha-1. Copaifera langsdorffii was selected as the subject tree species for our analysis due to its high absolute dominance (3.97 m2 ha-1) and relative dominance (17.05%) compared to the other 181 species in the study area, based on a phytosociological survey. In total, 154 C. langsdorffii trees were included in the analysis. We applied the Bitterlich method (basal area factor, BAF = 4), and the maximum distance (L = 0.5 × DBHi /√BAF) was used to define the competition buffer area around each subject tree, for both traditional and complex network approaches, to quantify inter-tree competition. To address edge effects and ensure accurate competition assessment, trees located along the boundary of the area were excluded.
Fig. 1 - Study area and the spatial arrangement of trees.
Inter-tree competition indices
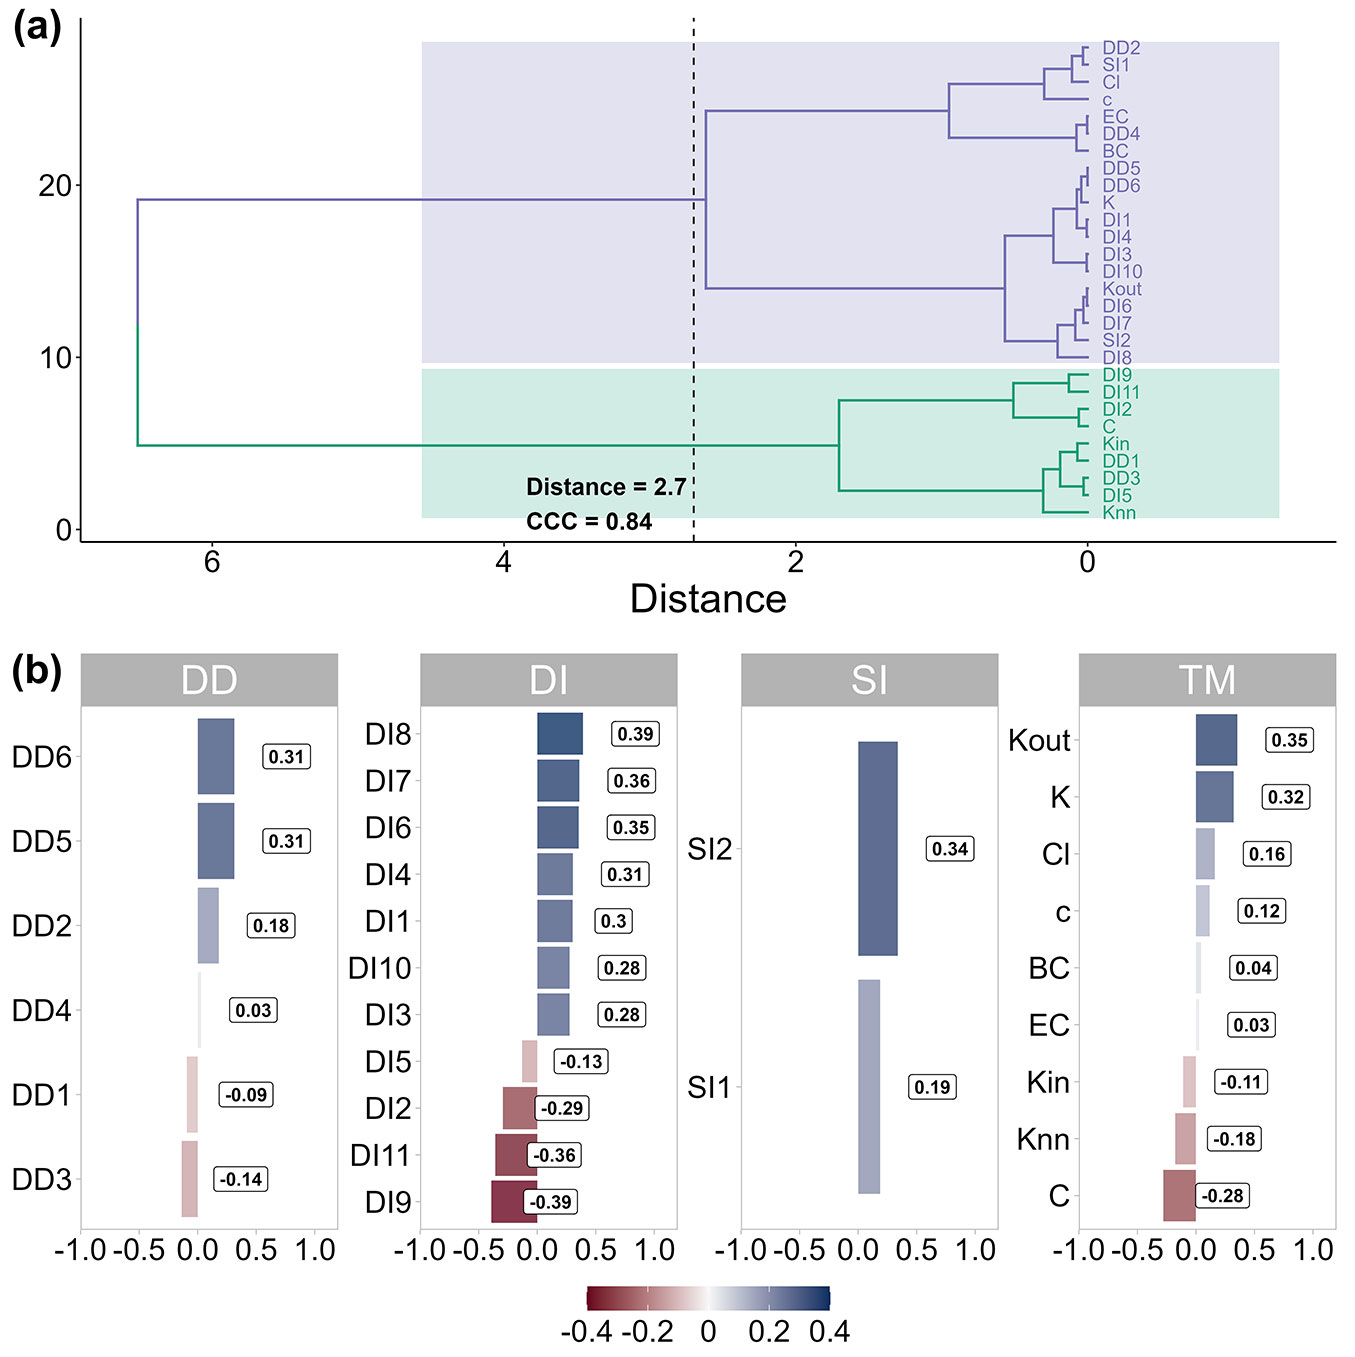
The growth rate of individual trees reflects their capacity to adapt to environmental conditions and competitive pressures over time. Competition can alter both the tree structure and the arrangement of forest canopy. In this study, we tested four strategies (three traditional competition procedures and one using complex network metrics) within individual-tree growth models. After removing inconsistent data by detecting outliers using the interquartile range method, we calculated the correlation between the competition metrics/indices and the periodic annual diameter increment (PAId). We then applied cluster analysis to compare the similarities among the competition metrics and their respective categories. The Euclidean distance was used as the dissimilarity measure to distinguish the groups, and Ward’s method was employed as the agglomerative hierarchical clustering procedure. The optimal number of clusters was determined through a visual analysis of the dendrogram, where the cut-off point was defined as the distance corresponding to the longest branches, ensuring a clear separation between merged clusters while avoiding the creation of tiny segments. Additionally, the quality of the generated clusters was validated using the cophenetic correlation coefficient (CCC), with values greater than 0.7 indicating well-formed clusters ([49]). The CCC (eqn. 1) measures the degree of fit between the similarity matrix (phenetic matrix F) and the matrix resulting from the simplification based on the clustering method (cophenetic matrix C).
Complex network metrics
We propose an inter-tree competition network, derived from complex network tools, to analyze the relationships between trees. This competition is quantified by using topological metrics from the graph structure G. In this context, complex networks characterize the spatial arrangement of individual trees. The CN is represented by a graph G = (N, E), defined by a set of nodes N ={ni} and edges E ={eij} connecting them. Each node ni denotes a subject tree, and its interaction with a competitor (nj) is established as a directed network if nodes i and j are connected. A connection between nodes occurs only when the competing tree is within the competition zone of the subject tree, which is determined by the DBH of the subject tree according to the Bitterlich method. We also incorporated a diameter-based function, √max(DBHi,DBHj)-1, to weight the edges between nodes i and j (wij). According to this function, the subject tree is influenced by the size of the largest individual.
The analysis was performed using the “igraph” package ([12]) in R software ([47]) to extract the topological characteristics of the competition network. These characteristics were used to quantitatively assess the competitive influence of neighboring trees on a given tree. A more detailed explanation of the analysis can be found in Dale & Fortin ([14]). Furthermore, Tab. S1 (Supplementary material) provides a broader ecological interpretation of the formal definitions presented in this study. Then, we extracted the most straightforward topological metric, the node degree, which defines the number of nodes connected to a given node by edges. Within the graph structure G = (N,E), N represents the total number of nodes, and aij indicates the presence (adjacency) or absence (non-adjacency) of a directed connection between nodes i and j in the graph, as defined by the adjacency matrix A. This means that the matrix element aij = 1 if there is a directed connection from node i to node j, and aij = 0, otherwise. The directed network allows the calculation of two components: the number of edges that leave node i, named kiout (out-degree, eqn. 2), and the number of nodes that arrive at node i, named kiin (in-degree, eqn. 3) ([26]). The sum of these components yields the total degree of node i (eqn. 4). The higher this value, the greater the number of connections of that node ([38]):
The weighted average nearest-neighbors’ degree (Kwnn,i) measures the probability of a given node connecting with nodes of similar or differing degrees. In other words, when nodes with a high degree have a larger probability of being connected with nodes that also have a high degree, the network has a positive correlation (assortative network). Conversely, a negative correlation (disassortative network) occurs when most of the neighbors connected to high-degree nodes have a lower degree ([60]). In weighted networks, the kwnn,i (eqn. 5) is calculated based on the normalized weight of the connecting edges, wij/si, where si (eqn. 6) is the node strength:
We also calculated the eigenvector centrality (CE) for each node, which depends on the degrees of its neighbors (eqn. 7). This metric is derived from an eigenvector of the adjacency matrix A and a constant (λ). For instance, node i, with fewer neighbors, can exert more influence in the network than node j, despite having more links, if the neighbors of node i, on average, have more connections than those of node j ([39]).
Closeness centrality (Cl) is another metric used to assess the accessibility of a given node, where dij is the distance between i and j (eqn. 8). This measure indicates a node’s centrality based on its distance from all other nodes ([29]). In this context, we measured the distance between any two nodes according to the number of edges between them ([54]). For weighted networks, this is measured based on the weights (values) applied to the edges ([58]).
We also considered coreness (c), which measures the influence of a node based on its location within the network. Nodes with high coreness are interpreted as the most central in a network ([32]). This value is determined through an iterative process of k-core decomposition ([17]), which categorizes the network into hierarchical shells from the core to the periphery ([29]). Thus, node i belongs to shell layer c(i,G) that consists of the coreness of node i (eqn. 9):
Another useful metric is the local clustering coefficient (C), which measures the density of triangles in a network. Triangles are subgraphs of the network that provide a detailed view of neighborhood interconnection (eqn. 10):
where ki is the number of neighbors of node i (degree of node i), |ε(Γi)| is the number of real edges between the neighbors of node i, and ki(ki - 1) is the maximum number of possible edges between them (i.e., the total number of triangles formed by node i - [18], [58]).
Betweenness centrality (BC) is another important centrality measure that indicates a node’s ability to control the flow of the network (eqn. 11). It functions as a bridge, connecting any two nodes via the shortest path between them. Higher BC values characterize the most central nodes in the network, which frequently occur on the shortest paths between any pair of nodes ([33]). In eqn. 11, bjh corresponds to the total number of possible minimum paths between nodes j and h, and bjh(i) represents the number of minimum paths between them that pass through node i.
Traditional competition indices
Traditional competition indices incorporate the tree size and geographic location to measure inter-tree competition, employing a range of strategies to assess competition at the individual tree level. In this study, we applied 19 indices categorized as distance-dependent, distance-independent and semi-distance-independent indices (see Tab. S2 in Supplementary material).
Tree diameter increment modeling
Several growth models have been employed to predict the annual diameter increments of individual trees over time, with inter-tree competition indices demonstrating high explanatory power ([34], [24]). In our study, the modeling process focuses on PAId as the dependent variable: PAId = (DBHe -DBHb )/R, where DBHe = DBH at the end of the evaluated growth period (cm); DBHb = DBH at the beginning of the evaluated growth period (cm); and R = the growth period. The independent variables were: DBH (cm); cross-sectional area (SA, cm2); the geographic coordinates (X and Y) at the individual tree level; traditional competition indices; and topological metrics. The modeling strategies (S) were: S1, distance-dependent (DD); S2, distance-independent (DI); S3, semi-distance-independent (SI) indices; S4, topological metrics from the complex network approach. All strategies incorporate attributes at the individual tree level.
The modeling process utilized the genetic algorithm (GA) and random forest (RF) approaches. We applied the GA to select a subset of variables during the RF training process. The GA is a stochastic search method inspired by biological and genetic theories for solving several problems ([7]). The advantage of a hybrid algorithm (GARF) is related to the reduction in model complexity ([21], [23]). Before implementation, we set tuning parameters for both algorithms for better performance: GA - population size (400); generations (10); tournament operator, crossover (0.5); mutation (0.1); stop criteria (10 generations) and RF - ntree (1500); mtry (1); nodesize (5). Data processing and computational coding were conducted using R software, v. 3.5.1 ([47]), and the “randomForest” package ([28]). The multi-objective optimization problem was defined with a fitness function (eqn. 12) aimed at reducing the number of variables and minimizing the mean quadratic error (out-of-bag). The normalized solution incorporates two terms: (i) the ratio between the out-of-bag (OOB) error and the maximum possible error calculated by preliminary tests; (ii) the ratio between the number of selected variables n and the total N. Furthermore, the importance of predictor variables was assessed based on the increment in mean square error (%IncMSE). Predictor variables with a high %IncMSE are considered the most important. Their omission implies a reduction in the model’s predictive power in terms of the MSE ([37]).
Goodness-of-fit metrics for evaluating the modeling strategies
The predictive performance of each tested model was evaluated using several criteria: R2, coefficient of determination (eqn. 13); MSE (eqn. 14); RMSE, root mean square error (eqn. 15); MBE, mean bias error (eqn. 16); and MAE, mean absolute error (eqn. 17):
In these equations, yi is the measured value of PAId for observation i and hat{y}i is the predicted value of observation i for n observations. To compare the models, a scoring procedure was applied to select the best model strategy based on a set of criteria. The scores, ranging from 1 to 4, represent accuracy, with 1 indicating the best performance and 4 the worst for each error metric. The overall index is the sum of the scores for each method, with the lowest value indicating the most accurate strategy.
Furthermore, to assess the biological consistency of the modeled tree diameter increment curves, we used the first derivative of the Chapman-Richards function (eqn. 18) as a benchmark:
where y’ is the diameter growth rate (PAId), βi represents function parameters, and x is the DBH. This function is widely applied in forest management due to its strong biological foundation and ability to describe realistic growth patterns. We used the “minpack.lm” R package ([16]) with the Levenberg-Marquardt method to fit the function, and compared its trends with the best modeling strategy selected in this study. The goal was to determine whether the proposed model maintains biological plausibility by aligning with an established reference. Ultimately, assessing both models against observed data provides the most robust evaluation of their biological consistency.
Results
Forest structure and inter-tree competition
The studied area showed no disturbance or ecological sustainability risks, showcasing a resilient stand structure characterized by diameter distribution frequencies typical of uneven-aged forests. This stand demonstrated a positive balance between ingrowth (11.12%) and mortality (3.37%). Consequently, the remaining forest reflected the natural dynamics and structure over time, highlighting its stability and sustainability.
The inter-tree competition indices and metrics exhibited contrasting trends across diameter classes. Overall, they presented a clear increasing/decreasing pattern across the diameter classes (Tab. 1). Regardless of the method, the increasing trends were predominant. The set of distance-dependent indices had similar behavior, except for the DD1 and DD3 indices. Higher values of DD2 suggest a negative effect of competitor tree size and distance on subject trees across diameter classes. However, this index does not take into account subject tree size. DD1 and DD3 demonstrated a size advantage for C. langsdorffii over its competitors as the diameter class increased. The DD5 value increased approximately 39-fold as the central diameter class expanded from 10 to 40 cm. Similarly, the DD6 value exhibited an even more pronounced increase, rising 63-fold with the same diameter class increment. This pattern highlights a stronger response of both indices to diameter class expansion, as higher values were directly associated with larger subject trees and greater distances, emphasizing the positive effect of increasing diameter class on these indices. Conceptually, lower values of these indices indicate greater competition. The semi-distance-independent indices exhibited a similar increasing trend across diameter classes (Glover and Hool index, SI2) and cross-sectional area (Stage index, SI1). Considering distance-independent indices, the Mugasha index (DI2) revealed that individuals with DBH > 15 cm had competitors with a smaller size. The Pedersen index (DI9) showed a similar trend related to the quadratic mean diameter of the plot.
Tab. 1 - The pattern of competition metrics/indices within the diameter classes for Copaifera langsdorffii. The diameter class centers refer to the following diameter intervals: 10 (5-15 cm), 20 (15-25 cm), 30 (25-35 cm), and 40 (35-45 cm).
| Index/ metric |
Diameter class center (cm) | |||
|---|---|---|---|---|
| 10 | 20 | 30 | 40 | |
| DD1 | 3.50 | 2.32 | 2.21 | 1.92 |
| DD2 | 31.95 | 50.85 | 66.35 | 78.33 |
| DD3 | 7.74 | 2.12 | 1.60 | 1.05 |
| DD4 | 1.45 | 1.57 | 1.58 | 1.55 |
| DD5 | 5.19 | 41.65 | 84.66 | 203.18 |
| DD6 | 2.79 | 31.93 | 68.49 | 174.63 |
| DI1 | 0.81 | 2.48 | 3.23 | 5.07 |
| DI2 | 1.49 | 0.62 | 0.52 | 0.39 |
| DI3 | 3.55 | 6.40 | 8.11 | 10.93 |
| DI4 | 37.10 | 143.07 | 246.86 | 446.08 |
| DI5 | 6.88 | 5.37 | 5.75 | 6.02 |
| DI6 | 0.26 | 0.56 | 0.71 | 0.87 |
| DI7 | 0.63 | 2.63 | 4.23 | 6.61 |
| DI8 | 0.64 | 1.36 | 1.70 | 2.13 |
| DI9 | 1.75 | 0.77 | 0.61 | 0.48 |
| DI10 | 0.31 | 4.14 | 10.34 | 23.81 |
| DI11 | 0.69 | 0.47 | 0.37 | 0.18 |
| SI1 | 1.23 | 8.03 | 12.64 | 28.91 |
| SI2 | 0.93 | 3.20 | 4.46 | 7.19 |
| k out | 2.88 | 10.90 | 16.72 | 29.10 |
| k in | 2.33 | 2.42 | 3.26 | 1.80 |
| k | 5.20 | 13.31 | 19.98 | 30.90 |
| C | 0.47 | 0.21 | 0.16 | 0.09 |
| c | 3.37 | 4.42 | 5.28 | 5.00 |
| C E | 2E-02 | 3E-02 | 3E-02 | 3.E-03 |
| BC | 140.93 | 184.44 | 757.91 | 431.20 |
| k nn | 8.64 | 7.87 | 9.25 | 7.80 |
| Cl | 47.22 | 108.53 | 215.03 | 309.97 |
The complex network metrics provided valuable insights into quantifying inter-tree competition by mapping spatial relationships among trees across the entire study area (Figs. S1-S9 in Supplementary material). The in-degree (kin) pattern demonstrated that individuals with DBH > 35 cm were less likely to act as competitors in network connections. Conversely, trees of intermediate size (25 cm < DBH ≤ 35 cm) exerted a greater competitive impact on other trees. As tree size increased, competitive pressure on the subject tree also gradually increased, as larger-diameter trees tended to have more competitors (kout), with their influence extending over a larger radius of competition. According to the total degree (k), the intensity of competitive interactions increased by approximately 493% as tree size increased from 5 to 45 cm. The knn evaluation indicated that smaller trees (5-15 cm) experienced higher levels of local competitive pressure compared to larger trees (35-45 cm). This suggests that smaller trees were situated in areas of greater indirect competition, reflecting a notable increase in competitive intensity as tree size decreased. The coreness (c) assumes that the pivotal trees of an ecological system are those with 25 cm ≤ DBH < 45 cm, which supports the connection of all trees. Dominant trees were sparse and spatially distant from other individuals in the network, as defined by the closeness centrality metric. The eigenvector centrality suggests that C. langsdorffii trees in the lower stratum of the forest had more competitors than the dominant trees. Clustering coefficients decreased as tree size increased, suggesting that smaller trees (5-15 cm) were located in areas with a denser competitive network, reflecting more intense local competition for resources. In contrast, larger trees (35-45 cm) were found in areas with more dispersed competition, characterized by fewer connections between local groups. Intermediate-sized trees (25-35 cm) exhibited the highest BC values, indicating their central role in connecting different competitor groups and influencing competition dynamics. Larger trees (35-45 cm) also played a key role but with slightly less prominence, suggesting that intermediate-sized trees were more strategically positioned within the competitive network.
Based on cluster analysis, we observed similar patterns between most competition indices and their linear correlation with diameter increment (Fig. 2). This analysis identified a threshold point that divided these metrics into two distinct groups, characterized by heterogeneous linear trends (positive and negative) according to the diameter increment. Our findings reveal a certain level of similarity between complex network metrics and traditional competition indices. This similarity suggests that complex network metrics can be powerfully used as traditional competition indices to corroborate information about the relationships between trees. They are also suitable for describing growth rates and the PAId. The metrics generally presented positive values of Pearson’s correlation coefficient (Fig. 2). The Stage index (DI8) exhibited the strongest positive correlation, followed by DI7, DI6, and kout. Conversely, the Pedersen (DI9), Stage-BAL (DI11), and Mugasha (DI2) indices, as well as the clustering coefficient, had the highest negative values.
Fig. 2 - Cluster analysis of competition metrics and Pearson’s correlation of PAId. (DII): distance-independent index; (DDI): distance-dependent index; (SII): semi-independent-distance index; (TM): topological metrics of the network; (SI1): Stage ([53]); (SI2): Glover & Hool ([19]); (DI1): Daniels et al. ([15]); (DI2): Mugasha ([43]); (DI3): Lorimer ([31]); (DI4): Looney et al. ([30]); (DI5): Corona & Ferrara ([9]); (DI6): Tomé & Burkhart ([57]); (DI7): Glover & Hool ([19]); (DI8): Stage ([53]) based on the quadratic mean diameter; (DI9): Pedersen et al. ([46]); (DI10): Stage ([53]) based on cross-sectional area; (DI11): Stage ([53]) based on BAL; (DD1): Hegyi ([20]); (DD2): Rouvinen and Kuuluvainen (symmetric, 1997); (DD3): Rouvinen and Kuuluvainen (asymmetric, 1997); (DD4): Martin & Ek ([35]); (DD5): Staebler ([52]); (DD6): Moore et al. ([41]); (Knn): weighted average nearest-neighbors’ degree; (EC): eigenvector centrality; (Kout): out-degree; (Kin): = in-degree; (K): total degree of the node; (c): coreness; (Cl): closeness centrality; (C): clustering coefficient; (BC): betweenness centrality.
Individual-tree diameter growth modeling performance
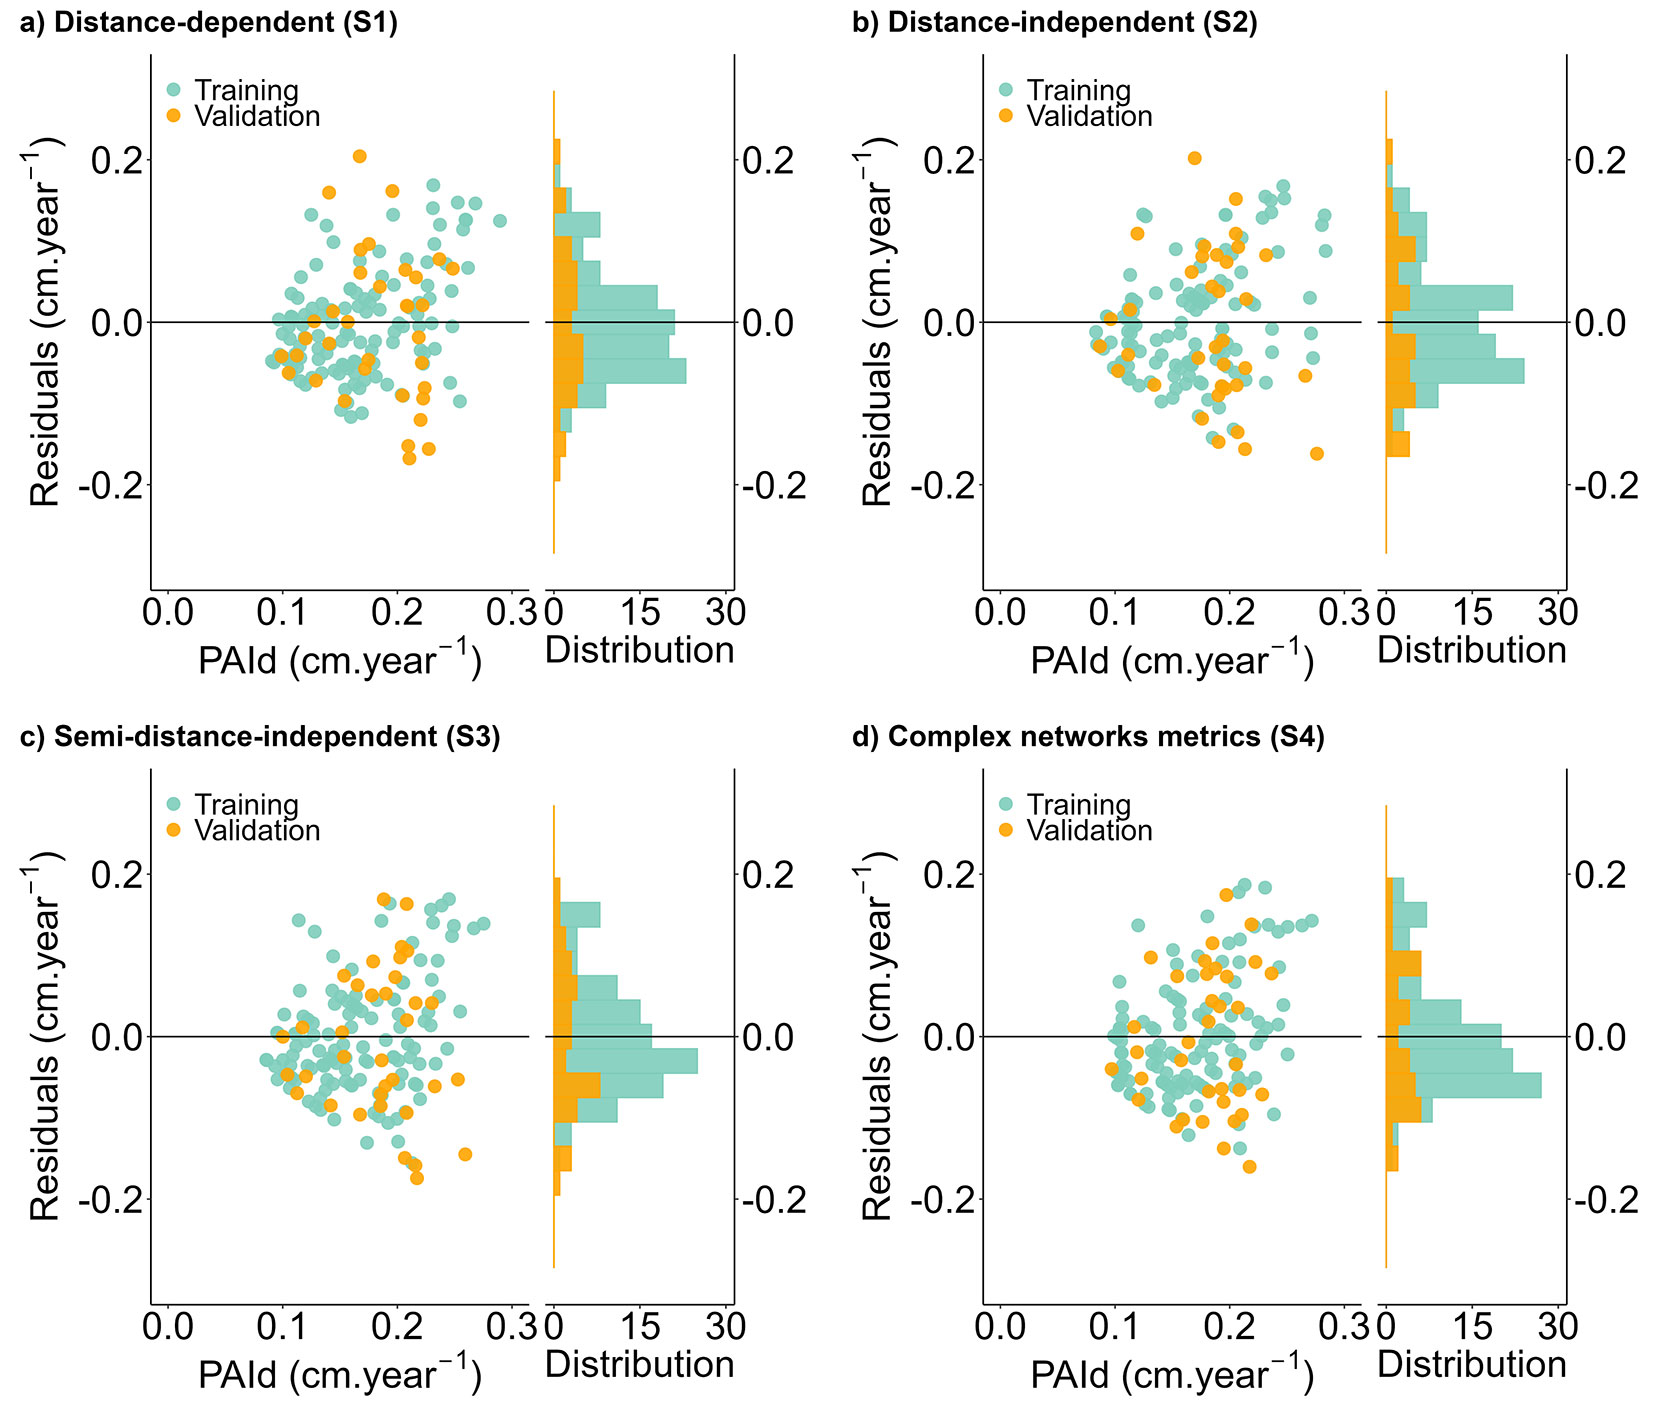
Variable selection using the random forest approach is enhanced by employing a multi-objective genetic algorithm to optimize the number of variables while minimizing errors. Our findings suggest that even the subset of individual variables at the tree level differed among the modeling strategies, revealing the importance of the interaction among all selected variables in capturing the growth pattern. Despite slight differences in precision among the tested variables, all inter-tree competition methods proved suitable for explaining individual-tree diameter growth with acceptable limitations (Tab. 2). Notably, the complex network metrics demonstrated significant advantages over traditional indices for C. langsdorffii, as evidenced by residual plot analysis (Fig. 3). However, there was a slight tendency to overestimate the PAId across all strategies based on the histogram distribution.
Tab. 2 - Statistical analysis of the periodic annual diameter increment (PAId) modeling strategies for Copaifera langsdorffii. (MSE): mean square error; (RMSE): root mean square error; (MBE): mean bias error; (MAE): mean absolute error; (R2): coefficient of determination; (n,1): scores. The sequence of numbers and letters defines the ranking scale and the optimal variable modeling strategy, respectively.
| Statistic | Traditional competition indices | Complex network metrics (S4) |
||||||
|---|---|---|---|---|---|---|---|---|
| Distance- dependent (S1) |
Distance- independent (S2) |
Semi-distance- independent (S3) |
||||||
| Training | Validation | Training | Validation | Training | Validation | Training | Validation | |
| MSE | 0.004 | 0.008 2 | 0.005 | 0.008 4 | 0.005 | 0.008 3 | 0.005 | 0.007 1 |
| RMSE | 0.065 | 0.089 2 | 0.068 | 0.092 4 | 0.071 | 0.090 3 | 0.071 | 0.086 1 |
| MBE | -0.001 | -0.007 2 | -0.001 | -0.007 3 | -0.001 | -0.010 4 | 0.000 | -0.005 1 |
| MAE | 0.052 | 0.073 1 | 0.055 | 0.080 4 | 0.057 | 0.077 3 | 0.056 | 0.076 2 |
| R 2 | 0.785 | 0.366 2 | 0.740 | 0.313 4 | 0.716 | 0.364 3 | 0.730 | 0.443 1 |
| Scores | 9 b | 19 d | 16 c | 6 a | ||||
Fig. 3 - Analysis of residuals with marginal histograms for all modeling strategies.
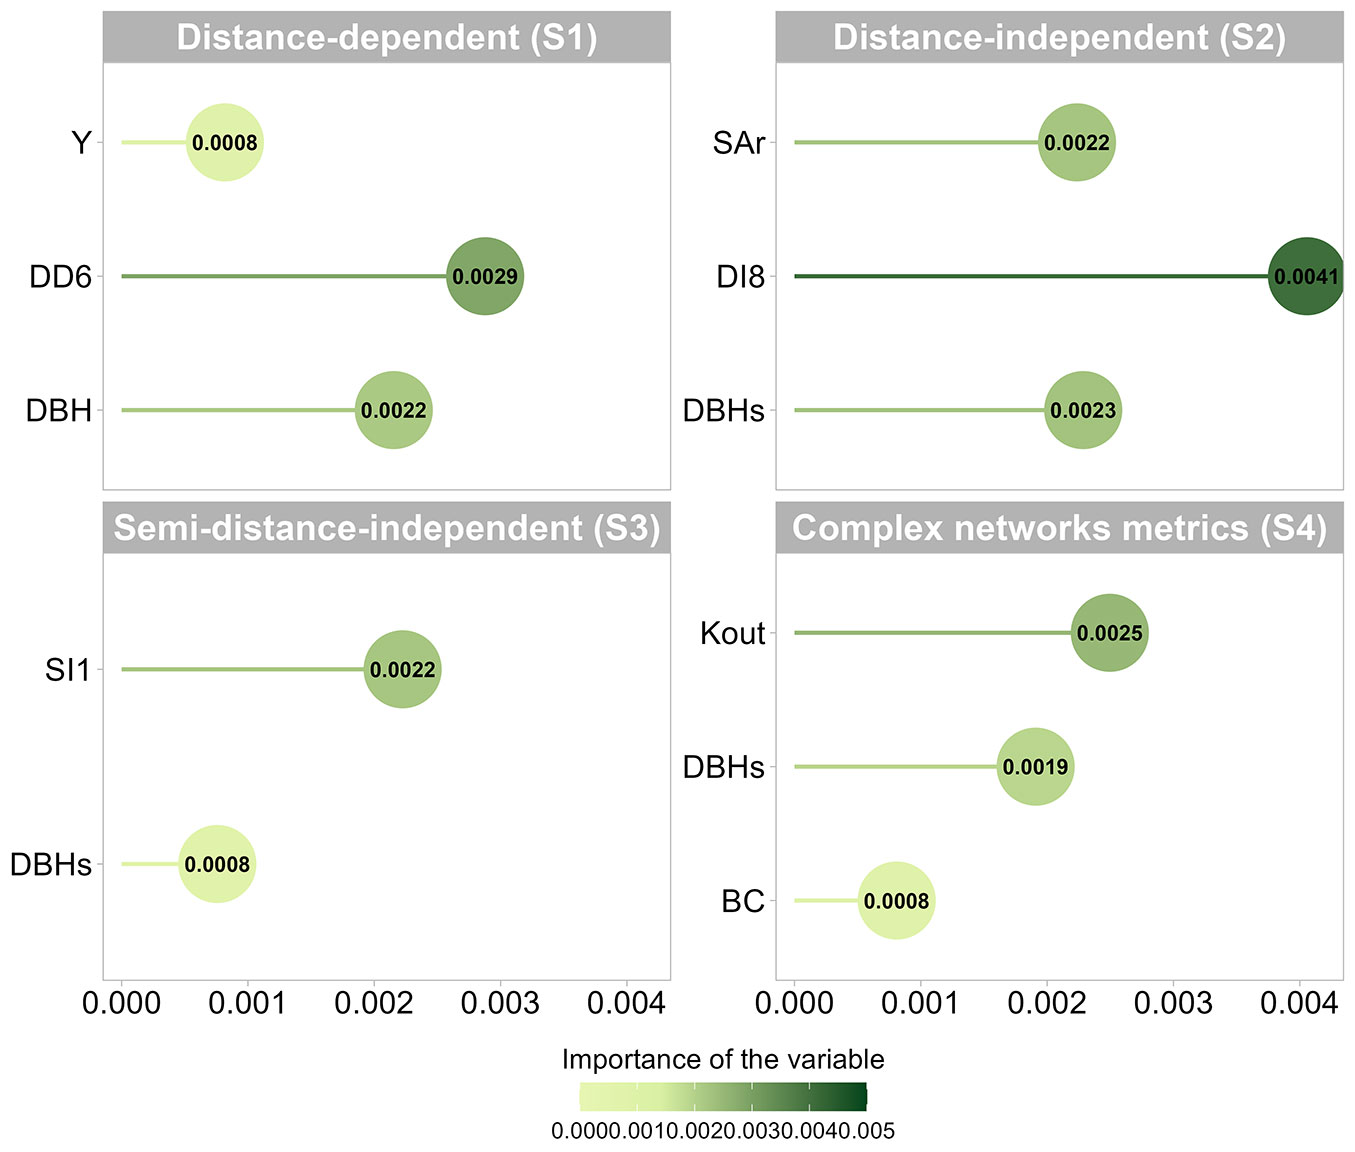
The variable selection approach included a significant advanced feature search to improve overall accuracy and reduce noise across each modeling strategy, resulting in distinct subsets (Fig. 4). Generally, the most relevant variables were chosen to improve prediction outcomes in a multi-objective form. Our findings revealed an average reduction of 83% in the selected variables. Local site conditions may influence growth rates, as latitude (the Y coordinate) was selected for the distance-dependent strategy (S1). The DBH is usually a primary input for a range of growth models and biological processes. This variable was selected in all modeling strategies, even indirectly, since it incorporates the Moore index (DD6) and Stage index (DI8), with minor differences in importance between S1 (distance-dependent) and S2 (distance-independent). However, topological metrics from the network, such as kout and BC, were selected over others and demonstrated superior estimation capabilities for C. langsdorffii. These metrics effectively captured the negative impacts of competitors on subject trees by associating their spatial distribution and neighborhood density with the dynamics of tree growth.
Fig. 4 - Analysis of the importance of selected variables for each modeling strategy. (Y): geographic coordinate (latitude); (SAr): square root of the cross-sectional area; (DBHs): square of DBH; (DD6): Moore et al. ([41]); (DI8): Stage ([53]) based on the quadratic mean diameter; (SI1): Stage ([53]); (BC): betweenness centrality; (Kout): out-degree.
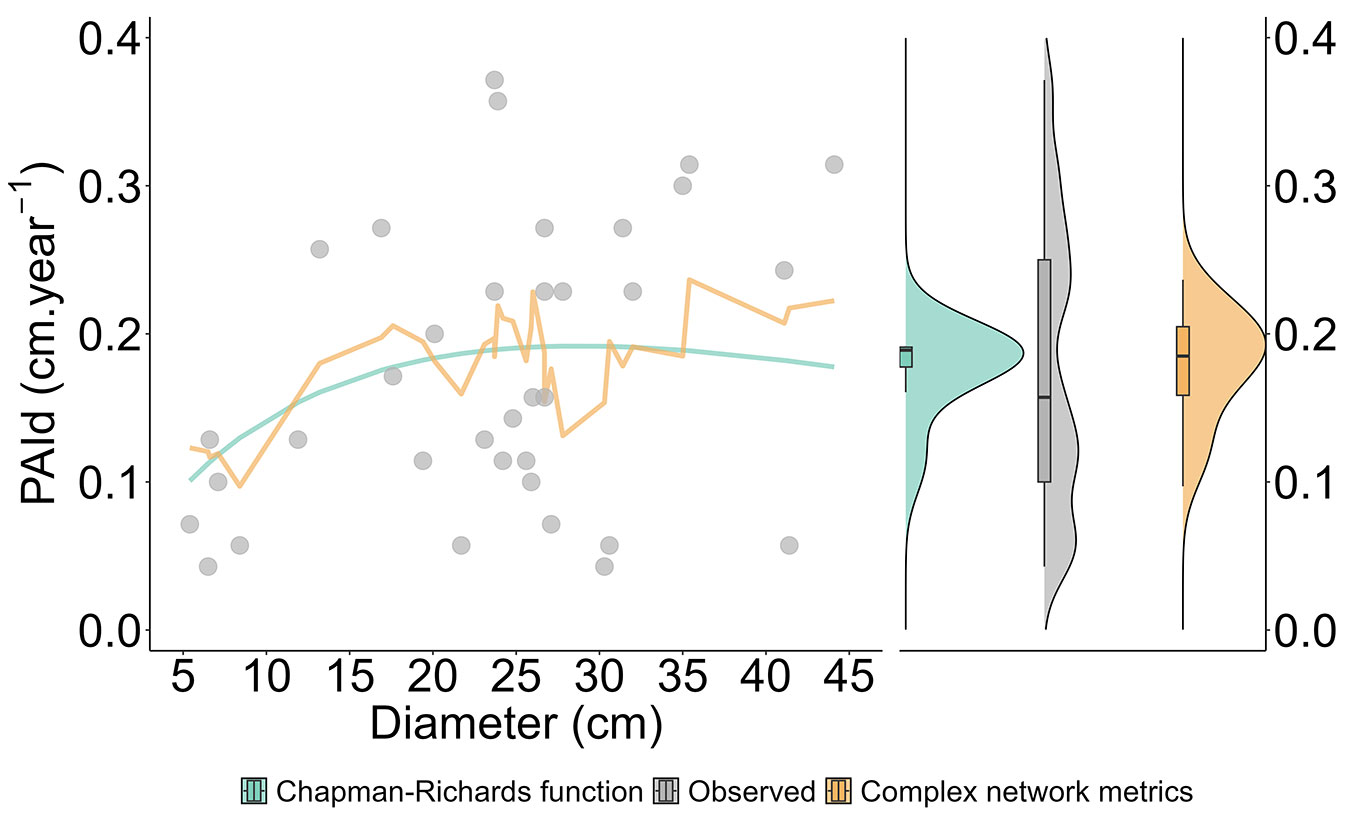
The benchmark analysis of accuracy and biological consistency indicated a positive response to the complex network metrics (Fig. 5). Incorporating these variables yielded graphical results that visually outperformed the Chapman-Richards function, which had parameters β1 = 18.57332, β2 = 0.01952, and β3 = 1.75503. The individual-tree growth predictions of observed data (validation set) indicated a significant effect of the interaction between kout, the square of DBH, and BC in capturing growth patterns. These curves validate that incorporating inter-tree competition as an additional factor, enhances our ability to explain biological patterns, and confirms the robustness of the selected variables. The competition effects quantified by complex network metrics more consistently approximated the natural distribution and orientation of the real growth data than the Chapman-Richards function.
Fig. 5 - Predicted increment using the Chapman-Richards function and complex network (S4) within the validation dataset.
Discussion
Individual-tree growth models rely heavily on competition indices widely documented in the literature. The diverse competitive abilities, growth rates, and shade tolerance levels among species require specific adaptation mechanisms, which in turn influence their behavior patterns ([25]). Defining the competitive abilities of individual trees for natural resources (light, water, and nutrients) remains a persistent challenge in forestry, particularly in highly diverse tropical forests.
The dimensional characteristics of trees, such as DBH and SA, reflect forest development and play a crucial role in determining their growth potential. Our study revealed that DBH and SA were the most influential factors in predicting growth. Crown attributes and competition also significantly contribute to diameter growth ([13]). These factors are considered modifiers of potential growth, as they account for the nature of the interactions between trees. Indeed, integrating variables that quantify competition into individual-tree modeling is crucial for enhancing predictions of tree dimensions and the dynamics of tree growth ([6]). The sensitivity of C. langsdorffii trees to competition is confirmed by the moderate linear associations between most competition indices/metrics and PAId. The indices with the strongest positive and negative linear associations were the Stage index (DI8) and the Pedersen index (DI9), respectively. Although these indices are structurally different, both commonly incorporate the quadratic mean diameter of the plot. This whole-stand variable, when incorporated in distance-independent competition measurements, corresponds to the hierarchical position of the subject tree within the plot ([42]). A similar relative dimension (ratio) used by DI8 was evaluated in the study of Sharma et al. ([50]), which showed an increase in the diameter increment of Fagus sylvatica L. with reduced competition, as expressed by an increase in the ratio between the DBH and the quadratic mean diameter.
C. langsdorffii trees face intense competition as they strive for canopy dominance by investing in height and forming symmetrical crowns ([11]). This situation is consistent with that observed in the study by Stadt et al. ([51]) in mature boreal mixed forests, where competition indices were less effective for shade-intolerant species compared to shade-tolerant ones. The authors attributed this finding to the majority of shade-tolerant species being in the sub-canopy, thus experiencing a greater variety of competition. Therefore, it is advisable to test various competition indices to enhance model performance. In this regard, our comparative approach of different competition indices/metrics demonstrated that a complex network design could better represent competition patterns. Our findings suggest that the network structure addresses inter-tree competition in a more natural and interpretable way, providing slight superiority in accounting for the effect of competition on the PAId of C. langsdorffii. As a result, the competition metrics that exhibited the greatest improvements in growth estimates were the topological metrics.
Another significant finding revealed a notable pattern, with the strategy based on distance-dependent indices (S1) emerging as the second-best strategy for C. langsdorffii. This result is supported by the effect of neighborhood interactions on diameter growth, which supports the efficiency of spatial indices as predictors in growth modeling ([34]). In this context, the complex network is also a promising alternative for representing distance dependence, allowing for the examination of the spatial distribution patterns of individual trees ([40]). The statistical properties of a competition network structure help understand plant population dynamics ([44]). Mongus et al. ([40]) reported that clusters and betweenness centralities have a greater influence on tree development than commonly used parameters, such as the number of competitors per tree and the distance between them. Betweenness centrality was one of the variables selected as a predictor of diameter increment in C. langsdorffii individuals, contributing to the greater precision of the S4 strategy. This metric signifies the greater importance of trees with higher participation in the set of competitors for other trees, influencing the dynamics of competition between groups. Therefore, our results reinforce that merely counting the number of competitors for an individual tree is insufficient to capture the full effect of competition on its development pattern within a forest.
Modeling individual-tree PAId is a challenging task due to the interaction of several factors. Two primary reasons driving advances in this area are (i) the need for more accurate quantification of competition, as it is required for developing growth and production models at the level of individual trees ([8]), and (ii) the difficulty in modeling the complex and non-linear nature of individual-tree growth ([59]). In this study, we developed modeling strategies based on the RF regression method. This model is notable for its ability to handle the non-linear relationship between predictor variables and the response variable without requiring statistical assumptions ([45]). The application of RF has increased due to its efficiency in providing reliable estimates, as demonstrated by Ou et al. ([45]) and Tavares Júnior et al. ([56]). Additionally, using a GA together with RF, known as optimized RF, offers the opportunity to generate better results by selecting the optimal combination of variables ([21]). Our findings showed that the adequacy of strategies is associated with the importance of choosing an optimized set of competition indices/metrics and forest attributes to improve growth estimates. Notably, machine learning techniques are not always sensitive to the local structure of the data, and these algorithms did not consistently choose the ideal set of variables ([23]). Thus, the estimates provided by the RF regression in each modeling strategy may vary, depending on the preliminary variable selection task conducted through a random search by the GA.
Another way to improve estimates is to better explore the effect of variables that significantly contribute to understanding the response variable. Complex networks offer the advantage of a flexible structure that enable to include information describing the complex interactions between trees. It is possible to incorporate characteristics, such as shade tolerance, aspects of soil, climate, water, and solar availability, into the network as interaction weights using large datasets. This approach enables the analysis of various scenarios corresponding to silvicultural treatments ([40]). Therefore, this study promotes scientific progress beyond the existing literature to meet the need for developing growth and production models at the tree level, facilitating more precise decision-making for forest management.
Conclusion
The resilience of tropical forests is highly dependent on the diametric structure over time, with each tree having adaptive mechanisms to overcome the adverse effects of competition. In general, tree species exhibit a wide range of interactions that influence diameter growth patterns, as observed in C. langsdorffii. The PAId is closely associated with neighborhood size, the spatial distribution of competing trees, tree size, or canopy stratum position, and their connections within a network structure. All categories of inter-tree competition indices/metrics are suitable for modeling our dependent variable. Although the Chapman-Richards growth function is prominent in forest management, the optimized model (genetic algorithm + random forest) combined with complex network metrics proved superior in describing the individual growth rate of tree diameter. This finding supports the applicability of complex network metrics to encompass ecological significance and enhance the generalization of growth models.
Acknowledgements
The authors are especially grateful to the Coordenação de Aperfeiçoamento de Pessoal de Nível Superior (CAPES, Brazil) for the financial support under Finance Code 001, Federal University of Lavras (UFLA, Brazil) for providing the data, and Forest Management Laboratory (LEMAF, Brazil) for helping in field campaigns. Lucas R. Gomide is grateful for the support from CNPq (Grant no. 304572/2021-7). Angélica S Mata is grateful for the support from FAPEMIG/CNPq (Grant no. APQ-06591-24).
Authors’ contribution
ILL contributed to conceptualization, methodology, mathematical programming and software, data curation and statistical analysis, investigation, visualization, writing - original draft preparation, review, and editing; ASM co-conceived the study and contributed to conceptualization, methodology, project supervision, writing - review, and editing; RVOC contributed to writing - review and editing; CSJS provided support for writing - review and editing; KJVP contributed to writing - review, and editing; and LRG co-conceived the study and contributed to conceptualization, methodology, project administration, supervision, writing - review, and editing.
References
Gscholar
CrossRef | Gscholar
CrossRef | Gscholar
Gscholar
Gscholar
Authors’ Info
Authors’ Affiliation
Kalill José Viana da Páscoa 0000-0002-5786-1501
Carolina Souza Jarochinski e Silva 0000-0003-1545-1536
Lucas Rezende Gomide 0000-0002-4781-0428
Federal University of Lavras - UFLA, Department of Forest Sciences, Lavras, Minas Gerais (Brazil)
Federal University of Lavras - UFLA, Physics Department, Lavras, Minas Gerais (Brazil)
Federal University of São João del-Rei - UFSJ, Department of Forest Engineering, Sete Lagoas, Minas Gerais (Brazil)
Corresponding author
Paper Info
Citation
Leite e Lopes I, Sousa da Mata A, Oliveira Castro RV, Viana da Páscoa KJ, Souza Jarochinski e Silva C, Rezende Gomide L (2025). Applying complex network metrics to individual-tree diameter growth modeling. iForest 18: 176-185. - doi: 10.3832/ifor4735-018
Academic Editor
Marco Borghetti
Paper history
Received: Sep 28, 2024
Accepted: Mar 24, 2025
First online: Jul 01, 2025
Publication Date: Aug 31, 2025
Publication Time: 3.30 months
Copyright Information
© SISEF - The Italian Society of Silviculture and Forest Ecology 2025
Open Access
This article is distributed under the terms of the Creative Commons Attribution-Non Commercial 4.0 International (https://creativecommons.org/licenses/by-nc/4.0/), which permits unrestricted use, distribution, and reproduction in any medium, provided you give appropriate credit to the original author(s) and the source, provide a link to the Creative Commons license, and indicate if changes were made.

Web Metrics
Breakdown by View Type
Article Usage
Total Article Views: 6768
(from publication date up to now)
Breakdown by View Type
HTML Page Views: 3109
Abstract Page Views: 1588
PDF Downloads: 1912
Citation/Reference Downloads: 1
XML Downloads: 158
Web Metrics
Days since publication: 376
Overall contacts: 6768
Avg. contacts per week: 126.00
Article Citations
Article citations are based on data periodically collected from the Clarivate Web of Science web site
(last update: Mar 2025)
(No citations were found up to date. Please come back later)
Publication Metrics
by Dimensions ©
Articles citing this article
List of the papers citing this article based on CrossRef Cited-by.
Related Contents
iForest Similar Articles
Review Papers
Genetic diversity and forest reproductive material - from seed source selection to planting
vol. 9, pp. 801-812 (online: 13 June 2016)
Research Articles
Preliminary study on genetic variation of growth traits and wood properties and superior clones selection of Populus ussuriensis Kom.
vol. 12, pp. 459-466 (online: 29 September 2019)
Research Articles
Seedling emergence capacity and morphological traits are under strong genetic control in the resin tree Pinus oocarpa
vol. 17, pp. 245-251 (online: 16 August 2024)
Research Articles
Age trends in genetic parameters for growth and quality traits in Abies alba
vol. 9, pp. 954-959 (online: 07 July 2016)
Research Articles
Stability analysis and selection of optimal Eucalyptus urophylla × E. grandis families
vol. 18, pp. 293-300 (online: 20 October 2025)
Research Articles
Comparison of drought stress indices in beech forests: a modelling study
vol. 9, pp. 635-642 (online: 06 May 2016)
Research Articles
Hemlock woolly adelgid niche models from the invasive eastern North American range with projections to native ranges and future climates
vol. 12, pp. 149-159 (online: 04 March 2019)
Research Articles
Estimation of above-ground biomass using machine learning approaches with InSAR and LiDAR data in tropical peat swamp forest of Brunei Darussalam
vol. 17, pp. 172-179 (online: 17 June 2024)
Research Articles
Patterns of genetic variation in bud flushing of Abies alba populations
vol. 11, pp. 284-290 (online: 13 April 2018)
Research Articles
Genetic diversity of core vs. peripheral Norway spruce native populations at a local scale in Slovenia
vol. 11, pp. 104-110 (online: 31 January 2018)
iForest Database Search
Google Scholar Search
Citing Articles
Search By Author
- I Leite e Lopes
- A Sousa da Mata
- RV Oliveira Castro
- KJ Viana da Páscoa
- C Souza Jarochinski e Silva
- L Rezende Gomide
Search By Keywords


