Estimation of above-ground biomass using machine learning approaches with InSAR and LiDAR data in tropical peat swamp forest of Brunei Darussalam
iForest - Biogeosciences and Forestry, Volume 17, Issue 3, Pages 172-179 (2024)
doi: https://doi.org/10.3832/ifor4434-017
Published: Jun 17, 2024 - Copyright © 2024 SISEF
Research Articles
Abstract
Forest above-ground biomass (AGB) is one of the critical measures of forest resources. Therefore, it is crucial to identify a reliable method to estimate the AGB, especially in the tropics, where forest ecosystems are exposed to several depleting factors, including deforestation, climate change and replacing natural forests with palm oil tree plantations. We investigated the digital elevation data over the forest and uses an artificial intelligence-based approach to develop a method for quick and cost-effective assessment of the AGB. The study was conducted in the tropical peatland rainforest of Brunei Darussalam. The Shuttle Radar Topography Mission (SRTM) elevation data product and Light Detection and Ranging (LiDAR) digital elevation data were used. A linear regression (LR) model and three different machine learning (ML) algorithms, i.e., Random Forest (RF), Artificial Neural Network (ANN) and Support Vector Machines (SVM), were tested and compared. As model inputs, the SRTM elevation and distance from the peat dome’s center, a feature of a peatland swamp forest, were used. ML methods were trained on the samples taken from the LiDAR elevations. The validation results showed that the SVM was the best method to predict AGB in the study area with R2 = 0.70, RMSE = 83.65 Mg ha-1, and MAE = 74.43 Mg ha-1, which in relative terms corresponds to approximately 6% of the AGB of the forest of interests. This study demonstrated the potential of ML algorithms in AGB estimation based on canopy height derived from the InSAR-based DEM in tropical forests.
Keywords
Above-Ground Biomass, Machine Learning, Tropical Forest, InSAR, Badas Peatland Forest
Introduction
The Food and Agriculture Organization (FAO) defines Forest above-ground biomass (AGB) as “all living biomass above the soil, including stem, stump, branches, bark, seeds, and foliage”. Forest AGB is one of the critical measures of forest resources. Tropical forests cover 45% of the world’s total forest area and provide about one-fifth of the global carbon stock ([16], [29]). A more accurate estimate of forest AGB at various scales is needed to quantify the greenhouse gas emissions caused by deforestation and forest degradation ([26]). Generally, field-based measurements and remotely sensed techniques are used to estimate AGB. Field-based methods provide the most accurate AGB values but have limitations, such as being labor-intensive, costly and time-consuming for large-scale projects ([20]). In addition, tropical forests contain obstacles to field-based tree height estimation, including dense understory vegetation and closed-canopy conditions ([16]). Due to these characteristics, remote sensing methods have proven to be more accurate for monitoring and measuring forest biomass. Different remotely sensed data types can be used for forest AGB estimation, including active sensors such as LiDAR and InSAR, which can penetrate the vegetation canopy, thus representing valuable tools for AGB assessments.
AGB can be estimated using parametric and nonparametric methods. Allometric models are widely used to build AGB models, though they cannot completely capture the complex heterogeneous landscapes in which multiple environmental variables impact the spatial distribution of AGB ([8]). Many different prediction models other than allometric models are available to measure AGB, including spatial statistical and ML models. LR model is widely reported in the literature as suited for AGB estimation ([19], [40]). LR assumes a linear relationship between AGB and remote sensing predictive variables. AGB may not be linearly related to remote sensing variables, so AGB estimation using LR has problems of underestimation/overestimation for larger and smaller AGB values ([25]). To solve this problem much research has shifted to investigating the use of nonparametric algorithms. With advances in the modeling of non-linear systems and the development of computer science techniques, ML methods have become widespread. ML algorithms are an alternative to parametric methods in handling heterogeneous data, such as describing tropical forests ([29]). Due to the complex relationships for AGB prediction, nonparametric ML approaches represent potentially helpful methods to predict AGB ([28], [12], [29], [39], [44], [33]). LR model is straightforward and less experienced users may prefer this parametric method due to the complexity of using ML models ([37]).
Selecting suitable variables from satellite and in situ data is essential for AGB modeling. Several studies used various parameters, such as vegetation indices, texture indices, multispectral bands, LiDAR metrics, topographic variables, or a combination, to estimate AGB by ML algorithms. For instance, Ghosh & Behera ([12]), in a study conducted in a tropical forest in India, considered SAR, texture and vegetation indices to estimate AGB. Chen et al. ([6]) used ML algorithms to estimate biomass using texture characteristics, vegetation indices, multispectral bands, and vegetation biophysical variables. They found that vegetation biophysical variables and texture characteristics were the most suitable predictors. Dang et al. ([9]) applied a combination of 11 spectral and texture variables to estimate the AGB of Yok Don National Park in Vietnam. Kappas ([20]) considered 52 variables, including vegetation indices, topography and textures, to predict AGB using the RF algorithm. He found that combining topography and vegetation indices presents the highest prediction score. Chen et al. ([7]) used multispectral reflectance, vegetation indices, vegetation biophysical, topographical indicators and texture variables as predictors for AGB estimation. The results showed that multispectral variables were the best predictors, and topographic variables were more important than texture features. Further, LiDAR-derived metrics were used by Marchesan et al. ([29]) and Rex et al. ([36]) to estimate AGB in tropical forest areas.
A variety of ML algorithms have been used to predict AGB, including random forest (RF - [28], [12], [20]), artificial neural network (ANN -[6], [39]), maximum entropy (MaxEnt - [38], [44]), Gaussian process (GP - [41], [32]), multivariate adaptive regression splines (MARS - [2], [44]), K-nearest neighbour (KNN - [36], [43]) and support vector machine (SVM -[13], [6], [8]). The most popular nonparametric methods include ANN, RF, and SVM, which have been used in many studies to estimate canopy height and biomass by integrating remotely sensed and in situ data ([7], [9], [26], [36], [39], [40], [27]). However, the predicting power of these methods have not yet been explored in the context of Brunei Darussalam’s tropical forests, including the country’s pristine Badas peatland forest. This study is the first to use ML methods to estimate the AGB of the study area. We evaluated the performance of an LR model and three ML algorithms, RF, ANN and SVM, for extrapolating AGB by exploring the information content of the InSAR and LiDAR data. The approach of this study brings new insights to evaluate the best method for estimating AGB at a large scale using free DEM data in the peat swamp tropical forests of Brunei.
Materials and methods
Area of interest
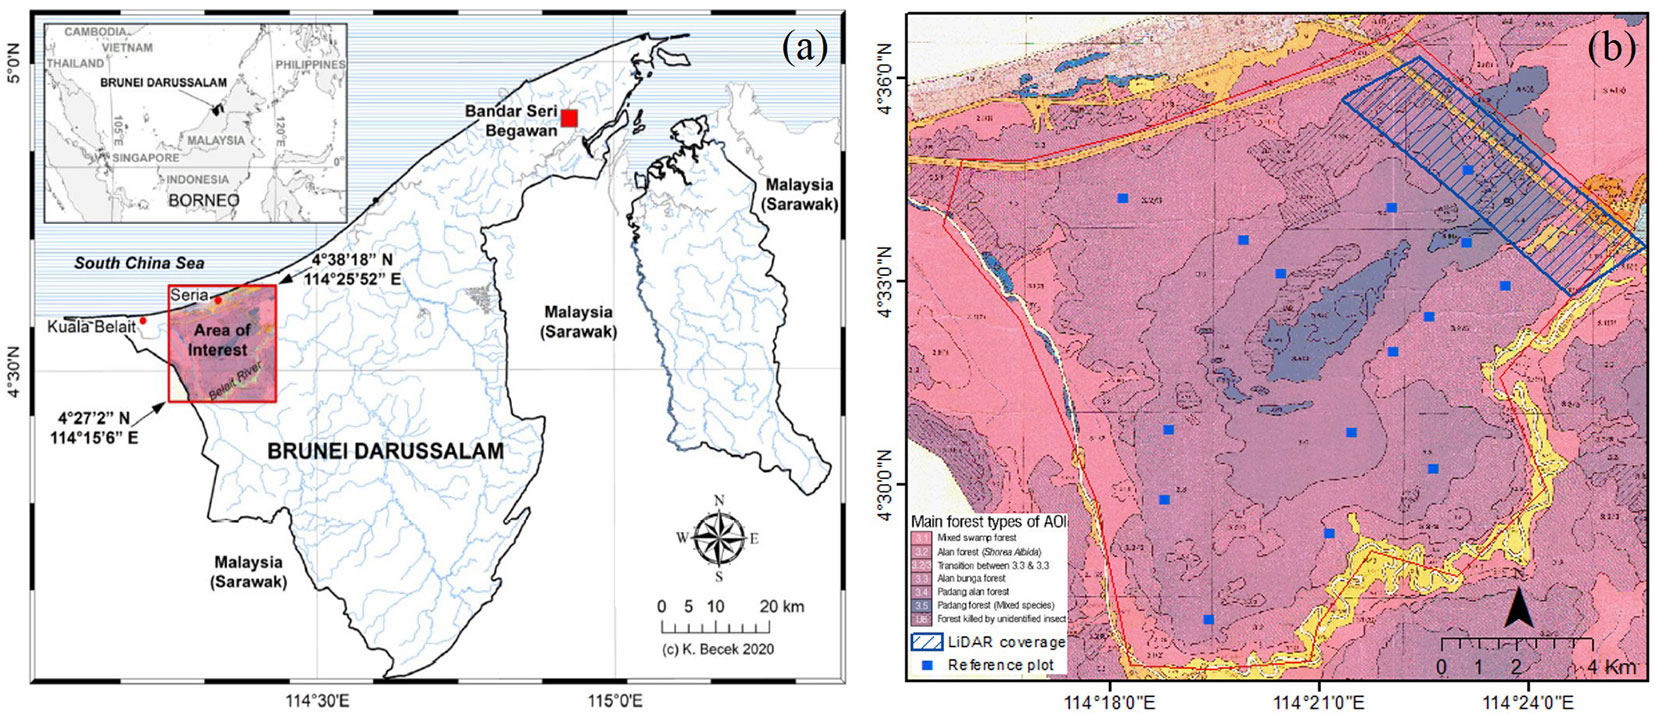
The Badas wet tropical peat swamp forest was selected as the area of interest (AOI). The geographic coordinates of the AOI are 114° 15′ 06″ E, 04° 27′ 02″ N (SW corner) and 114° 25′ 52″E, 04° 38′ 18″ N (NE corner). Brunei Darussalam, a tiny Islamic Sultanate, is situated northwest of Borneo. The Inter-Tropical Convergence Zone (ITCZ) fluctuation strongly affects Brunei’s climate, producing Northeast and Southwest monsoons. Annual rainfall is 2500-4500 mm, with the driest period occurring in February-March ([3]). The AOI covers a large part of the Badas peat swamp forest located in the western section of Brunei Darussalam (Fig. 1a). It borders to the South and West the Belait River and a highway to the North, serving Seria and Kuala Belait’s coastal oil towns. The interior of Badas forest is not accessible by road or footpath. The Badas peatland formed following the Holocene sea-level drop of approx. 5.000 years ago. It has a convex or domed shape. The peat in Badas swamps is described as a sapric type, composed of slightly decomposed or partially decomposed forest debris, and displaying very dark grey to dark reddish-brown hues ([3]). The forest’s dominant species is the “Alan” (Shorea albida, Dipterocarpaceae). The surface area of the AOI is approximately 10.000 ha. The terrain is flat without any significant relief features. The approximate elevation of AOI is 5-10 m a.s.l.
Data
LiDAR data
The LiDAR survey was conducted using the Riegel Lidar Scanner LMS-Q680i at 15 pts m-2 on 18 March 2018 from 550 m above the terrain. The height is referenced to the mean sea level datum. The AOI was partially covered by the LiDAR survey, as depicted in Fig. 1b. In addition, a LiDAR-derived digital terrain model (DTM) was available for the entire AOI at a spatial resolution of 20 m. The DTM was resampled to match the SRTM (30 m) resolution. This DTM was generated from a LiDAR survey of the country conducted in 2009. The approximate vertical accuracy of the DTM is 0.3 m.
SRTM data
The Shuttle Radar Topography Mission (SRTM) elevation data was generated using the InSAR method from the data captured using the C-band (wavelength = 5.6 cm) SAR instrument flown onboard the NASA Space Shuttle Endeavour in February 2000. SRTM covers the Earth’s land surface from latitude 56° S to latitude 60° N. Hence, SRTM covers 80% of the global land area. In 2014, v3 SRTM data was released ([17], [14]). The spatial resolution of the SRTM is 1-arcsecond (~30 m). The vertical accuracy of the SRTM data in flat terrain is approx. 2 m (one sigma). A peculiarity of the SRTM data (as any InSAR-derived elevation data) is the elevation bias over forested areas. As it was found, the magnitude of the elevation bias depends on the forest/biomass density, microwave band used, and forest canopy height. The SRTM elevation bias is explored here as it contains the biomass signal of interest.
Forest inventory data
To date, information on the vegetation composition and condition in the Badas peat swamp forest was collected during the National Forest Inventory (NFI), conducted in 1980-1983, using aerial photography at 1:25.000 scale and a limited number of in situ field measurements. This study used a set of 15 field plots 200 × 200 m each. At every plot, all trees with a diameter at breast height (DBH, 1.3 m) of ≥ 40 cm were recorded. There is no NFI information on the timber volume of trees with a reference diameter of < 40 cm. The NFI does not provide data on biomass. The “AGB from NFI” column in Tab. 1 indicates the AGB calculated from the NFI ([3]). For plots of interest, the AGB was calculated by extracting relevant forest inventory data such as the number of trees, timber density, total height and merchantable timber volume data. The essential details of the plots are shown in Tab. 1. In addition, Fig. 1b shows a copy of the forest inventory map ([1]) including the reference plot locations.
Tab. 1 - Selected reference plots data from ([1]). Coordinates are in WGS84 and projected to UTM 50N. (*): 3.4, 3.3 and 3.2/3 indicate the forest types of Padang Alan relatives, Alan Bunga forest, and Transitional between Alan and Alan Bunga forests, respectively.
| Plot ID | Forest type* |
E (m) | N (m) | Basal area (m2 ha-1) |
No. trees ha-1 |
AGB from NFI (Mg ha-1) |
|---|---|---|---|---|---|---|
| 10 | 3.4 | 209815 | 506522 | 32.00 | 86.0 | 727.3 |
| 13 | 3.4 | 207820 | 505500 | 28.00 | 86.0 | 560.0 |
| 14 | 3.2/3 | 200689 | 505753 | 23.20 | 43.0 | 552.1 |
| 15 | 3.4 | 209782 | 504544 | 24.70 | 86.0 | 483.0 |
| 16 | 3.3 | 203881 | 504611 | 33.30 | 71.4 | 803.2 |
| 18 | 3.2/3 | 210802 | 503372 | 22.47 | 43.0 | 581.7 |
| 19 | 3.4 | 204870 | 503689 | 20.00 | 86.0 | 482.3 |
| 23 | 3.2/3 | 208809 | 502549 | 20.80 | 43.0 | 447.3 |
| 27 | 3.2/3 | 207837 | 501577 | 24.00 | 43.0 | 491.8 |
| 33 | 3.4 | 206757 | 499397 | 32.00 | 86.0 | 895.3 |
| 34 | 3.3 | 201902 | 499465 | 30.00 | 71.4 | 715.5 |
| 37 | 3.3 | 208917 | 498391 | 30.00 | 71.4 | 728.7 |
| 39 | 3.3 | 201785 | 497553 | 36.00 | 71.4 | 848.4 |
| 40 | 3.3 | 206145 | 496633 | 27.00 | 71.4 | 523.9 |
| 45 | 3.3 | 202965 | 494269 | 17.00 | 71.4 | 380.8 |
Method
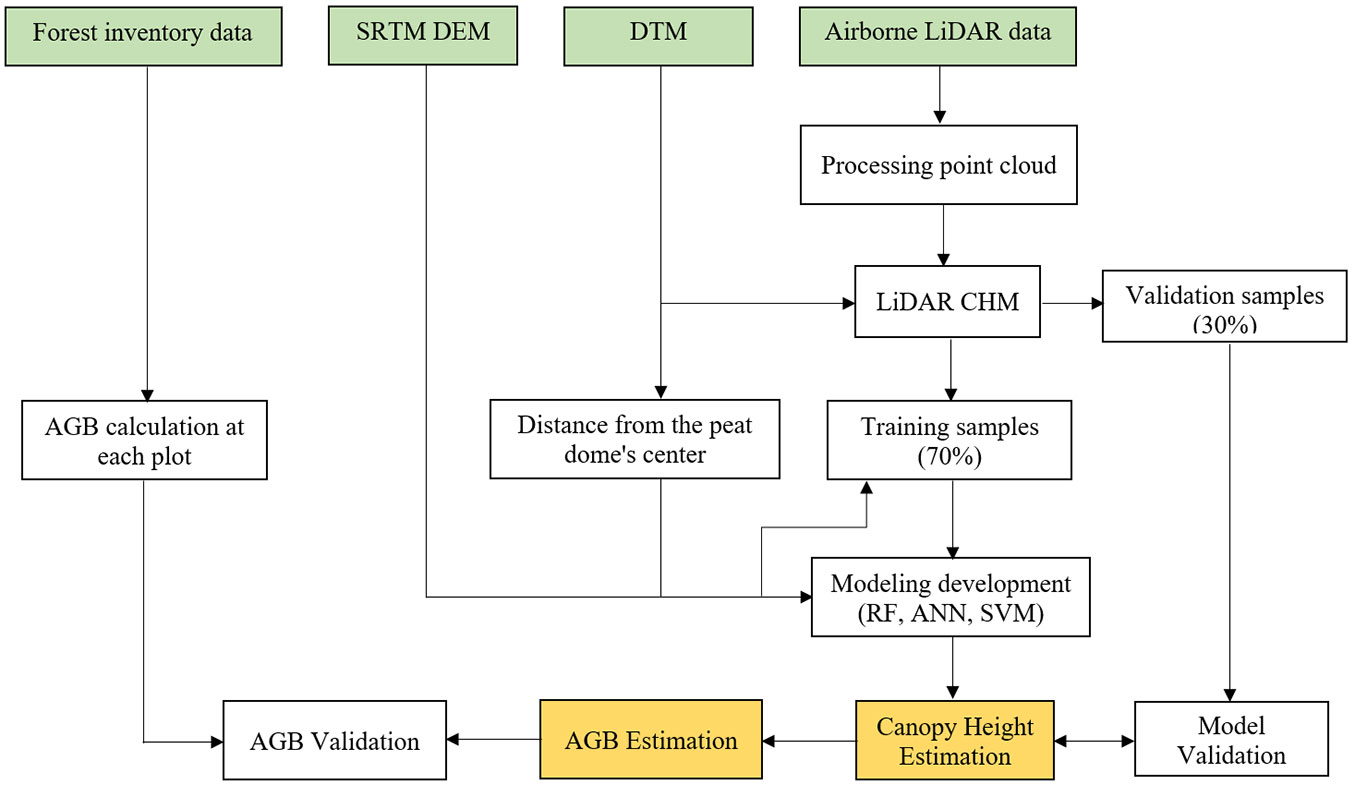
A quick and cost-effective method using InSAR data together with a small sample of LiDAR data was developed to estimate and map AGB in Brunei Darussalam. To do that, a LR model and three ML models, including RF, ANN and SVM, were adopted to estimate the canopy height. ML models were trained on the training samples taken from the LiDAR data and validated using in situ forest inventory plots. The workflow of the study is shown in Fig. 2.
Fig. 2 - Workflow of the study.
Creating and estimating canopy height model
A digital surface model (DSM) at a spatial resolution of 30 m was developed from the LiDAR data. The LiDAR DSM was created from the highest point within each resolution cell. By subtracting DSM from DTM, a canopy height model (CHM) was obtained. Before the subtraction, the DTM was resampled to match the resolution of the InSAR data. Since the first return, LiDAR data for the production of a DSM were available for a part of the AOI, only an extrapolation was used to estimate the LiDAR data for the voids of the LiDAR data using an LR model and three ML models, including RF, ANN and SVM. To do that, 500 samples were randomly selected in the area covered by the LiDAR. LiDAR CHM values were extracted for the samples. Then, the models were adopted to estimate the canopy height for AOI. Seventy percent of the LiDAR CHM, along with InSAR height and relative terrain height extracted for the corresponding LiDAR CHM, were used to train the models, and 30% of the LiDAR CHM was used to validate the models.
AGB Estimation
AGB can be estimated using allometric equations involving tree height and DBH. The allometric equations are of the power function type (eqn. 1):
where y (m) is the tree height, x (cm) is the DBH, a = 1.67 and b = 0.7259 are parameters valid for Shorea albida determined by in situ measurements.
Eqn. 1 can be reformulated to extract DBH as a dependent variable and tree height as the explanatory variable. Hence, the relationship between ABG and tree height ([5], [3]) can be described as follows (eqn. 2):
where y is AGB (Mg) and x is the tree height (m).
Linear regression (LR)
LR is one of the most widely used parametric modeling approaches to establish a linear relationship between the dependent variable and predictive variables. Forest canopy height was used as the dependent variable, and InSAR height and distance from the peat dome center were used as the independent variables. In this study, stepwise LR was used to develop the canopy height estimation model. Stepwise regression can determine the inclusion or exclusion of variables based on test statistics of estimated coefficients through a series of tests (t-tests or F-tests - [19]).
Machine learning algorithms
Machine learning is an artificial intelligence application trained by experience without any programming. ML approaches are based on powerful regression techniques to solve complex and non-linear problems. Furthermore, ML algorithms are not dependent on data distribution. Thus, it can seamlessly integrate data from different sources ([12]). ML is generally categorized into supervised and unsupervised learning. Supervised learning consists of historical training data to make predictions on the data. At the same time, unsupervised learning uses unlabeled data and requires prior human intervention to label data correctly. This study employed three ML algorithms, namely RF, SVM, and ANN, to predict AGB. The algorithms were modeled in the software package STATISTICA™ (StatSoft GmbH, Hamburg, Germany).
RF is an ensemble learning algorithm that can be utilized for both classification and regression problems. It combines decision trees on various subsets of the relevant dataset. Each tree depends on the values of a random vector sampled independently and with the same distribution. At each node of the tree, the split is determined by a set of predictor variables that are randomly selected. In the regression trees, the significance of each node is determined by employing input data to evaluate which variable in that node ideally characterizes the remaining observations. If the error is reduced by splitting a single rule into multiple rules, the regression tree grows with more rules. When the lowest error against input data is obtained, tree growth is stopped, and all the trees’ predictions are aggregated; new information is predicted ([15], [12]). The number of tree parameters significantly affects the performance of the RF algorithm, so it should be chosen carefully ([41]). The number of tree parameters was optimized by comparing the results obtained from different tree numbers. We evaluated 100, 200, 300, 400, 500, 1000 and 1500 number of trees. The independent variables that predict CHM were the SRTM DEM and distance from the peat dome center. Relative terrain height (RTH) was used as a distance function from the peat dome’s center. RTH was obtained by subtracting the lowest height in DTM from any other values.
Neural networks, also known as artificial neural networks (ANN), comprise a layered structure, including an input layer, one or more hidden layers, and an output layer. Numerous hidden layers can be applied to formulate a more complex model to fit a challenging problem. Mathematical functions called neurons operate in all layers. Neural networks rely on training data that learns using interconnected neurons and improves their accuracy over time. ANN algorithm uses the back-propagation (BP) learning rule to minimize the mean square error (MSE) between the actual output and the desired value ([7]). The performance of the ANN model depends on connection weights between layers. These weights are adjusted based on the BP learning rule during the training phase ([42]). MultiLayer Perceptron (MLP), which is a powerful data-driven modeling tool in ANNs, is widely used for forest monitoring, environmental modeling and biomass prediction. To construct the MLP model it is required to find the number of hidden layers and hidden neurons in each layer, and weights. In most literature, MLP with one hidden layer has been considered a universal approach with strong predictability for nonlinear function ([31]). Therefore, MLP with one hidden layer was adopted in this study. In addition, the optimum MLP model was determined by varying the number of neurons in the hidden layer (1-10) versus the root means square error value. The activation functions of identity, logistic, exponential and tanh were used. The Broyden-Fletcher-Goldfarb-Shanno (BFGS) algorithm was used as the training algorithm to solve the nonlinear optimization during the ANN modeling process. As known, there is no need to use any initial parameter in BFGS ([4]).
Support vector machines (SVM) is a supervised nonparametric ML algorithm that can be used for regression and classification. SVM is a kernel-based algorithm that transforms low-dimensional data to a higher dimension using a non-linear kernel function to minimize the complexity of the model and training error ([44]). As a result, SVM can reach high accuracy, even when training data is small ([39]). The training process for forest AGB estimation aims to construct an SVM function as follows (eqn. 3):
where α represents the Lagrange multiplier, k (xi ; x) is the kernel function, xi is the training vector, and b indicates the bias term in the regression.
Selecting a kernel function with suitable parameters is crucial to obtaining successful results from the model ([41]). This study employed SVM with radial basis function (RBF) kernel function to predict CHM. The RBF kernel was selected as it has a few parameters that need to be defined and is effective in estimating forest parameters ([13]). A sensitivity analysis of model parameters was performed to optimize model performance. Predictive variables for the model were selected the same way they were considered for the RF and ANN models.
Model assessment
The LR model and ML techniques, including RF, ANN and SVM models, were validated using 15 forest inventory plots. The coefficient of determination (R2), mean absolute error (MAE), and root mean square error (RMSE) were used to compare the performance of the models in forest AGB estimation. In modeling, using these statistical criteria is common to measure the difference between observed and predicted values. The higher R2 and lower RMSE and MAE values show a better regression model. R2, RMSE and MAE are estimated using the following equations ([22], [41], [26] - eqn. 4, eqn. 5, eqn. 6):
where yi and hat{y}i indicate the observed and predicted AGB for the i-th plot, respectively, ȳ represents the observed mean value of biomass and n is the number of validation plots.
Results
Modeling and evaluation of AGB
The CHM was created for the LiDAR and the SRTM by subtracting the DTM from the corresponding DSM. Then, using the RF, ANN, SVM and LR models, LiDAR CHM was estimated for the whole of AOI. For each algorithm, 70% (350 samples) of random sampling data was used to train the model, and 30% (150 samples) was used to validate the model. For all models, the input variables were the InSAR height and distance from the peat dome’s center, whereas the CHM was the output variable. The DTM was used as a function of distance from the center of the peat dome. The relative terrain height was obtained for the AOI by subtracting the lowest height in DTM from any other values. The relative elevation above the dome’s edges was approximately 11 m. The maximum elevation was around 17 m. The number of tree parameters for the RF model was optimized by comparing the results obtained from different tree numbers. As a result, the optimum model accuracy was found with 300 trees. The relative importance of predictive variables in the RF model was 1.0 and 0.25 for InSAR height and RTH, respectively. The optimum model was found with three hidden neurons and logistic activation function for the ANN model. The initial weights of the ANN are randomly assigned, and the interconnection weights are adjusted as the network is developed to minimize prediction error. For the SVM model, the highest model accuracy was obtained with values of capacity = 15 and epsilon = 0.4, resulting in an R2 value of 0.96 and an RMSE of 3.45 m. The optimum number of support vectors (164) was obtained from the optimized parameterization of the SVM model.
Validation results of the forest canopy height estimation using the models are shown in Tab. 2. The coefficient of determination between the estimated and target CHM was found to be R2 = 0.94 for the RF model, R2 = 0.96 for the ANN model, R2 = 0.96 for the SVM model and R2 = 0.87 for the LR model. The lower RMSE and MAE values were found for the SVM model. The ANN model and the RF model followed it. In contrast, the LR model had the lowest performance regarding R2, RMSE, and MAE.
Tab. 2 - Validation results for the CHM model.
| Model | R2 | RMSE (m) |
MAE (m) |
|---|---|---|---|
| RF | 0.94 | 4.47 | 2.95 |
| ANN | 0.96 | 3.81 | 2.94 |
| SVM | 0.96 | 3.45 | 2.65 |
| LR | 0.87 | 6.64 | 4.92 |
The results indicated that all models have satisfactory performances using the training data. Therefore, the canopy heights obtained were used for biomass estimation. Forest AGB was estimated using the obtained canopy height, allometric equation and plot information. The results of the forest AGB estimation at the plot level using RF, ANN, SVM and LR models are shown in Tab. 3.
Tab. 3 - Predicted AGB values from the models for selected reference plots.
| Plot ID |
AGB from NFI (Mg ha-1) |
Mean canopy height (m) |
Predicted AGB (Mg ha-1) | |||
|---|---|---|---|---|---|---|
| RF | ANN | SVM | LR | |||
| 10 | 727.3 | 54.35 | 688.29 | 684.42 | 663.46 | 653.30 |
| 13 | 560.0 | 53.69 | 625.79 | 615.71 | 599.78 | 548.12 |
| 14 | 552.1 | 49.12 | 392.31 | 421.32 | 473.24 | 384.10 |
| 15 | 483.0 | 58.61 | 402.52 | 415.06 | 446.42 | 357.61 |
| 16 | 803.2 | 53.11 | 689.20 | 706.34 | 740.19 | 726.03 |
| 18 | 581.7 | 44.94 | 376.38 | 389.71 | 413.86 | 368.10 |
| 19 | 482.3 | 49.08 | 537.72 | 520.71 | 524.23 | 453.47 |
| 23 | 447.3 | 55.67 | 273.63 | 280.22 | 332.04 | 255.06 |
| 27 | 491.8 | 61.00 | 301.76 | 304.46 | 344.93 | 294.80 |
| 33 | 895.3 | 45.73 | 776.64 | 755.44 | 798.80 | 689.25 |
| 34 | 715.5 | 44.70 | 596.08 | 677.64 | 665.85 | 553.86 |
| 37 | 728.7 | 56.94 | 713.95 | 752.70 | 738.98 | 667.79 |
| 39 | 848.4 | 57.19 | 853.45 | 878.28 | 828.41 | 817.35 |
| 40 | 523.9 | 45.59 | 362.64 | 381.40 | 426.13 | 354.91 |
| 45 | 380.8 | 51.92 | 469.15 | 454.03 | 414.65 | 442.34 |
In Fig. 3, which shows a comparison of the calculated AGB from NFI and the predicted AGB values, the numbers from 1 to 15 show plot IDs of 45, 23, 19, 15, 27, 40, 14, 13, 18, 34, 10, 37, 16, 39, and 33 respectively.
Fig. 3 - Comparison of the calculated AGB from NFI and the predicted AGB values.
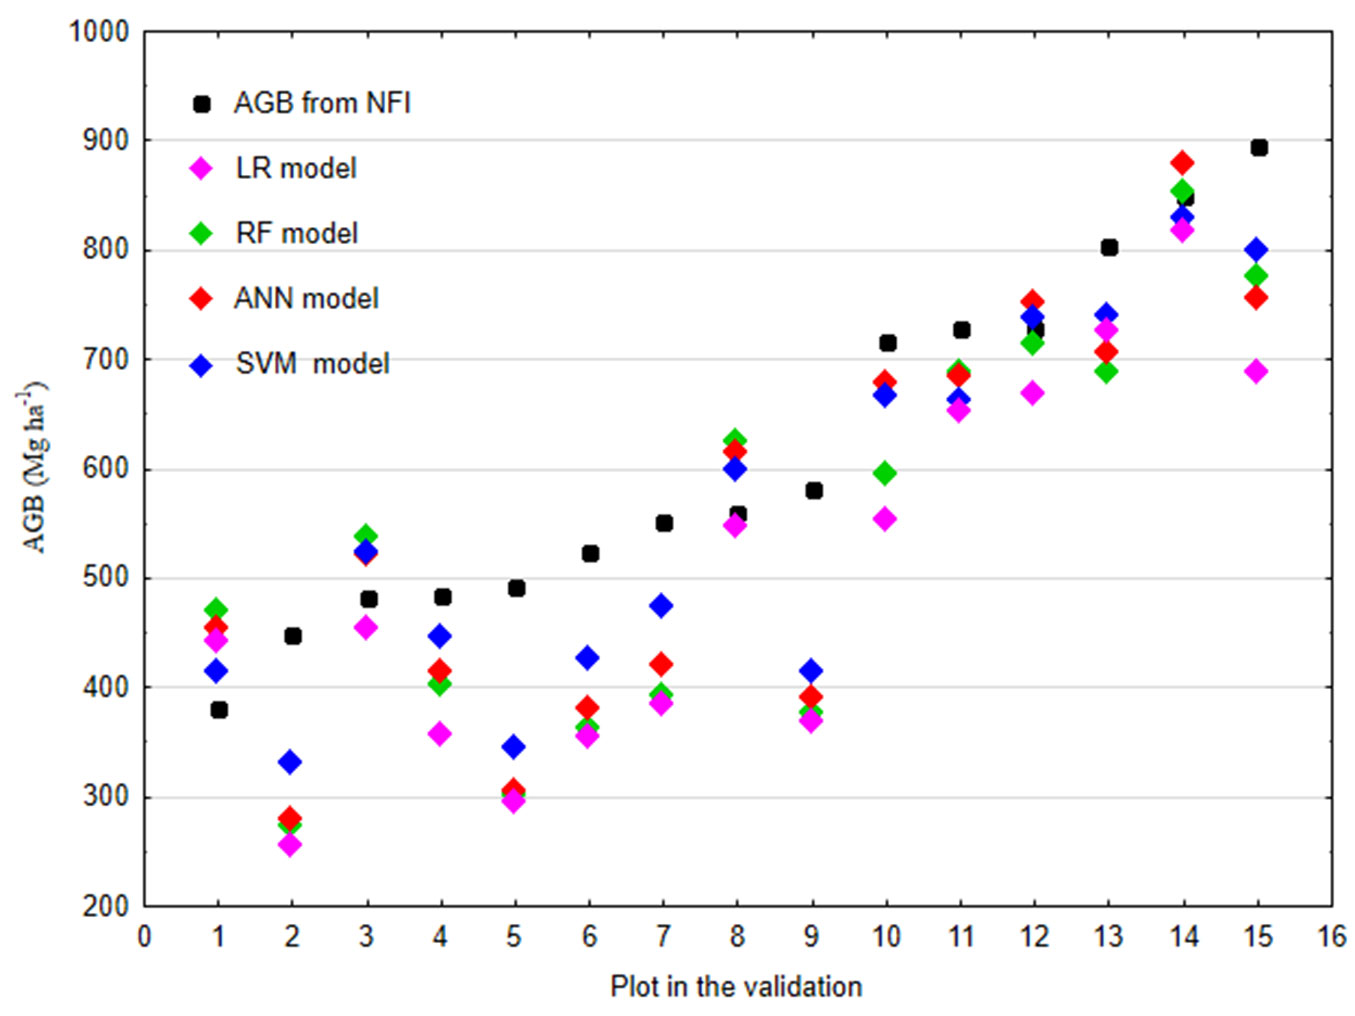
Fig. 4shows the correlation of the reference and modeled AGB by different techniques in the study area. The coefficient of determination varies from 0.21-0.70. The SVM model generally shows a better fit compared to the 1:1 line than the other models. The AGB estimates from LR are usually lower than the reference biomass. SVM tends to overestimate the AGB for some plots. The average AGB calculated using SVM for the AOI plots was 518.23 Mg ha-1, 666.75 Mg ha-1 and 629.58 Mg ha-1, respectively, for the 3.2/3, 3.3 and 3.4 forest types.
Fig. 4 - Predicted AGB against AGB from NFI (Mg ha-1) of the RF (a), ANN (b), SVM (c), and LR (d) models. The dotted line represents the 1:1 line. The red line is the regression line.
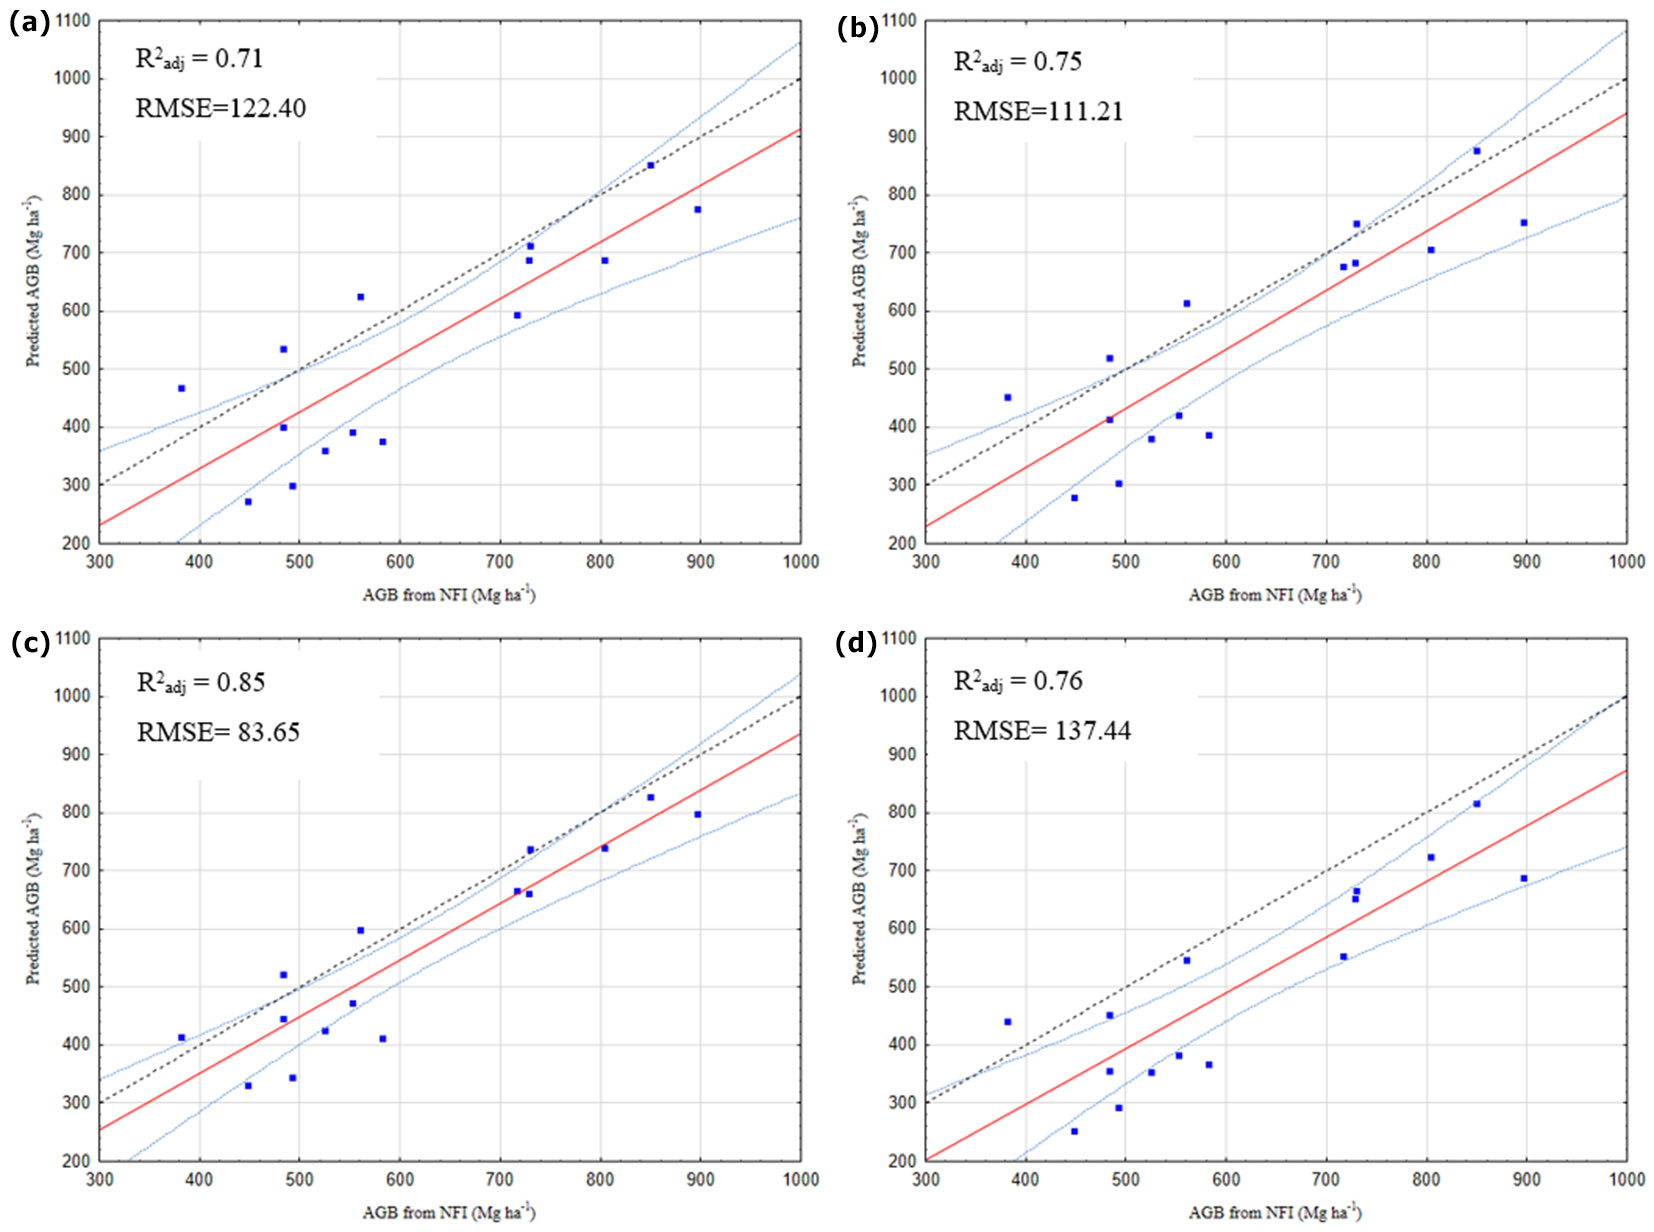
The ML algorithms’ performances were tested and compared based on the R2, RMSE and MAE (Tab. 4). The highest R2 value and the lowest RMSE and MAE values were found for the SVM model (R2 = 0.71, RMSE = 83.65 Mg ha-1, MAE = 74.43 Mg ha-1), followed by the ANN model (R2 = 0.48, RMSE = 111.21 Mg ha-1, MAE = 95.09 Mg ha-1) and the RF model (R2 = 0.36, RMSE = 122.40 Mg ha-1, MAE = 102.43 Mg ha-1). In contrast to SVM, the LR model had the lowest performance; R2, RMSE, and MAE values were 0.21, 137.44 Mg ha-1 and 118.55 Mg ha-1, respectively. Therefore, it was concluded that the SVM model had the best performance in estimating the forest AGB in this study.
Tab. 4 - Validation results of the AGB model.
| Model | R2 | RMSE (Mg ha-1) |
MAE (Mg ha-1) |
|---|---|---|---|
| RF | 0.36 | 122.40 | 102.43 |
| ANN | 0.48 | 111.21 | 95.09 |
| SVM | 0.70 | 83.65 | 74.43 |
| LR | 0.21 | 137.44 | 118.55 |
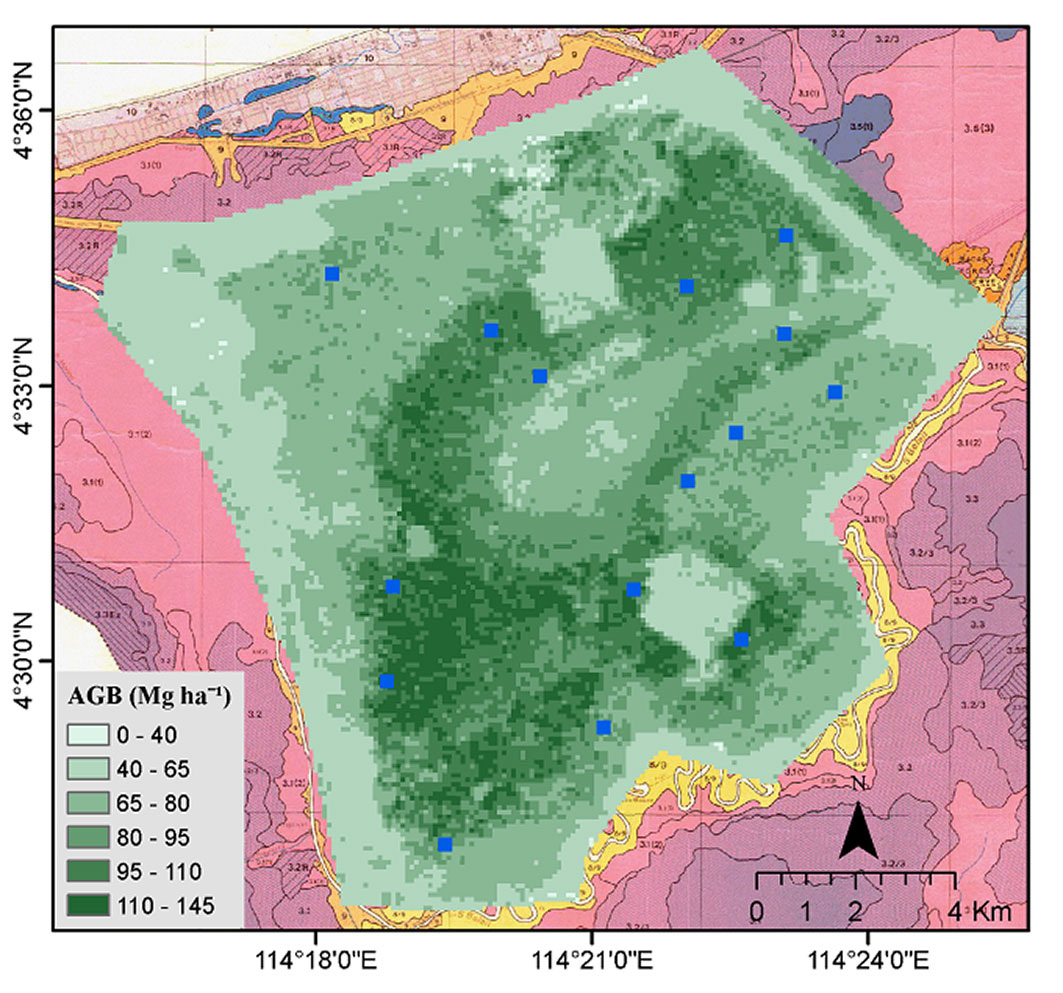
The AGB map for the AOI with the model of the best fit, SVM, is shown in Fig. 5. The area with the highest biomass concentration (reaching values of 80 to 145 Mg ha-1) was found in the Alan Bunga (3.3) and Padang Alan (3.4) forest. This area corresponds to the areas with higher canopy height. Lower biomass is observed in the Transitional area.
Fig. 5 - Predicted AGB in the AOI generated from the best fit SVM model.
Discussion
Selection of the appropriate modeling method is one of the most critical steps in studies to predict AGB. In this study, we evaluated the performances of four algorithms, including LR, RF, ANN and SVM, for predicting canopy height and AGB in a tropical forest using remotely sensed data. The SVM model provided the highest prediction accuracy regarding the lowest RMSE and MAE and the highest R2 among the models used. The ANN model and the RF model followed it, showing a slight under- or over-estimation of AGB. The LR model displayed the lowest accuracy, underestimating the AGB values. Furthermore, all models displayed significant underestimation of the AGB values for the 3.2/3 forest type (i.e., transitional between Alan and Alan Bunga forests) plots, including 14, 18, 23, and 27, and significant overestimation of AGB values for some plots. This may be due to forest degradation, deforestation and forest growth over time in this area.
Although differences in data used and study areas make comparison difficult, this result agrees with the findings of some studies. For instance, the analyses by [13], [18], [24], [11], [6] and [41] showed that SVM was the best among the different machine learning techniques used, including RF and ANN for AGB estimation. Furthermore, the SVM model has shown high accuracy even when datasets are small ([28], [39]). This is because the SVM works on distance-based learning with sample points rather than a mix of categorical and numerical features. Many researchers also report that SVM is often best at dealing with complex regression and classification problems ([13], [12], [27]). Using RF and SVM models, Fagua et al. ([10]) used LiDAR and SAR data to predict canopy height in tropical forests in South America. They achieved an RMSE value of 5.5 m and 6.5 m for the RF and SVM models. Pourshamsi et al. ([34]) used the SVM model to estimate tropical forest canopy height with PolInSAR and LiDAR data fusion. The estimated height showed an RMSE of 7.1 m and an R2 of 0.81. Lee & Lee ([23]), using linear regression and an SBAS algorithm to estimate canopy height based on the L-band SAR, SRTM, LiDAR and optical data, obtained results of an R2 and RMSE 0.56 and 2.68 m, respectively. In another study, combining PolSAR variables with LiDAR data was used to estimate forest canopy height using four ML algorithms, including RF and SVM models. The results showed high accuracy, with an average RMSE of 10 m between training samples and the models ([35]). Validation results of the forest canopy height estimation using the models are shown in Tab. 2. RMSE values of 4.47 m, 3.81 m, 3.45 m and 6.64 m were found for RF, ANN, SVM and LR models. Considering the mentioned studies, the results of this study showed that the canopy heights estimated from the models were satisfactory. Therefore, the obtained canopy heights were used to calculate AGB.
The results indicated that the nonparametric ML models could provide a higher canopy height and AGB estimation accuracy compared to parametric models like LR. Montaño et al. ([30]) emphasized that ML techniques can replace allometric models and represent a safe and feasible alternative to regression analyses. In this regard, they have several advantages that make ML algorithms an alternative to parametric models. For example, ML is able to handle complex and non-linear relationships between multiple environmental variables and AGB ([8]). Moreover, it uses cross-validation during model development and produces robust models. Also, ML algorithms are preferred when creating the model by several independent variables ([29]).
The limitation of this study was the use of the forest inventory data obtained from the NFI. The inventory data used to validate the predicted AGB was compiled from an old data collection due to the limited field data availability for the AOI. This is probably the reason of the high errors in the AGB estimation for some of the plots. The reliability of the results is expected to increase when the acquisition date of the dataset used in AGB verification is close to other datasets, and the method used can be better evaluated. Consequently, future work will be planned based on this assumption.
Regarding the variables used in the models, InSAR height was the most crucial for estimating AGB. Selecting suitable variables from satellite and physical data is essential to map the AGB. Some studies have used various variables such as vegetation indices, texture indices, multispectral bands, LiDAR metrics, topographic variables, or a combination of these to estimate AGB by ML algorithms. Climatic, hydrography and soil variables can also affect AGB, but they are either limited in accuracy or unavailable. Vegetation indices, texture and multispectral variables are not universal predictors of biomass because they tend to saturate at relatively low biomass levels ([21]). Besides, these indices tend to change during the year following tree phenology. LiDAR is an expensive technology, and LiDAR data are not always available. Therefore, by eliminating the mentioned variables in this study, InSAR height and distance from peat dome center variables were used as predictors.
Conclusion
This study used four algorithms to model and map forest AGB based on canopy height using LiDAR and InSAR data. An LR model and three ML algorithms were investigated and compared, including RF, ANN, and SVM. The results showed higher accuracy in canopy height and AGB estimation of the ML models compared to the parametric LR model. Among the models used, SVM was the best method to predict AGB in the study area with R2 = 0.70, RMSE = 83.65 Mg ha-1 and MAE = 74.43 Mg ha-1. The predictive variable with greater importance for the modeling was InSAR height. This study demonstrated the potential of ML algorithms in AGB estimation based on canopy height in tropical forests derived from the InSAR-based DEM. This study can provide a reference for selecting suitable predictors and algorithms for AGB modeling in tropical forests.
References
Gscholar
CrossRef | Gscholar
CrossRef | Gscholar
CrossRef | Gscholar
CrossRef | Gscholar
CrossRef | Gscholar
CrossRef | Gscholar
CrossRef | Gscholar
Authors’ Info
Authors’ Affiliation
Aycan Murat Marangoz 0000-0003-4409-6000
Geomatics Engineering Department, Zonguldak Bulent Ecevit University, Zonguldak (Turkey)
Faculty of Geoengineering, Mining, and Geology, Wroclaw University of Science and Technology, Wroclaw (Poland)
Corresponding author
Paper Info
Citation
Zadbagher E, Marangoz AM, Becek K (2024). Estimation of above-ground biomass using machine learning approaches with InSAR and LiDAR data in tropical peat swamp forest of Brunei Darussalam. iForest 17: 172-179. - doi: 10.3832/ifor4434-017
Academic Editor
Carlotta Ferrara
Paper history
Received: Jul 22, 2023
Accepted: Mar 05, 2024
First online: Jun 17, 2024
Publication Date: Jun 30, 2024
Publication Time: 3.47 months
Copyright Information
© SISEF - The Italian Society of Silviculture and Forest Ecology 2024
Open Access
This article is distributed under the terms of the Creative Commons Attribution-Non Commercial 4.0 International (https://creativecommons.org/licenses/by-nc/4.0/), which permits unrestricted use, distribution, and reproduction in any medium, provided you give appropriate credit to the original author(s) and the source, provide a link to the Creative Commons license, and indicate if changes were made.

Web Metrics
Breakdown by View Type
Article Usage
Total Article Views: 24673
(from publication date up to now)
Breakdown by View Type
HTML Page Views: 13417
Abstract Page Views: 7395
PDF Downloads: 3459
Citation/Reference Downloads: 10
XML Downloads: 392
Web Metrics
Days since publication: 774
Overall contacts: 24673
Avg. contacts per week: 223.14
Article Citations
Article citations are based on data periodically collected from the Clarivate Web of Science web site
(last update: Jul 2026)
Total number of cites (since 2024): 10
Average cites per year: 3.33
Publication Metrics
by Dimensions ©
Articles citing this article
List of the papers citing this article based on CrossRef Cited-by.
Related Contents
iForest Similar Articles
Research Articles
Application of machine learning models and Euclidean distance to predict soil spatial properties
vol. 19, pp. 186-194 (online: 02 June 2026)
Short Communications
Estimation of canopy attributes of wild cacao trees using digital cover photography and machine learning algorithms
vol. 14, pp. 517-521 (online: 17 November 2021)
Research Articles
Above ground biomass estimation from UAV high resolution RGB images and LiDAR data in a pine forest in Southern Italy
vol. 15, pp. 451-457 (online: 03 November 2022)
Research Articles
Exploring machine learning modeling approaches for biomass and carbon dioxide weight estimation in Lebanon cedar trees
vol. 17, pp. 19-28 (online: 12 February 2024)
Research Articles
Forest fire occurrence modeling in Southwest Turkey using MaxEnt machine learning technique
vol. 17, pp. 10-18 (online: 02 February 2024)
Research Articles
Prediction of stem diameter and biomass at individual tree crown level with advanced machine learning techniques
vol. 12, pp. 323-329 (online: 14 June 2019)
Research Articles
Tree biomass and carbon density estimation in the tropical dry forest of Southern Western Ghats, India
vol. 11, pp. 534-541 (online: 01 August 2018)
Research Articles
Classification of xeric scrub forest species using machine learning and optical and LiDAR drone data capture
vol. 18, pp. 357-365 (online: 07 December 2025)
Research Articles
Carbon stock in Kolli forests, Eastern Ghats (India) with emphasis on aboveground biomass, litter, woody debris and soils
vol. 4, pp. 61-65 (online: 05 April 2011)
Research Articles
Temporal patterns control carbon balance in forest and agricultural tropical peatlands in North Selangor, Malaysia
vol. 14, pp. 362-369 (online: 10 August 2021)
iForest Database Search
Search By Author
Search By Keyword
Google Scholar Search
Citing Articles
Search By Author
Search By Keywords
PubMed Search
Search By Author
Search By Keyword


