Selection priority for harvested trees according to stand structural indices
iForest - Biogeosciences and Forestry, Volume 10, Issue 3, Pages 561-566 (2017)
doi: https://doi.org/10.3832/ifor2115-010
Published: May 05, 2017 - Copyright © 2017 SISEF
Research Articles
Abstract
The selection of trees to be harvested is a core tenet of uneven-aged forest management; however, few studies have focused on the process of tree selection. A set of stand structural parameters (uniform angle index, W; mingling index, M; dominance index, U) based on tree neighbor-spatial relationships, are particularly suitable for expressing the structural characteristics of forest stands. Such indices were used to parameterize thinning in three plots (a-c, each 100 × 100 m2) in a Korean pine broad-leaved forest in northeastern China and one plot (h, 70 × 70 m2) in a pine-oak mixed forest in northwest China. Low-intensity single-tree selection was applied according to the principles of structure-based forest management (SBFM), i.e., to promote high mixture, obvious size differentiation, and random pattern with the aim of improving the overall structure of the managed plots. A group of thinning priority indices (v_ij, k_ij and z_ij) were calculated according to the bivariate distributions of the structural characteristics of harvested trees and stands before harvest. Our results demonstrated that v_ij, k_ij and z_ij adequately describe the spatial relationship between each tree and its nearest neighbors, and their combinations can be efficiently used to set thinning priorities on harvested trees with different structural characteristics. Their application can reduce the subjectivity of the selection process and improve the speed and accuracy of the choice of trees to be harvested in uneven-aged mixed forests.
Keywords
Dominance Index, Mingling Index, Thinning, SBFM, Silviculture, Uneven-aged Forest, Uniform Angle Index
Introduction
Forest growth is the result of the interaction between environmental factors and silvicultural treatments. Thinning is a typical and important forest management practice, which not only controls forest growth and changes density, but also improves stand structure, timber value, and the provision of a suite of forest ecosystem services ([5], [20], [29]). Thinning causes several environmental and biological changes related to forest structure, such as a short-term improvement of understory microclimates ([1], [7]), an increase in soil water content and in the amount of rainfall that reaches the understory ([24], [3], [34]), an acceleration of soil nutrient cycles ([25], [28]), and reductions in the occurrence of forest fires, plant diseases, and insect pests ([30]). However, thinning may sometimes result in counterproductive outcomes ([23]), such as damaging understory, increasing the risk of natural disasters, decreasing the increment of total accumulation and seedling survival rate ([27], [2]), inhibiting seed germination ([15], [36]), even reducing tree species diversity ([31]). The resulting changes may negatively affect stand growth and harvesting.
The selection of trees to be harvested is at the core of thinning. The process of selection is restricted by a number of factors. On the one hand, the thinning process is irreversible and difficult to repeat, and even successful outcomes cannot provide a very specific operational standard since such a standard may be difficult to apply in other forest management contexts ([12]). On the other hand, thinning is a poorly defined concept. The ambiguity is caused by many factors, such as vague definitions, artificial intervention, and the accuracy of survey data. Definitions that do not accurately describe existing operations cannot be used to predict future thinning effects ([5]).
Recently, uneven-aged forest management, and other management methods that strongly emphasize recovery or preservation of complex stand structures have been strongly advocated ([19], [4], [8]). These demand that changes in stand density, structure, and value produced by thinning are to be objectively considered ([23]), especially with regard to the choice of appropriate trees to harvest. In practice, when a tree is selected as a candidate for logging, foresters must investigate many factors, such as logging accessibility, spatial distribution, degree of mixture in the residual stand, seed input in the residual stand, wood quality and market value, species life traits and response to crowding, health status, and biodiversity concerns, e.g., whether the tree is a protected or keystone species ([26], [22], [21]), or whether other organisms are dependent on it ([14]). A comprehensive approach to select candidate tree must use a combination of thinning-relevant variables to calculate the probability of removing a particular tree ([5]). All trees are then ranked, and those with maximum probability are removed. This method of tree selection seems reasonable, but its implementation is cumbersome. It is impossible for operators to decide whether a tree should be cut or not by comparing all trees in a plot, even in forest stands with simplified structures ([5]). Other thinning methods are available for uneven-aged forest management practices but these also have obvious weaknesses. Approaches include the stem number guide curve ([6]), the A-value thinning method ([5]), and the diameter-limit cut ([35]). These approaches focus mainly on the stem size, and lack any relevant information regarding their spatial structure. More importantly, they cannot reliably provide a thinning target in advance.
Spatially explicit algorithms may allow for a higher standard of choice when it comes to tree harvesting. For example, we may be able to measure the structural attributes of specific regions in a forest community or the point density around a single tree ([5]). The cutting intensity of a single harvest can be determined by setting a stand density threshold, but this does not ensure an effective improvement of the forest stand. This is because the tree growth response to thinning is always dependent on the relationships between adjacent trees.
Managing stand density therefore requires consideration of three properties: species composition, spatial distribution pattern, and tree size ([13]). Any tree in a stand reflects these three properties at the same time, and when these attributes are discretized, the stand can be divided into structural “combinations” summarized by any two of these properties ([16]). A change in these bivariate characteristics of stand structure may reflect the possibility that cutting trees in a structural combination, namely, a so-called thinning priority, is preferable.
The purpose of our study is to put forward bivariate thinning priority indices based on tree neighbor-spatial relationships. We used these indices to parameterize thinning in Korean pine broad-leaved forests in northeast China and pine-oak mixed forests in northwest China in which a structure-based forest management (SBFM) has been implemented. Our research may provide a reference point for the rapid and accurate selection of trees for harvesting in uneven aged forests in the future. It may list the thinning targets in advance and simplify the processes of thinning when compared with traditional methods.
Materials and methods
Study areas
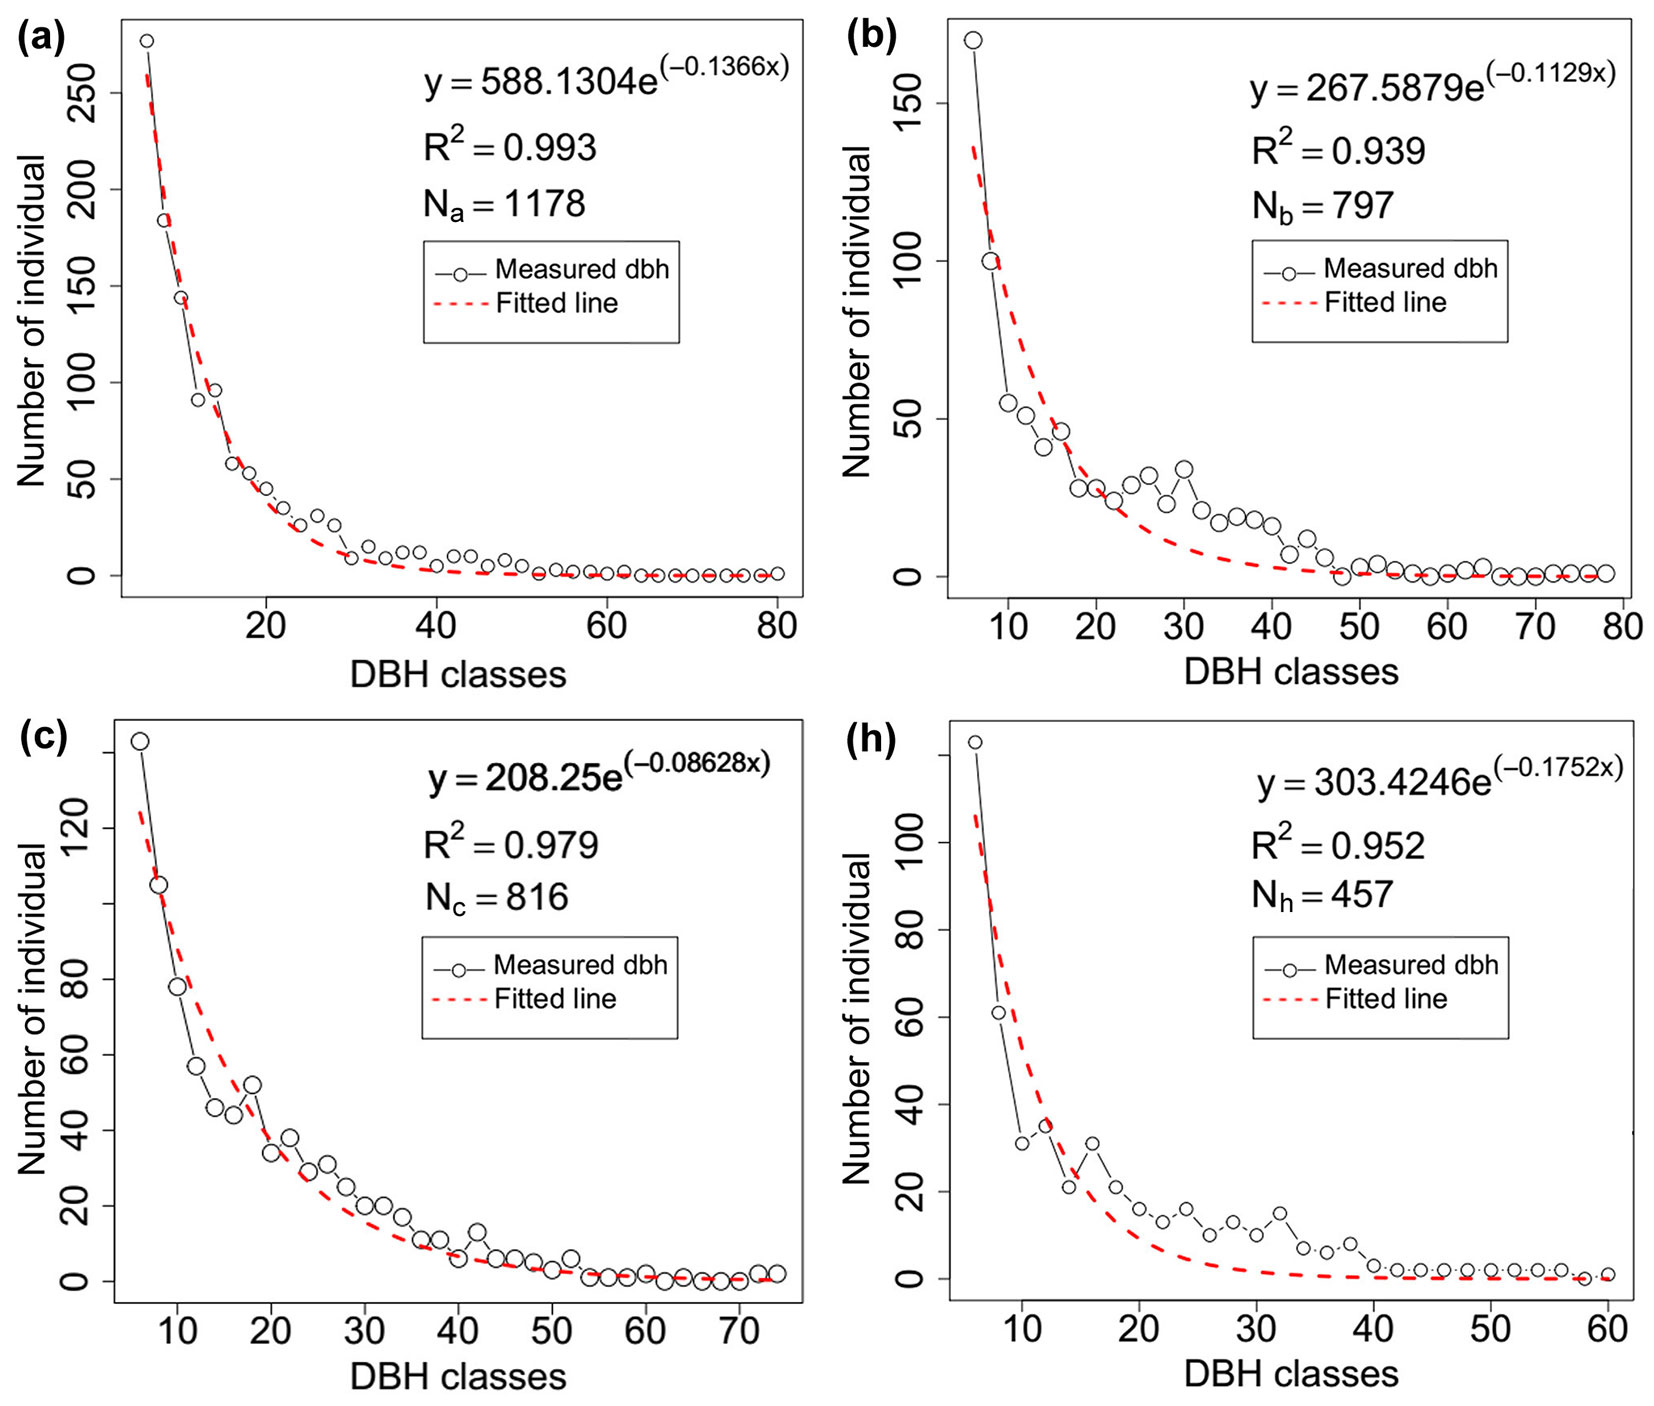
Our test stands were a mixed Korean pine-broadleaved forest in northeast China and a mixed pine-oak forest in northwest China. Both have typical zonal vegetation and human intervention has been absent in both forests for more than 40 years. The Korean pine-broadleaved forest consisted of an approximately 31.562-ha wide area with a rectangular form, and we placed our sampling plots in the 52th, 53th, and 54th compartments which belong to the core area of the forest region in Dongdapo, QianJin Village, Jiaohe, Jilin Province (43° 51′ - 44° 05′ N, 127° 35′ - 127° 51′ E). This site has a low-relief topography with mean elevation of 1720 m a.s.l. and a monsoon climate with dry, windy springs and warm, wet summers, long, cool winters, and sunny autumns. The stands have a relatively undisturbed structure and the canopy cover is about 90% as determined by visual observation. Pinus koraiensis Sieb. et Zucc., Picea jezoensis var. microsperma (Lindl.), Juglans mandshurica Maxim., and Acer mandshurica Maxim. are the common species in this mixed forest. There are 22 tree species in total and the ratio of conifers to broadleaves approaches 1:9, but the coniferous trees are much bigger than any individual hardwood tree ([16], [18]) - Tab. 1, Fig. 1).
Tab. 1 - Stand features of the four measured plots (a, b, c, h).
| Plot | Slope (°) |
Slope aspect |
Density (Trees/ha) |
Mean Altitude (m) |
Canopy cover |
Mean DBH (cm) |
Basal area (m2) |
Number of species |
|---|---|---|---|---|---|---|---|---|
| a | 17 | Northwest | 1178 | 600 | 0.85 | 14.67 | 30.42 | 20 |
| b | 9 | Northwest | 797 | 600 | 0.90 | 18.34 | 31.67 | 19 |
| c | 9 | Northwest | 816 | 600 | 0.90 | 17.71 | 29.56 | 22 |
| h | 12 | West | 933 | 1720 | 0.90 | 15.8 | 27.85 | 33 |
Fig. 1 - Diameter classes of the four measured plots.
The pine-oak mixed forest covered about 706.625 ha and our study site is located in the 57th compartment of the Baihua forest farm, on Xiaolong Mountain, Gansu Province (33° 30′ - 34° 49′ N, 104° 22′ - 105° 43′ E). This region is in a transition area between the warm-temperate zone and the north subtropical zone, and has a diversified climate and four seasons. More than 30 tree species occur in this relatively mature forest, which has a complex structure and high biodiversity. Its canopy cover is about 80%. Quercus aliena var. Acuteserrata Maxim., Pinus armandii Franch., Symplocos paniculata (Thunb.) Miq., Quercus liaotungensis Koidz., Ulmus glabra Huds., and Crataegus kansuensis Wils. are the most common species in this particular forest stand ([11], [17], [18]). The ratio of conifers to broadleaves is 1: 10.
Field measurements
In 2008-2009, six 100 × 100-m permanent plots were selected and established in the Korean pine broadleaved forest. In each plot, every tree ≥ 5 cm in diameter at 1.30 m height (DBH) was tagged and positioned and its species was recorded. Three of the plots (a, b, and c) were subsequently harvested in the same year according to the principles of SBFM, whose purpose is to dynamically monitor the successional processes of Korean pine-broadleaf, and to investigate the positive effect of SBFM on forest communities ([10], [18]). The main characteristic of techniques is to use the stand structure parameters to select and cut single tree, with the purpose to promote or keep stands within a high mixture, tree size differentiation, and random distribution status that was usually detected in virgin forests. All unhealthy trees were removed from the sampling plots at first. Secondly, trees with low mixture (M = 0.00, 0.25) or in cluster and overdispersed (W = 0.00, 1.00) were selected for potential thinning. Larger trees adjacent to smaller ones (U = 0.0-0.25) were also selected to reduce competitive pressure on adjacent trees. Thirdly, trees harvested were further selected from the candidate according to the structure requirement of climax species and associated species of medium to large diameter. The main target species included Korean pine, Abies holophylla Maxim., Abies nephrolepis (Trautv.) Maxim., P. jezoensis, Fraxinus mandshurica Rupr., Phellodendron amurense Rupr., J. mandshurica, Acer mono Maxim., Carpinus cordata I., A. mandshuricum, Acer tegmentosum Maxim., Ulmus laciniata (Trautv.) Mayr., Ulmus japonica (Rehd.) Sarg., and Tilia amurensis Rupr. Within the context of the harvest priorities above, Li et al. ([18]) reported the detail principle of harvest. The cutting intensity was 9, 13, and 10% of standing volume for plots (a), (b), and (c), respectively.
Similarly, we set up two 70 × 70-m permanent plots in the pine-oak mixed forest in 2009-2010, one of which (h) was thinned with the aim of removing mature timber and optimizing stand structure. The whole thinning process was close to that in Korean pine broad-leaved forests. The target species in this stand contained U. glabra, P. armandii, Q. liaotungensis, Ace giraldii Pax., S. paniculata, Cerasus polytricha (Koehne) Yu and Li, C. kansuensis, and Carya cathayensis Sarg. The cutting intensity was 11% ([11], [18]).
Data analysis
We defined a “structural unit” as a combination of any tree and its four nearest neighbors. Any structural unit can be simultaneously described by several factors, such as tree species, tree size, and distribution in the space. These factors can be well expressed by the stand structure parameters mingling index (M, [9], [13] - eqn. 1), dominance index (U, [10], [33] - eqn. 2), and uniform angle index (W, [16], [6] - eqn. 3). The mingling index refers to the probability of a reference tree to belong to the same species as its four nearest neighbors, and has five possible values: 0.00, 0.25, 0.50, 0.75, and 1.00. A higher value implies a larger number of species in the structural unit. Dominance index reflects the relationship between the size of a reference tree and its four nearest neighbors. It also has five possible values: 0.00, 0.25, 0.50, 0.75, and 1.00. A higher value implies that the reference is larger (dominant) than all four neighbors. The uniform angle index indicates the spatial dispersion of the four nearest neighbors around the reference tree. Increasing values (0.00, 0.25, 0.50, 0.75, and 1.00) indicate a transition from regular to random to clumped spatial pattern ([9], [33], [32]).
The mingling index M is calculated as (eqn. 1):
where vij takes the value 1 if the j-th neighbor (spj) does not belong to the same species as the reference tree i (spi), and the value 0 otherwise. The dominance index U is calculated as follows (eqn. 2):
where kij takes the value 1 if the j-th neighbor (dj) is smaller than the reference tree i (di), and the value 0 otherwise. The uniform angle index W is (eqn. 3):
where zij takes the value 1 if the α angle is smaller that α0 = 72°, and the value 0 otherwise.
These stand structure parameters have clear biological significance and can be rapidly assessed in the field, making the selection of candidate trees possible by evaluating the relationship between each reference tree and its four nearest neighbors. When any two parameters are joined together, three bivariate distributions of stand structure parameters can be obtained: mingling-dominance (M-U), mingling-uniform angle index (M-W), and dominance-uniform angle index (U-W). Each joint probability includes 25 (5 × 5) types of structural combinations ([16]). Corresponding to the bivariate distributions of stand structure parameters, three thinning priority indices (Prij) are obtained if we divide the probability of each structural combination of harvested wood and that of the total stand before the cut, namely, v_ij, k_ij and z_ij. Each of them includes two main attributes of tree species relating to thinning and the results can reflect trees that are likely to be selected in different structural combinations. The greater priority value implies a higher probability of selection. Foresters could also use these thinning priority indices to predict the trees to be cut under the conditions of similar thinning rules. Thinning priorities for each bivariate value of the three indices were computed ex-post in each harvested plot (a-h) according to the following equations (eqn. 4, eqn. 5, eqn. 6, eqn. 7):
where Prij is the thinning priority index of structural combination ij (higher values = tree more intensely selected for removal); ρij is the proportion of harvested trees in structural combination ij (i.e., the total number of trees harvested were divided by each in the structural combination of trees harvested); pij is the proportion of trees in structural combination ij before harvest (i.e., the total number of trees were divided by each in the structural combination of the whole plot before harvest); nij(h) is the number of trees in the structural combination of trees harvested; N(h) is the total number of harvested trees; nij(bh) is the number of trees in the structural combination of the whole plot before thinning; Ntot is the total number of trees before harvest; i = 0.00, 0.25, 0.50, 0.75, 1.00; j = 0.00, 0.25, 0.50, 0.75, 1.00.
Results
v_ij of the four managed plots
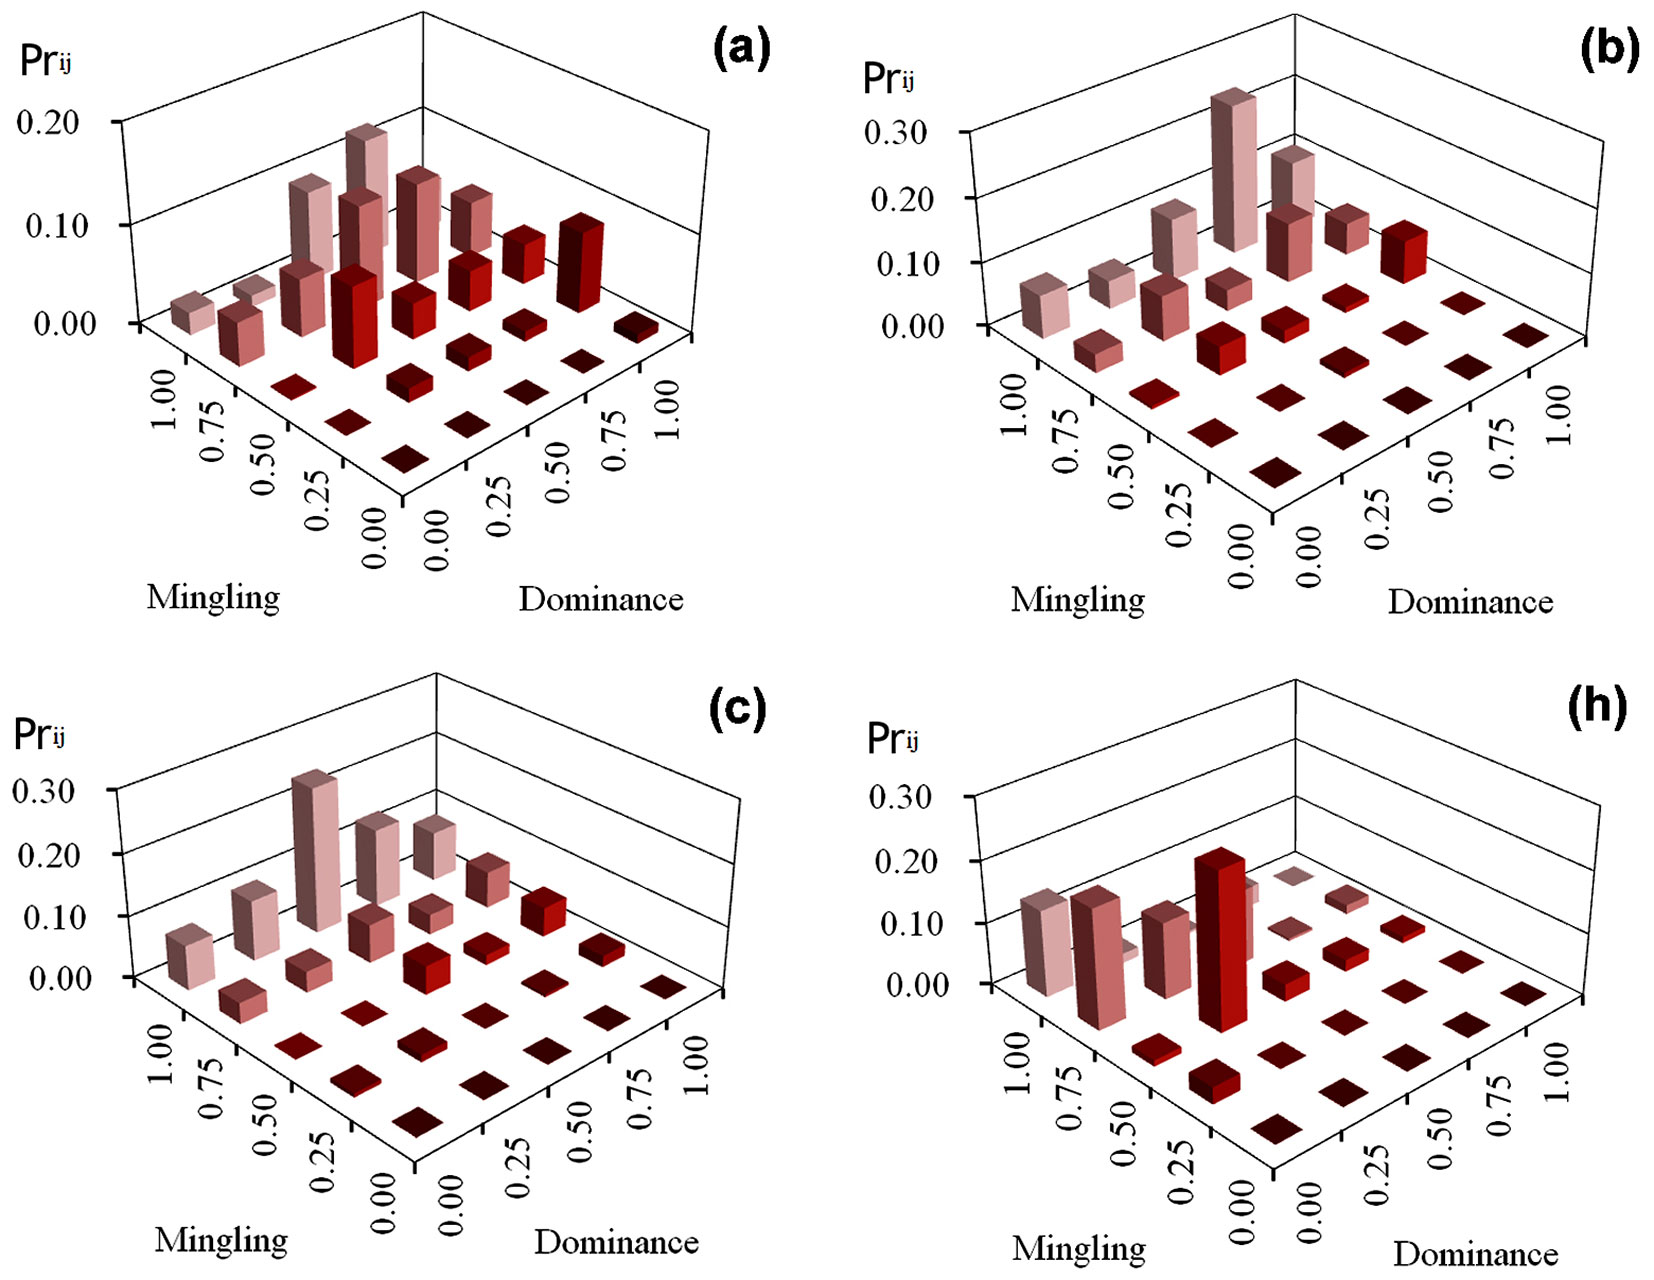
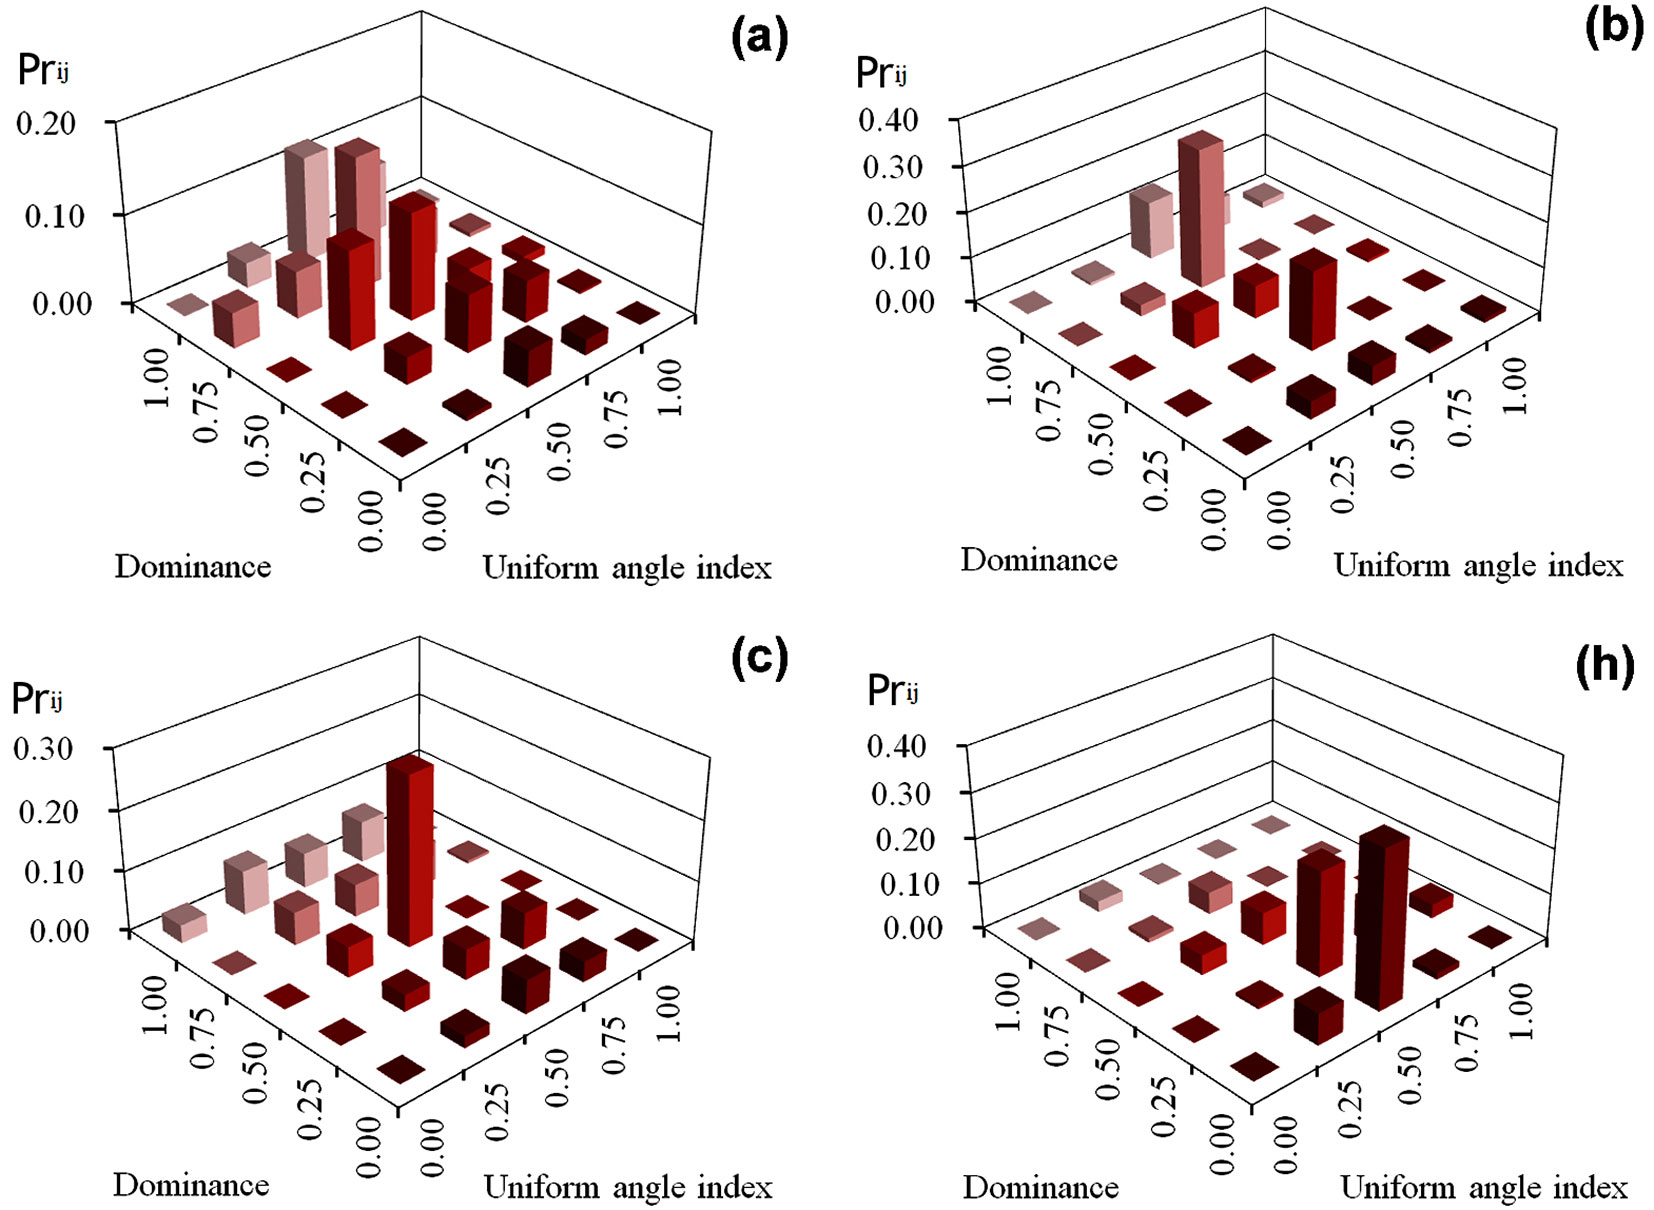
In plot (a), approximately half of the trees were assigned to a high selection priority (Prij >10%) based on high dominance index of neighbors (U = 0.75 and 1.00), accounting for 51.4% of the whole plot and high species mingling index (M = 0.75 and 1.00), representing 66.4% of all trees across the 25 structural combinations (Fig. 2a). In plots (b) and (c) the priority index was similarly distributed, with a maximum of 24%, and increased with increasing the mingling index. The highest values occurred for combinations of M = 1.00 / U = 0.75 and M = 1.00 / U = 0.50, respectively, and were 7.6 times higher than the average priority index of the other 23 structural combinations (Fig. 2b, Fig. 2c). The highest priority indices in plot (h) were primarily associated to two kinds of structural combinations, M = 0.75 / U = 1.00 and M = 0.50 / U = 0.25, accounting for 19.4 and 25.5% of all trees in the plot, and were 9.9 and 13 times higher, respectively, than the average of the residual 23 structural combinations (Fig. 2h) .
Fig. 2 - v_ij values of trees in four managed plots.
k_ij of the four managed plots
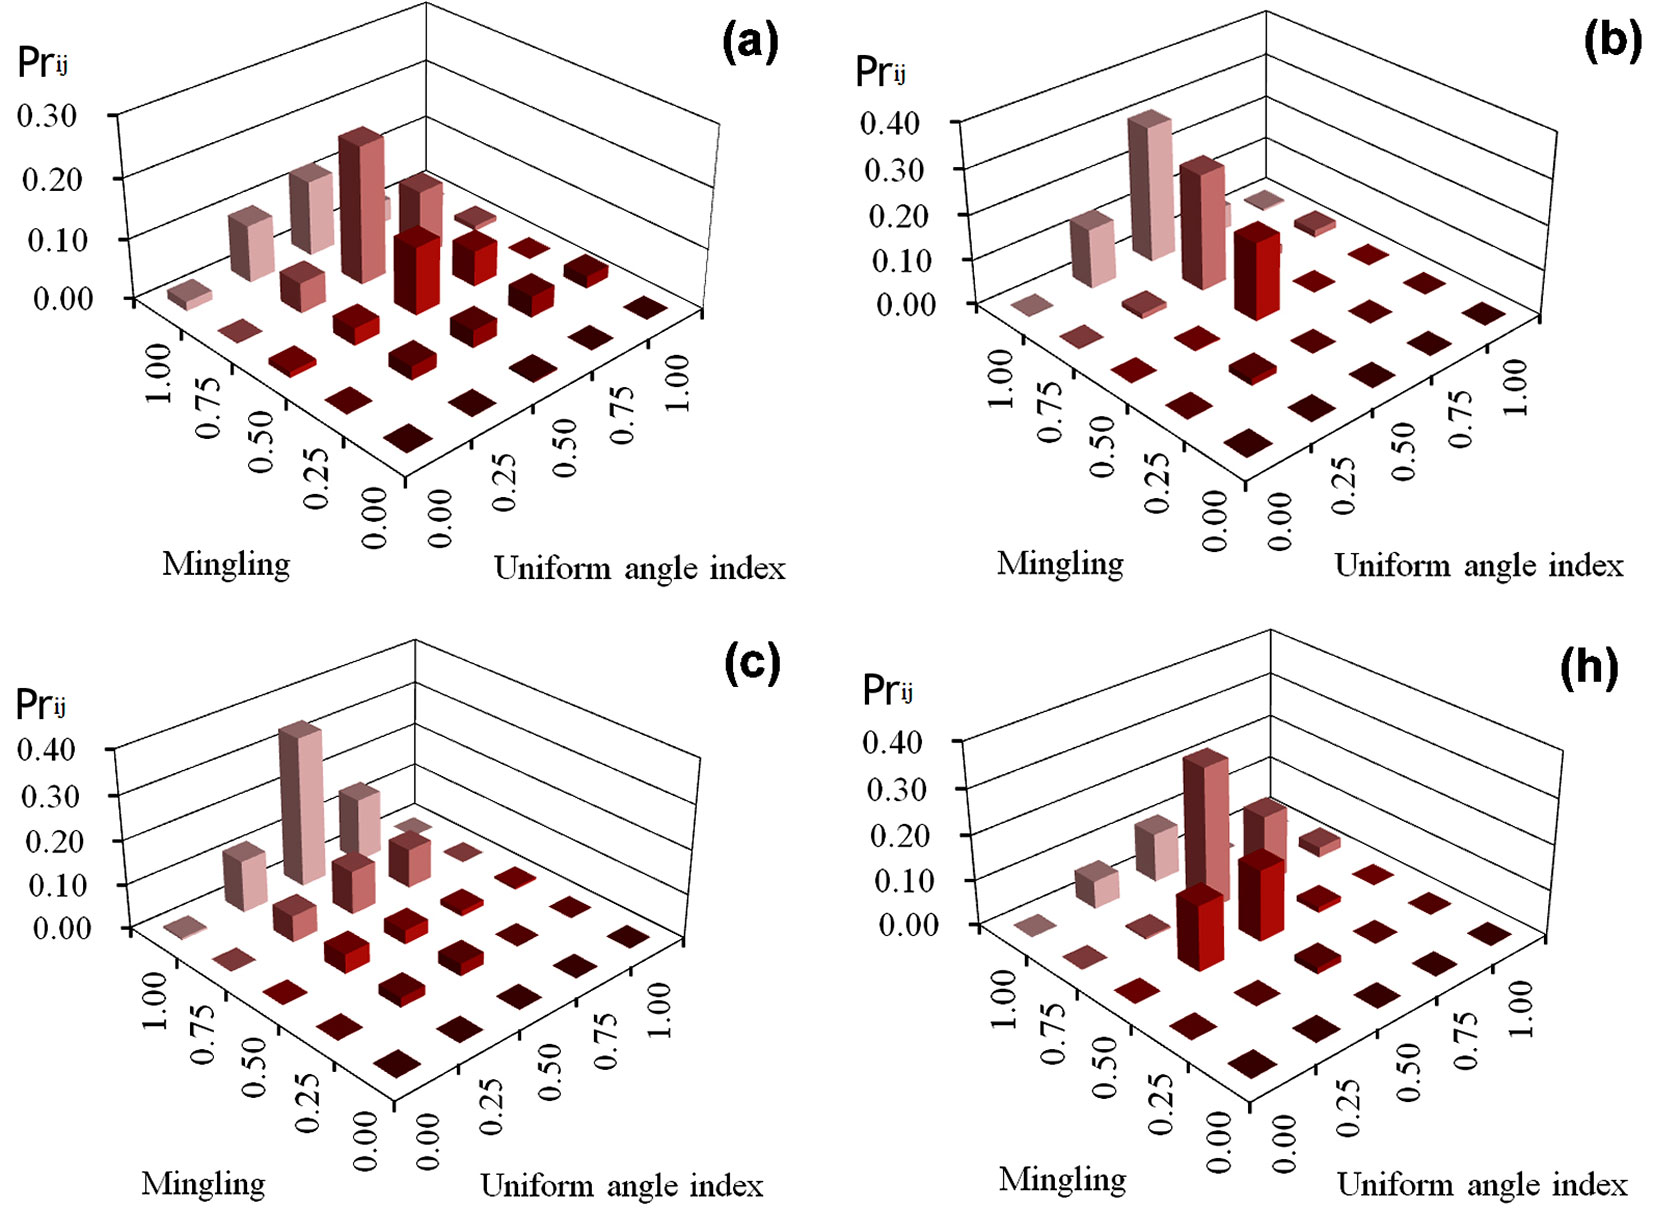
Most high M-W priority indices in plots (a), (b), (c), and (h) were associated to W = 0.50, accounting for 50.1%, 74.0%, 50.0%, and 60.0%, respectively of all trees in each plot (Fig. 3), and to M = 0.75 and 1.00 (67.7%, 80.7%, 85.7%, and 67.0% of trees in plots a, b, c, and h, respectively). The highest priority index values in plots (h) and (a) were 23.0% and 30.6%, respectively (M = 0.75 / W = 0.50), while in plots (b) and (h) they were 34.1% and 31.9%, respectively (M = 1.00 / W = 0.50). In addition, approximately 87.4% and 77.4% of the trees in plots (b) and (h) were concentrated in four structural combinations, while 60.4% of the trees in plot (c) were concentrated in three structural combinations (Fig. 3).
Fig. 3 - k_ij values of trees in four managed plots.
z_ij of the four managed plots
In plot (a), approximately 94% of the trees had W = 0.25 to 0.75, while only 6.0% exhibited a clumped (W = 1.00) or regular (W = 0.00) distribution of neighbors (Fig. 4). High priority indices also fell on the subdominant and suppressed reference trees (U = 0.50-1.00), making up 79.2% of the whole plot. The highest priority in plots (b), (c), and (h) was assigned to trees with W = 0.50 (72.8%, 50.2%, and 69.8% of the trees, respectively); among them, 48.3% of the trees in plot (b) occurred in two structural combinations: U = 0.75 / W = 0.50 and U = 0.25 / W = 0.50, while the highest priority index in plot (c) was at structural combination U = 0.50 / W = 0.50 (28.2% of the trees in the plot). The two highest indices in plot (h) occurred at the structural combinations U = 0.25 / W = 0.50 and U = 0.00 / W = 0.50, and together made up 57.5% of the plot. Their mean value was much greater than the average of the residual 23 structural combinations.
Fig. 4 - z_ij values of trees in four managed plots.
Discussion
Thinning directly influences tree growth, mortality, spatial distribution, and species diversity. In SBFM, the selection of trees to be cut within each structural unit is determined by the spatial relationship between a tree and its neighbors, including factors such as tree species, size, and spatial pattern. The close connection between these factors makes the process of selection direct and simple, and the application of this method to the management of natural forests has achieved some success ([11], [6], [18]). The thinning priority indices proposed in this paper can determine what characteristics of trees are preferred and can be used as quantitative tools to apply or simulate thinning in uneven-aged, mixed forests.
Three types of priority indices, in the form of bivariate distributions, described the probability to be selected for harvest of trees in four sample plots. v_ij indicated that high-priority trees selected for removal were usually surrounded by trees of different species, and their social status ranged from subdominant to suppressed (except in mixed pine-oak forest where subdominant trees in medium mixtures and dominant trees in high mixtures were chosen). k_ij showed that trees in high mixtures and random distributions were most likely to be cut. z_ij implied that thinned trees had usually randomly distributed neighbors, while their status ranged from suppressed (plots a-c, Korean pine-broadleaved forest) to dominant (plot h, pine-oak forest).
These results are closely related to the development phase and the structure characteristics of a stand before a cut. The Korean pine broadleaved forest and pine-oak mixed forest were natural secondary stands that had gone without large disturbances for long periods of time and showed random stem distribution patterns and high levels of tree size differentiation. Therefore, many trees selected for harvest from these plots were likely to be randomly surrounded by or mixed with other species. The thinning steps effetely improved the whole mixture and kept four stands in random pattern ([18]). At the same time, because of the structural diversity of the stands, it is impossible for thinning to concentrate only on a single structural combination. However, in each plot exists a particular structural combination with a higher priority for selection, which may be indicative of the thinning criteria to be followed in similar forest stands and for similar management objectives. i.e., remove unhealthy individuals, prioritize tree size differentiation, and at the same time harvest commercially sized trees. Thus, the subdominant and dominant individuals became the preferred candidates.
A similar thinning priority index based on the joint probability distribution of species mingling index (M) and diameter differentiation (T) has been suggested in a Fagus sylvatica L. and Picea abies (L.) Karst. mixed forest in Southern Germany ([5], [6]). The thinning priority indices proposed in this study have a similar structure to such M-TPrij, but their application in the field is more straightforward, and they correct one of its shortcomings, i.e., they take into account the change in the actual number of trees in each structural combination before and after the thinning.
Conclusion
Selecting trees for harvest from an uneven-aged mixed forest is a complex decision-making process. Appropriately quantifying stand structure characteristics and objectives when thinning, including tree spatial patterns, may help to achieve sustainable forest management practices. Following the application of SBFM, the thinning priority indices put forward in this study adequately describe the spatial relationship between each tree and its nearest neighbors and treat bivariate structural combinations as basic thinning units when describing the thinning priority of harvested trees with different structural characteristics. Their application can reduce the subjectivity and improve the speed and accuracy of the choice of trees to be harvested in uneven-aged mixed forests. The benefit of using these indices is that the multi-faceted relationships among trees are clearly defined, with a directly relationship to the choice of trees to cut. Thinning priority indices may be suitable for application in different types of forest, and require a full investigation of the whole stand before they can be applied to management decisions. Different priorities are likely to emerge from the combination of thinning index, stand structure and management goals, therefore the implications of choosing one or another of the thinning priority indices as the basis for forest density management may need further research.
List of abbreviations
The following abbreviations have been used throughout the text:
W: uniform angle index;M: mingling index;U: dominance index;- DBH: diameter at breast height;
- SBFM: structure-based forest management;
T: diameter differentiation.
Acknowledgments
This paper was financially supported by National Sci-Tech Support Plan of China (2012BAD22B03) and National Science Foundation of China (No.31400542). Hongxiang Wang and Gongqiao Zhang carried out the field measurements, Shaoming Ye performed the statistical analysis, Gangying Hui conceived the study and helped to draft the manuscript, Yuanfa Li wrote and finished the manuscript.
References
Gscholar
Gscholar
Gscholar
Gscholar
Gscholar
Gscholar
Gscholar
Gscholar
Authors’ Info
Authors’ Affiliation
Shaoming Ye
College of Forestry, Guangxi University, Daxue East Road 100, Xixiangtang District, Nanning, Guangxi Province 530004 (China)
Hongxiang Wang
Gongqiao Zhang
Key Laboratory of Tree Breeding and Cultivation, State Forestry Administration, Research Institute of Forestry, Chinese Academy of Forestry, Box 1958, Beijing 100091 (China)
Corresponding author
Paper Info
Citation
Li Y, Hui G, Wang H, Zhang G, Ye S (2017). Selection priority for harvested trees according to stand structural indices. iForest 10: 561-566. - doi: 10.3832/ifor2115-010
Academic Editor
Giorgio Alberti
Paper history
Received: May 16, 2016
Accepted: Feb 19, 2017
First online: May 05, 2017
Publication Date: Jun 30, 2017
Publication Time: 2.50 months
Copyright Information
© SISEF - The Italian Society of Silviculture and Forest Ecology 2017
Open Access
This article is distributed under the terms of the Creative Commons Attribution-Non Commercial 4.0 International (https://creativecommons.org/licenses/by-nc/4.0/), which permits unrestricted use, distribution, and reproduction in any medium, provided you give appropriate credit to the original author(s) and the source, provide a link to the Creative Commons license, and indicate if changes were made.

Web Metrics
Breakdown by View Type
Article Usage
Total Article Views: 51516
(from publication date up to now)
Breakdown by View Type
HTML Page Views: 42701
Abstract Page Views: 3486
PDF Downloads: 3927
Citation/Reference Downloads: 34
XML Downloads: 1368
Web Metrics
Days since publication: 3343
Overall contacts: 51516
Avg. contacts per week: 107.87
Article Citations
Article citations are based on data periodically collected from the Clarivate Web of Science web site
(last update: Mar 2025)
Total number of cites (since 2017): 21
Average cites per year: 2.33
Publication Metrics
by Dimensions ©
Articles citing this article
List of the papers citing this article based on CrossRef Cited-by.
Related Contents
iForest Similar Articles
Research Articles
Assessment of age bias in site index equations
vol. 9, pp. 402-408 (online: 11 January 2016)
Research Articles
Soil CO2 efflux in uneven-aged and even-aged Norway spruce stands in southern Finland
vol. 11, pp. 705-712 (online: 06 November 2018)
Research Articles
Remote sensing of Japanese beech forest decline using an improved Temperature Vegetation Dryness Index (iTVDI)
vol. 4, pp. 195-199 (online: 03 November 2011)
Research Articles
Twenty years of conversion: from Scots pine plantations to oak dominated multifunctional forests
vol. 10, pp. 75-82 (online: 19 October 2016)
Research Articles
Estimation of forest leaf area index using satellite multispectral and synthetic aperture radar data in Iran
vol. 14, pp. 278-284 (online: 29 May 2021)
Research Articles
The conversion into high forest of Turkey oak coppice stands: methods, silviculture and perspectives
vol. 13, pp. 309-317 (online: 10 July 2020)
Research Articles
Modelling dasometric attributes of mixed and uneven-aged forests using Landsat-8 OLI spectral data in the Sierra Madre Occidental, Mexico
vol. 10, pp. 288-295 (online: 11 February 2017)
Research Articles
An index of structural complexity for Apennine beech forests
vol. 8, pp. 314-323 (online: 03 September 2014)
Research Articles
Do different indices of forest structural heterogeneity yield consistent results?
vol. 15, pp. 424-432 (online: 20 October 2022)
Research Articles
Tree-oriented silviculture: a new approach for coppice stands
vol. 9, pp. 791-800 (online: 04 August 2016)
iForest Database Search
Search By Author
Search By Keyword
Google Scholar Search
Citing Articles
Search By Author
Search By Keywords
PubMed Search
Search By Author
Search By Keyword


