
Comparison of drought stress indices in beech forests: a modelling study
iForest - Biogeosciences and Forestry, Volume 9, Issue 4, Pages 635-642 (2016)
doi: https://doi.org/10.3832/ifor1630-008
Published: May 06, 2016 - Copyright © 2016 SISEF
Research Articles
Abstract
Two drought stress indices were applied to managed as well as old-growth beech forests and gaps for the 2001 to 2013 period to aid in the development of an efficient tool for field water supply diagnosis. The relative extractable soil water (REW), which was calculated from the soil water content in the root zone, and the transpiration index (TI), calculated as the ratio between the actual and potential transpiration were used. Both indices were calculated on a daily basis using the water balance model BROOK90, which was fitted and tested using measured data on throughfall and soil water content. A sensitivity analysis apportioned to the input parameters of the drought stress indices was conducted to assess uncertainty. Both drought stress indices showed the greatest drought stress in the years 2009, 2003 and 2011, as also indicated by the Standardized Precipitation Evapotranspiration Index (SPEI) at the nearest meteorological station. However, drought stress intensity and duration differed between the indices and study sites. Greater water supply stress was shown in the forests than the gaps. Furthermore, the agreement among the indices was smaller for gaps compared with forests, which implies that careful index selection is needed when comparing water supply stresses in different stages of forest stand development. Due to the low amount of input data required and the parameters that can be measured with relative ease in the field, REW might be an efficient tool for field water supply diagnosis when analyzing the drought stresses of similar forest types and at unique stages of development. REW satisfactorily indicated drought stress in forests but to a lesser extent in gaps. TI demonstrated more consistent differences in drought stress between forests and gaps and therefore proved to be the appropriate index for a detailed analysis of drought stress variation between different stages of forest stand development. However, due to a greater number of required input data and more demanding parameters, TI appears to be a more complex tool than REW for field water supply diagnosis in forests.
Keywords
Relative Extractable Soil Water, Transpiration Index, Standardized Precipitation Evapotranspiration Index, Fagus sylvatica, BROOK90 Model, Managed Forest, Old-growth Forest, Canopy Gap
Introduction
Drought represents a weather-specific phenomenon that affects forests to varying extents and may result in a long-term decrease in forest productivity ([4], [5]) or forest decline ([57], [6], [7], [3]). Over the last 30 years, Europe has been affected by a number of major drought events, most notably in 1976 (Northern and Western Europe), 1989 and 1991 (most of Europe - [36]). An extreme drought during the summer of 2003 led to broad disturbances in European forest ecosystems, which have been reviewed by several authors ([24], [37], [32], [46]). Repeated droughts are assumed to be responsible for longer fire seasons, increased fire risk ([38]) and widespread forest mortality ([6], [7], [2]).
A drought index is usually the primary variable used to assess the effects of drought and to define drought parameters, which include intensity, duration, severity and spatial extent ([36]). Most studies on water supply stress to date have focused on drought stress indices based on climate data ([36], [15]). Some drought stress indices incorporate topographic and edaphic variability to assess fine-scale soil water availability ([16], [39]). However, physiological indices, such as those related to soil water deficits ([58]) or transpiration rates ([61], [57]), have been shown to be better correlated with radial growth and enable biological interpretations of vegetation responses to climate ([35], [48]).
Currently, European beech (Fagus sylvatica L.) represents the most ecologically and economically important forest tree species presently supported by forest management in Slovenia ([30]). However, the growth and competitive ability of beech may be adversely affected by climate change, particularly drought ([47]). Drought stress would be more likely to occur in shallow soils such as those in this study. There have been several studies on water supply in canopy gaps ([42], [13], [54]) in which soil water availability influences forest regeneration and establishment ([26], [33], [53]). However, drought stress studies are scarce in old-growth forests, and some studies indicate differences in water supply stress between managed and old-growth forests at similar sites ([41], [56], [54]).
The present study compared the performance of two drought stress indices that differed in structure and input data demand in beech forests on shallow soils in Slovenia. The study was carried out in a forest and a gap in an old-growth and a managed forest over a thirteen year period, thereby covering a range of environmental conditions likely to be encountered in Slovenian beech forests. An efficient drought stress index for field water supply diagnosis was sought. We applied (i) the relative extractable soil water (REW), which simulates water deficiency (the availability of soil water in the rooting zone - [6], [24]) and (ii) the actual and potential transpiration ratio (i.e., transpiration index, TI - [28]), that considers both atmospheric conditions and the properties and physiological processes of forests and their soils ([60], [43]). Both REW and TI were compared with the Standardized Precipitation Evapotranspiration Index (SPEI - [51]), which is a climatic drought index, using precipitation and reference evapotranspiration at the nearest meteorological station. REW and TI were calculated on a daily basis using measured and modeled data with the water balance model BROOK90 ([18]). We also investigated whether the water supply stress differed between the four sites. This was performed to demonstrate the effect of gap creation as a forest management practice on forest regeneration water supply stress ([53]). The comparison of selected drought stress indices should aid in the development of an efficient tool for field water supply diagnosis ([4]). Such a tool would enable forest managers to develop forest management strategies for adapting to climate change ([29]).
Methods
Site description
The forests under investigation are located in southeastern Slovenia (45° 20′ N, 14° 30′ E, elevation 860-890 m a.s.l.). They belong to the Omphalodo-Fagetum association ([40]), which is dominated by silver fir (Abies alba Mill.) and European beech (Fagus sylvatica L.). Norway spruce (Picea abies [L.] Karst.), maple (Acer pseudoplatanus L.), elm (Ulmus glabra Huds.), and lime (Tiliacordata Mill.) make up less than 1% of the total stem volume ([53]). The bedrock consists of Cretaceous limestone, and the soil depth varies from 10 to 40 cm depending on the highly variable karstic micro-relief. The prevailing soil units were Eutric Cambisols and Rendzic Leptosols ([50]). The climate of the region is montane with an annual precipitation of up to 1600 mm. The nearest meteorological station, Kočevje (45° 39′ N, 14° 51′ E, 467 m a.s.l.), has recorded a long-term (1971-2000) annual average air temperature of 8.0 °C and annual precipitation of 1481 mm (Environmental Agency of the Republic of Slovenia archives). Based on this value and an environmental lapse rate of 6 °C per km of elevation, the long-term annual average temperature at the study area is 5.9°C ([55]).
The specific old-growth and managed forests in this study have similar elevation, aspect and slope. In the old-growth forest, an irregular-shaped gap was formed after windstorms during the winter of 2002-2003 (Tab. 1). In the managed forest, an irregular experimental clear-cut gap was created in the winter of 2000-2001. All of the trees in the experimental gap were harvested and carefully removed by horse skidding.
Tab. 1 - General characteristics of the study sites.
| Parameter | Managed | Old-growth | ||
|---|---|---|---|---|
| Forest | Gap | Forest | Gap | |
| Stem volume (m3 ha-1) | 255 | - | 746 | - |
| Basal area (m2 ha-1) | 17 | - | 49 | - |
| Year of creation | - | 2000 | - | 2003 |
| Shape and dimensions | - | Near-circular, 2375 m2 | - | Irregular, 710 m2 |
| Harvesting method | - | Experimental clear-cut | - | Windstorms |
| Forest floor vegetation - dominant species | Dryopteris filix-mas, Lamium orvala, Polystichum aculeatum | Fagus sylvatica | ||
| Ground vegetation cover (%) | 20 | 6 | 22 | 62 |
| Soil depth (cm) | 32.2 | 31.3 | 32.6 | 29.9 |
| Stoniness (% vol) | 24.4 | 22.3 | 29.7 | 23.1 |
| Soil Texture class | Loam | Loam | Clay loam | Clay loam |
Meteorological data and soil hydrological measurements
Meteorological data were collected above the tree crowns using an automatic weather station (Vantage Pro® wireless, Davis Instruments, Hayward, California, USA). Hourly average values of air temperature and humidity, wind direction and speed, and sums of precipitation were recorded ([55]). Missing air temperature and humidity data were substituted with data from the Kočevje meteorological station, and missing global radiation data were substituted with data from the Iskrba EMEP station (Environmental Agency of the Republic of Slovenia archives) using site-specific regression functions ([55]). In the years 2001 to 2007, monthly or biweekly precipitation (throughfall) was recorded in the forests and gaps at a height of 1.3 m using a series of nine funnel collectors (240 cm2 each) arranged along a regular grid (spacing: 5×5 m). Incidental precipitation was recorded monthly in the years 2001 to 2007 in an open field close to the study sites using the same type of funnel collectors. For the old-growth gap, which had naturally formed during the winter of 2002-2003, datasets from the years 2003 to 2007 were used.
Using representative soil samples taken from the prevailing soil units, the available water capacity of the mineral soil horizons was calculated for each site from pressure plate measurements of field capacity (moisture content at 0.033 MPa). The permanent wilting point (moisture content at 1.5 MPa) and saturated soil hydraulic conductivity were also determined. The average soil thickness at all sites was 40 cm, and this depth was assumed to be the rooting depth for all sites. The soil water content (SWC) of the 0-40 cm layer was measured monthly at three locations in each plot in 2003 and twice monthly from 2004 to 2007 using time domain reflectometry (TDR - Prenart Equipment, Frederiksberg, Denmark). Double probes were installed vertically, extending through the 40 cm layer, and included the organic layer. Soil-specific calibration curves for vertical TDR probes were used and were obtained using the calibration procedures described in Dirksen ([14]). During 2001 and 2002, SWC was determined once per month by taking three replicate volumetric soil samples at depths of 10, 20, and 40 cm in each plot and by measuring the weight loss after oven drying the samples at 105 °C for 24 h. The volumetric moisture contents were converted into depths of water (mm) by multiplying the values by the thickness of the soil layer and correcting for stone content.
The BROOK90 simulation
The water balance model BROOK90 Version 4.4g ([17], [28], [19]) was applied to forests and gaps to simulate the input parameters needed for the REW and TI calculations. The model calculates daily water fluxes (tree transpiration, evapotranspiration, interception, throughfall, soil evaporation, drainage) and SWC at different depths or for the whole rooting depth. Tree transpiration and soil evaporation are calculated separately using the Shuttleworth-Wallace method ([45]) modified to separate daytime from night time evaporation ([17]). Model parameterisation for the study sites is described in detail by Vilhar & Simončič ([54]).
The interception model was fitted by comparing the simulated and the measured monthly throughfall (TF) for the managed and old-growth forest from 2001 to 2003 and tested with the TF from 2004 to 2007. Additional model fitting was performed by comparing the simulated and measured daily SWC of the rooting zone (corrected for stone content) for forests and gaps using datasets from 2001 to 2004 and tested with datasets from 2005 to 2007. For the old-growth gap, which had naturally formed during the winter of 2002-2003, datasets from 2003 to 2007 were used. The extent of TF and SWC fit was evaluated by examining the linear correlation coefficient (r), which describes the degree of correspondence between the measured and simulated values; the index of agreement (D - [49]), which describes relative error; and the root mean square error (RMSE), which expresses the error between the measured and simulated values.
Drought stress indices
Relative extractable soil water (REW)
The relative extractable soil water (REW) indicates the availability of soil water in the rooting zone. As a simple drought stress index, the REW may be computed from soil water content in the root zone at any given time, as follows ([6], [24] - eqn. 1):
where SWCday is the daily soil water content (mm), whereas SWCmin and SWCmax are the minimum and maximum soil water content (mm) for the entire rooting zone during the period of interest. The REW is between 1.0 (maximum soil water content) and 0 (minimum soil water content). In the present study, the daily REW values for forests and gaps were calculated from the simulated daily SWC during the growing season (i.e., May to October) from 2001 to 2013 (with the exception of the natural gap from 2003 to 2013), using the BROOK90 model. For the REW calculation, the daily SWCmin and SWCmax for the entire modeling period were used. Because a site-specific critical value of the matrix potential was not available for the assessment of the soil water deficits, water supply stress was assumed to occur when the REW dropped below the threshold of 0.4 (REWc), thereby inducing stomatal regulation in forest trees ([22]). Although Lagergren & Lindroth ([31]) report on slightly lower REW threshold values for pine and spruce trees in Sweden, the threshold of REW < 0.4 has been widely used in different forest ecosystems ([6], [24], [35], [59]). Additionally, the duration of the water supply stress, i.e., the percentage of growing season days with an REW below 0.4 (REWc) for forests and gaps was calculated to quantify the duration of the water supply stress ([6]).
Transpiration index (TI)
The transpiration index (TI) is a daily ratio between simulated actual and potential transpiration. TI is a more complex drought stress indicator than REW because measurements of transpiration rates in forest ecosystems using the sap flow measurements of single trees and scaling up to forest stands (as in TI) are costly and time consuming ([23], [8]). Therefore, the mathematical modeling of transpiration rates has become an alternative approach in daily determinations of the seasonal variation of transpiration in forest trees ([21], [34]). In the present study, daily TI values for forests and gaps were calculated from simulated actual and potential transpiration during the growing season using the BROOK90 model from 2001 to 2013, with the exception of the natural gap from 2003 to 2013. Potential transpiration in the BROOK90 model is defined as the theoretical transpiration rate that would occur if the soil-plant system was able to satisfy the atmospheric demand and the stomatal regulation was unaffected by drought stress ([17]). Actual transpiration, by contrast, is defined as the actual transpiration rate with stomatal opening adapted to the current drought stress conditions. A TI equal to 1 indicates that the water supply of the forest is optimal, whereas a TI value of less than 1 indicates temporary water deficiency ([57]). Hammel & Kennel ([28]) defined sites as having frequent water deficiency when the 25th percentile of their daily TI values was below 0.95. Schwärzel et al. ([43]) reported that transpiration in beech stands was significantly reduced when the daily actual transpiration was < 70% of the daily potential transpiration (TI < 0.7). Therefore, the percentage of days with a TI below the critical threshold of 0.7 (TIc) for each growing season was calculated to quantify the duration of water supply stress.
Precipitation Evapotranspiration Index (SPEI)
The Standardized Precipitation Evapotranspiration Index (SPEI - [51]) is a climatic drought index that indicates general water supply for a study area. The SPEI may be calculated using monthly (or weekly) precipitation and grass reference evapotranspiration at the nearest meteorological station as follows (eqn. 2):
where Pi is monthly (or weekly) precipitation and Ref ETPi is grass reference evapotranspiration, which is calculated using the FAO-56 Penman-Monteith equation ([1], [51]). The SPEI varies between maximum precipitation (when Ref ETP is zero) and reaches negative values when Ref ETPi exceeds the precipitation amount, indicating a negative climatic water balance on a monthly basis. In the present study, the monthly SPEI was calculated from P and Ref ETP data at the Kočevje meteorological station (Environmental Agency of the Republic of Slovenia archives) and compared with monthly REW and TI for forests and gaps. Additionally, the percentage of days with a negative climatic water balance (SPEI < 0.0) for each growing season from 2001 to 2013 was calculated to quantify the duration of the negative climatic water balance in the study area.
Statistical analyses
Due to a non-normal distribution, the Spearman’s rank correlation coefficient (R) was used to evaluate the relationship between the daily REW and TI in forests and gaps. Differences between REW and TI at each site were assessed using the Kruskal-Wallis test. Probability values of p < 0.05 (*), p < 0.01 (**) and p < 0.001 (***) were considered significant. The data analysis was performed using the software package Graphpad® ([25]).
Results
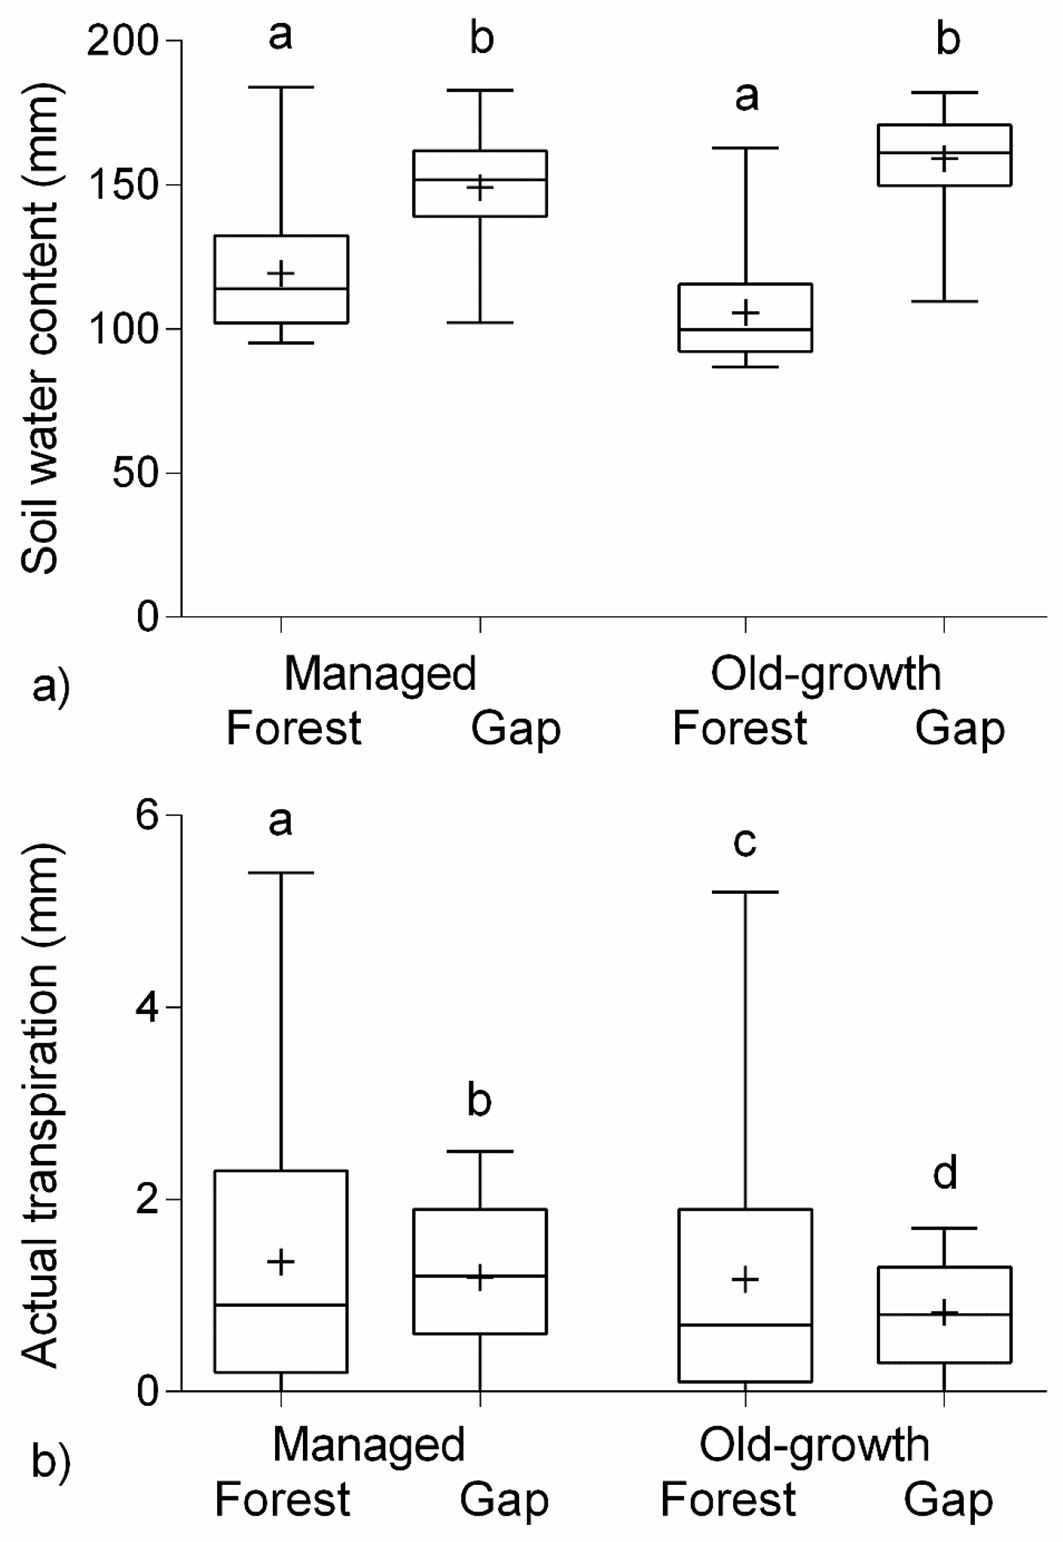
The results of this study clearly demonstrate significantly greater simulated daily SWC in gaps compared with forests during the growing seasons 2001-2013 (H = 5615, df = 3, N = 9200, p < 0.001 - Fig. 1a). Furthermore, the simulated daily actual transpiration significantly differed between all sites over the course of the study period (H = -486.6, df = 3, N = 9200, p < 0.001) with higher average seasonal values in the forests than the corresponding gaps (Fig. 1b).
Fig. 1 - (a) Daily mean soil water content (SWC, mm) and (b) daily mean actual transpiration (mm), simulated by the BROOK90 model in the managed and old-growth forests and gaps from 2001 to 2013 growing seasons (i.e., May - October; n = 2392 for each plot), with the exception of the natural gap from 2003 to 2013 (n = 2024); “+” indicates the mean value; significant differences after Kruskal-Wallis test are marked with different letters.
BROOK90 model fitting and testing
Tab. S1 in Supplementary Material summarises the input parameters used in the simulations. Monthly TF and daily SWC were accurately simulated in the BROOK90 model in respect to both time and magnitude for all sites. The average D was 0.881 and the average RMSE was 11.8 for the SWC model fitting; the average D was 0.754 and the average RMSE was 16.1 for model testing (Tab. S2 and Fig. S1 in Supplementary Material). For TF, the average D for model fitting was 0. 823 and average RMSE was 49.4; for model testing, the average D was 0.752 and average RMSE was 78.1 (Tab. S3 and Fig. S2 in Supplementary Material).
Drought stress indices
The daily average air temperature in the period from 1971 to 2000 at the Kočevje meteorological station was 8.0 °C with a minimum in January (-1.3 °C) and maximum in July (17.5 °C). The daily average air temperature for the study period from 2001 to 2013 at the Kočevje meteorological station was 9.2 °C, with the highest daily air temperature reported in 2002 (9.7 ± 7.4 °C) and 2007 (9.7 ± 7.3 °C) and the lowest in 2005 (8.1 ± 8.5 °C). The average annual precipitation from 2001 to 2013 was 1408 mm, which was 95% of the long-term (1971-2000) average annual precipitation for the area (1481 mm). The years 2011 and 2003 were substantially drier than normal. There was 1025 mm of precipitation in 2011 and 1152 mm in 2003, accounting for 69% and 78% of the long-term average. When accounting only for growing season, however, precipitation was lowest in 2009 (516 mm), followed by the 2003 (626 mm) and 2013 (634 mm), corresponding to 64%, 77% and 78% of the long-term (1971-2000) average seasonal precipitation for the area (813 mm). Furthermore, the annual SPEI was lowest in 2011 with 267 mm, followed by 358 mm in 2003, corresponding to 37% and 50%, respectively, of the long-term annual SPEI (717 mm from 1971 to 2000). When accounting for only growing seasons, however, a SPEI was lowest in 2009 (-21.5 mm), followed by the 2003 growing season with an SPEI of 2.3 mm. Furthermore, the percentage of days with SPEI < 0.0 was highest in the 2011 growing season (81%), followed by that in the 2001, 2003 and 2009 growing seasons (79%).
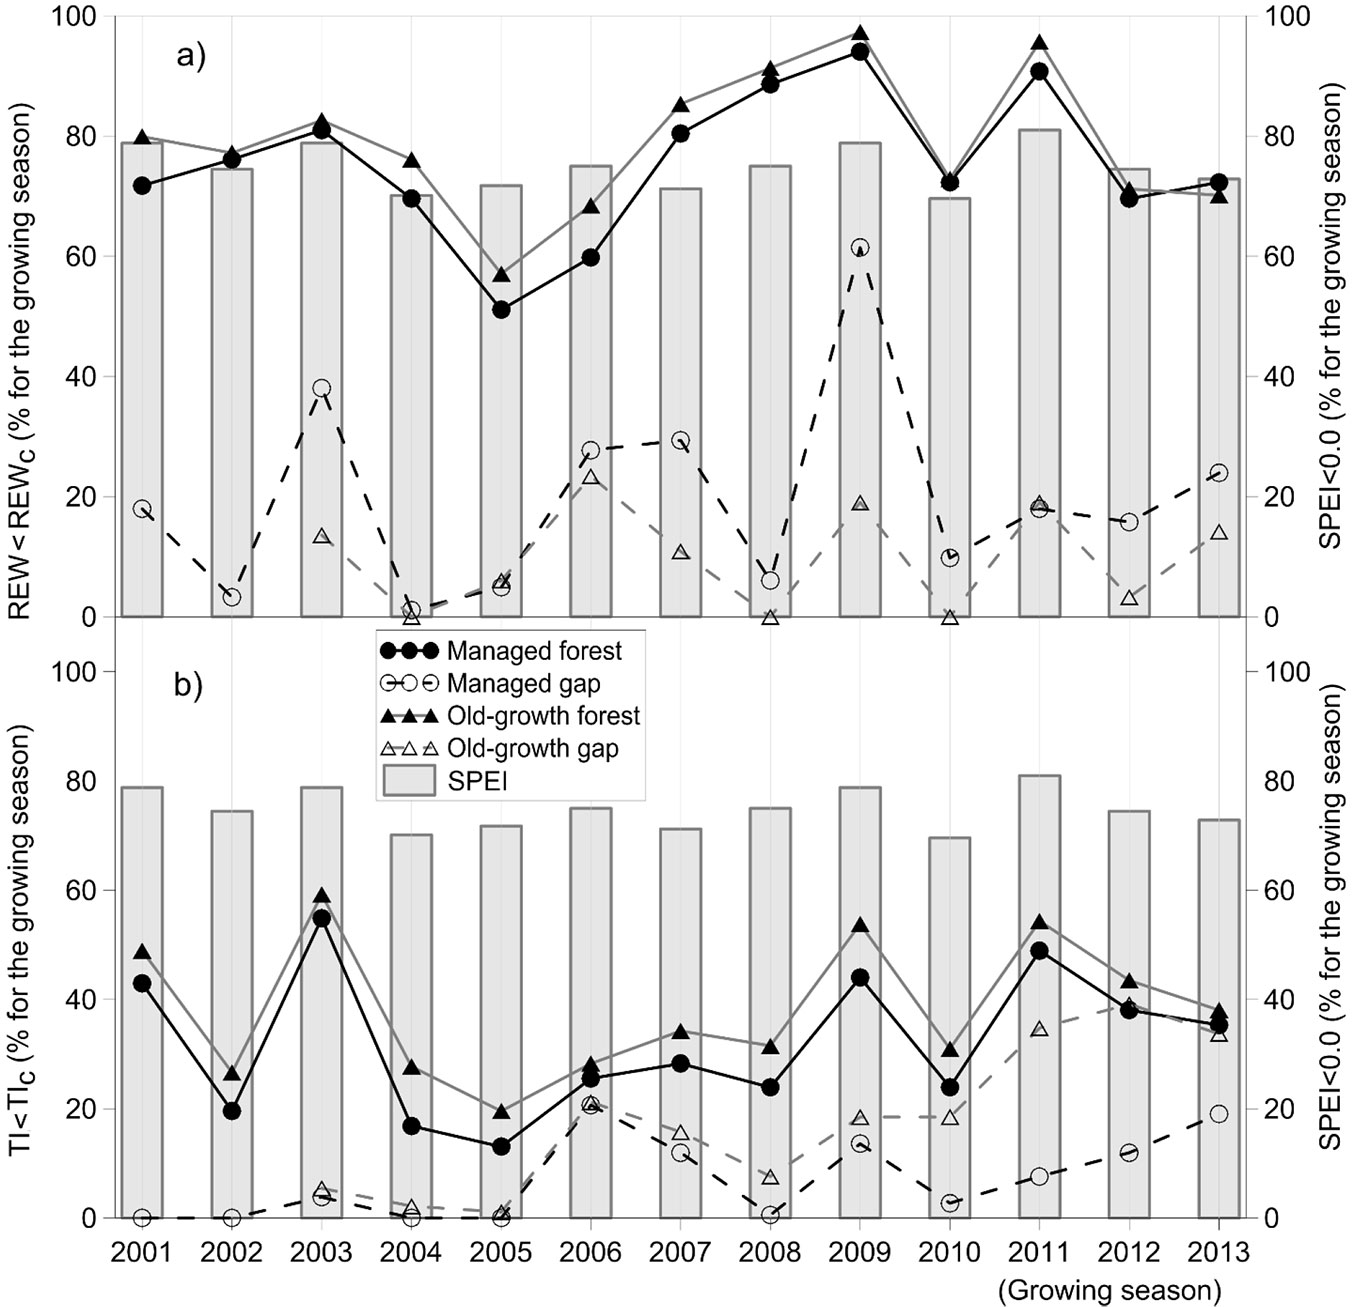
The resulting time-courses of the daily REW and TI from 2001 to 2013 followed the opposite pattern of precipitation in the open area and indicated the highest water deficiency in June, July and August at all sites and sufficient water supply in the autumn months. The drought stress indices showed the greatest drought stress in the growing seasons of 2003, 2009 and 2011; however, the drought stress intensity and duration differed between indices and study sites. According to REW, drought stress was most intense in 2009 at all sites with the exception of the old-growth site with a maximal number of days with REW < REWc in 2006 (Fig. 2). Longer drought spells in both forests were also indicated in 2011 and 2008, when the number of days with REW < REWc was more than 88% of the days in the growing season. TI indicated the greatest drought stress in the managed forest in 2003 and the managed gap in the 2006 growing season. In the old-growth forest, the greatest drought stress according to TI was in 2011; however, the maximal number of days with TI < TIc occurred in 2003 (59% of days in the growing season). For the old-growth gap, however, the greatest drought stress according to TI was in 2013 but the maximal number of days with TI < TIc occurred in 2012 (39% of days in the growing season).
Fig. 2 - The number of days with a Standardized Precipitation Evapotranspiration Index below 0.0 (SPEI < 0.0) at the Kočevje meteorological station. (a) The number of days with a relative extractable water content below 0.4 (REW < REWc, %) and (b) the number of days with a transpiration index below 0.7 (TI < TIc, %) for the managed and old-growth forests and gaps for the 2001 to 2013 growing seasons (i.e., May - October), with the exception of the natural gap from 2003 to 2013.
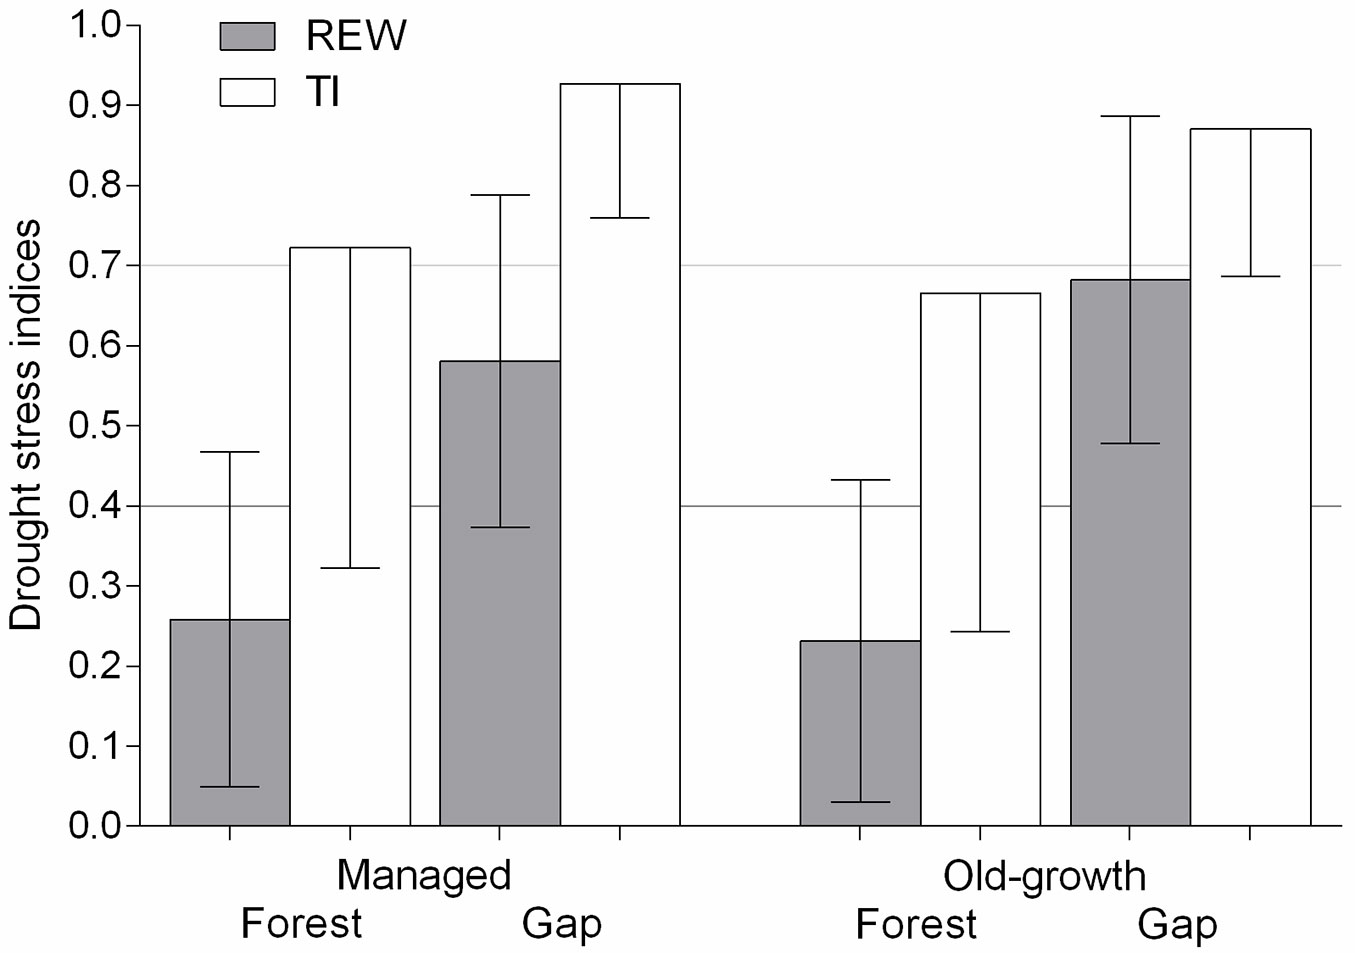
Both REW and TI indicated significantly greater drought stress in forests than gaps (REW H = 4283.8, TI H = 327.5, df = 3, N = 9200, p < 0.001 - Fig. 3). Furthermore, slightly greater drought stress was shown for the old-growth forest by both indices compared with managed forest. Nevertheless, REW indicated greater and TI minor drought stress in the managed compared with old-growth gap. As a consequence, the number of days with TI < TIc indicated a similar difference in drought stress duration between forests and gaps (25% in managed and 23% in old-growth sites), whereas the number of days with REW < REWc indicated larger differences in the old-growth (70%) compared with managed sites (55%).
Fig. 3 - Daily mean relative extractable soil water (REW) and transpiration index (TI) in the managed and old-growth forests and gaps from 2001 to 2013 growing seasons (i.e., May - October), with the exception of the natural gap from 2003 to 2013. REW and TI equaling 1 indicate no drought stress.
Daily values of both indices were in good agreement between the forests (REW R = 0.995, TI R = 0.949; p < 0.05) as well as between the gaps (REW R = 0.898, TI R = 0.882; p < 0.05). However, there was slightly lower agreement in daily REW or TI between forests and gaps (daily REW between the managed forest and gap: R = 0.638, daily TI R = 0.789; daily REW between the old-growth forest and gap: R = 0.679, daily TI R = 0.657; p < 0.05).
When comparing the drought stress intensity at all sites, we found significant differences between the daily REW and TI (H = 733.2, df = 1, N = 5486, p < 0.001), as well as between the days below REWc and those below TIc (H = 2039.9, df = 1, N = 9200, p < 0.001). Nevertheless, the agreement between the days below REWc and those below TIc was slightly higher (R = 0.591) than the agreement between the REW and TI (R = 0.567, p < 0.05), respectively. There was a better agreement between daily REW and TI for the old-growth (R = 0. 831) and managed forests (R = 0. 815, p < 0.05) than between REW and TI for the gaps (R = 0.574 for the managed gap, R = 0.503 for the old-growth gap; p < 0.05). The agreement between the days below REWc and those below TIc was better in the managed compared with old-growth sites (R = 0.749 for the managed gap, R = 0.509 for the managed forest, R = 0.480 for the old-growth gap and R = 0.461 for the old-growth forest; p < 0.05).
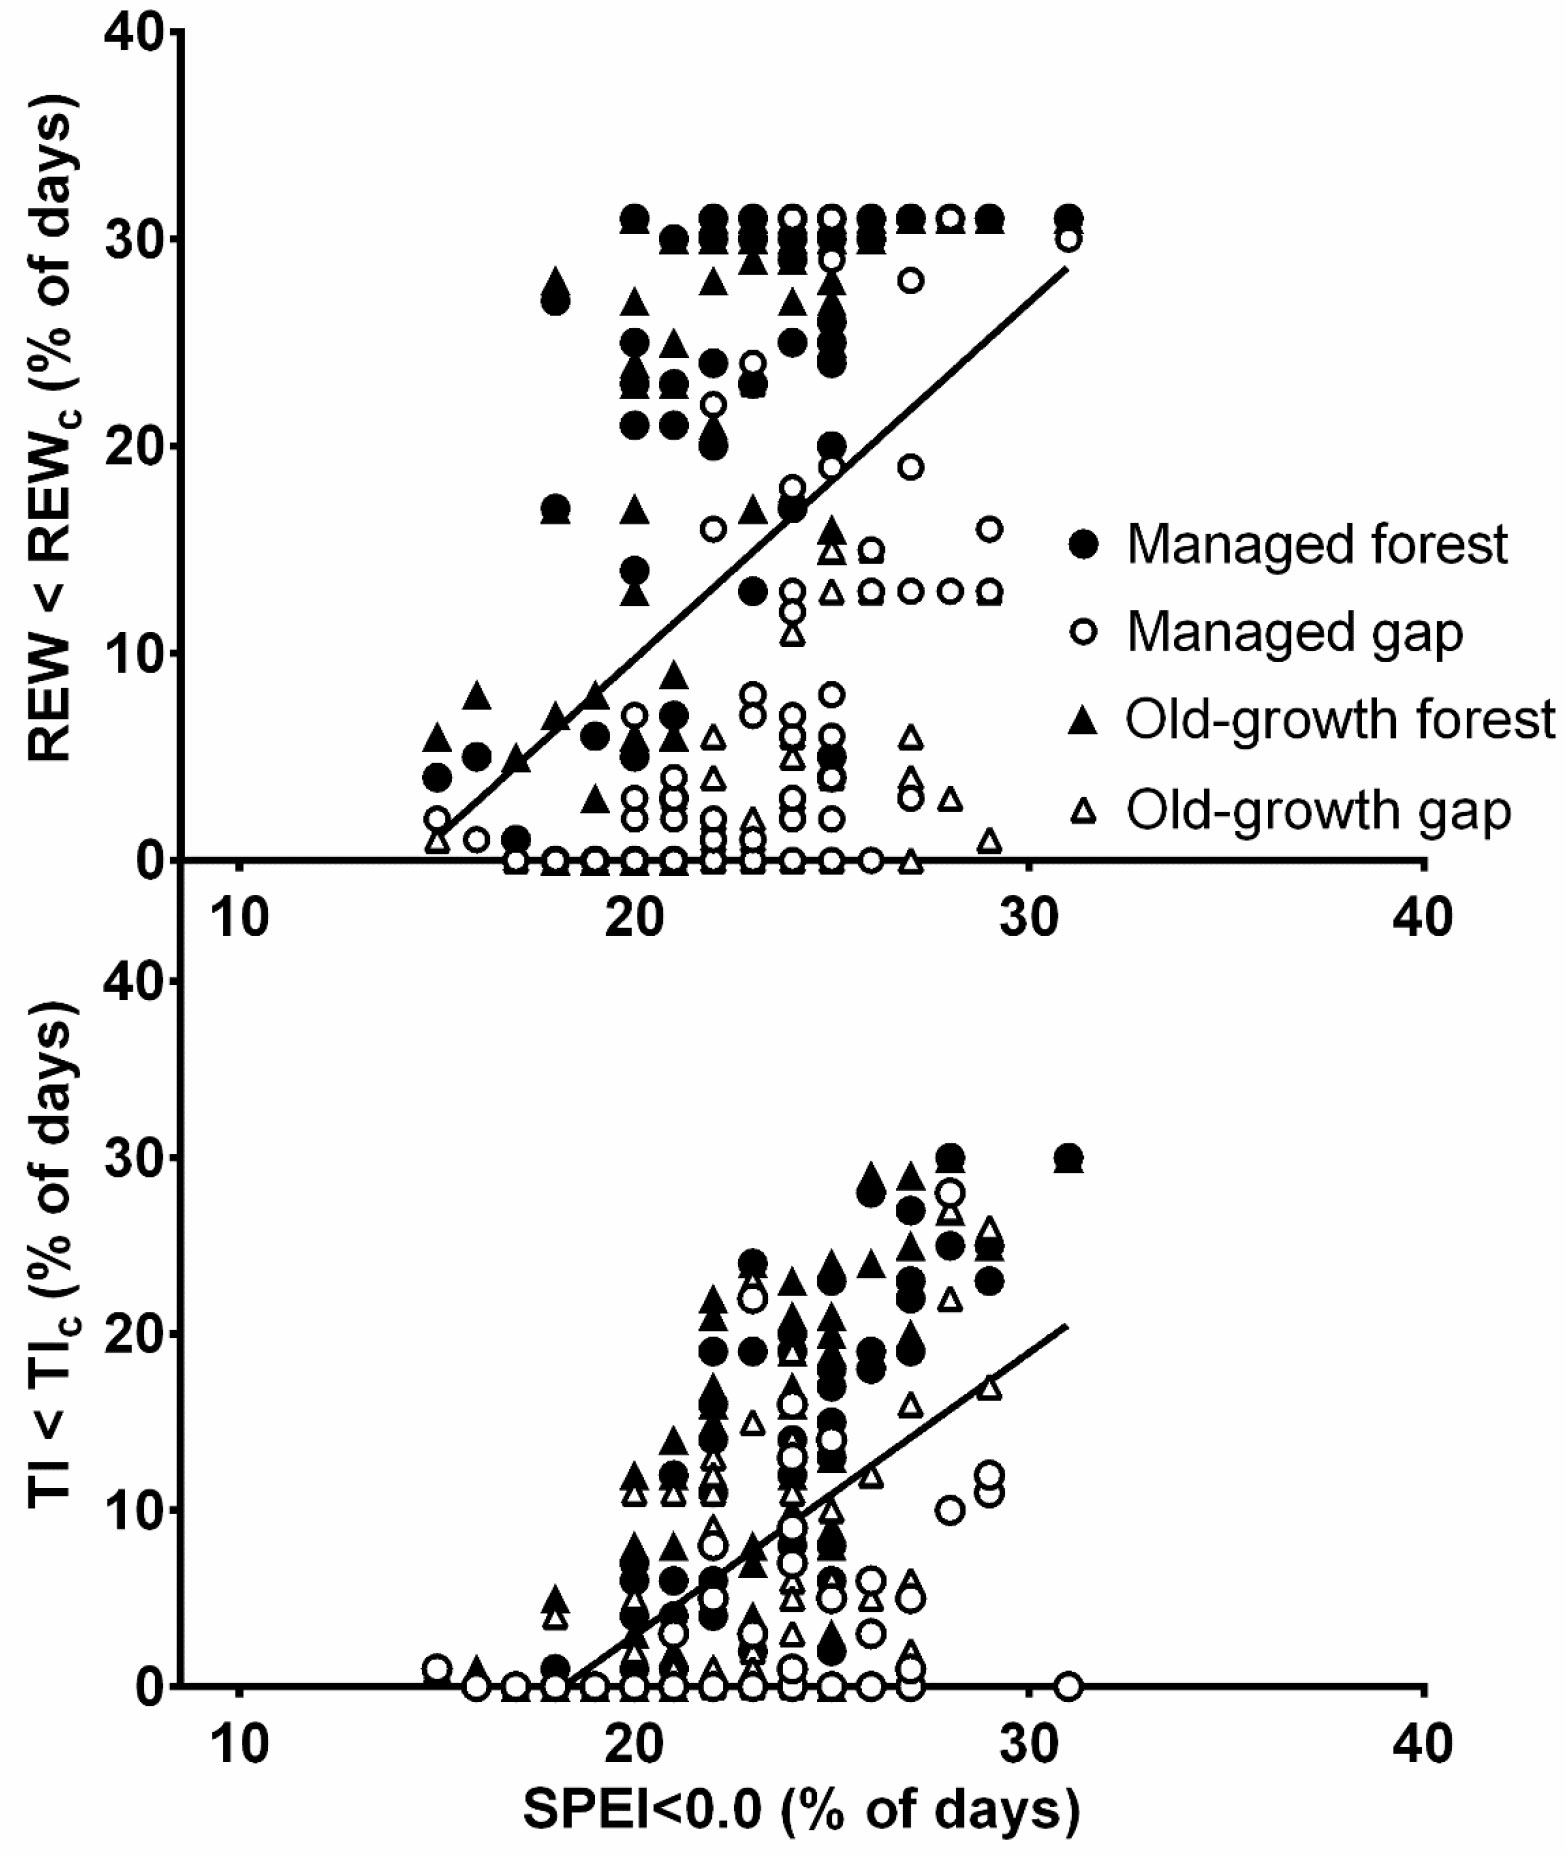
A comparison of the monthly SPEI at all sites with the REW and TI showed statistically significant differences (H = 85.0, df = 2, N = 978, p < 0.001). However, the agreement between SPEI and TI was slightly higher (R = 0.461) than between the SPEI and REW (R = 0.402, p < 0.001). Additionally, the difference between the SPEI < 0.0 and the number of days with REW < REWc or TI < TIc was statistically significant (H = 270.8, df = 2, N = 978, p < 0.001). The agreement was higher between the number of days with SPEI < 0.0 and days with TI < TIc (R = 0.513) than between the number of days with SPEI < 0.0 and the days with REW < REWc (R = 0.416, p < 0.001 - Fig. 4). Regarding the sites, the highest agreement between SPEI and REW was found in the managed forest (R = 0.582) and gap (R = 0.546), followed by the old-growth forest (R = 0.491) and gap (R = 0.483, p < 0.001). However, the agreement between the number of days with SPEI < 0.0 and days with REW < REWc was highest in the old-growth forest (R = 0.607), followed by the managed forest (R = 0.580), managed gap (R = 0.578) and old-growth gap (R = 0.505, p < 0.001). The highest agreement between SPEI and TI was found in the old-growth forest (R = 0.675) followed by the managed forest (R = 0.631, p < 0.001), whereas the agreement was not significant for the gaps. The agreement between the number of days with SPEI < 0.0 and the days with TI < TIc was highest in the managed (R = 0.715) and old-growth forests (R = 0.700), followed by the old-growth (R = 0.479) and managed gap (R = 0.424, p < 0.001).
Fig. 4 - Comparison of monthly percentage of days with a Standardized Precipitation Evapotranspiration Index below 0.0 (SPEI < 0.0, %) at the Kočevje meteorological station and a) the number of days with the relative extractable water content below 0.4 (REW < REWc, %) and b) the number of days with the transpiration index below 0.7 (TI < TIc, %) in the managed and old-growth forests and gaps from 2001 to 2013 growing seasons (i.e., May - October), with the exception of the natural gap from 2003 to 2013. The line is the regression line for all sites (n = 300).
Discussion
Both drought stress indices showed the greatest drought stress in the years 2009, 2003 and 2011, as also indicated by the SPEI at the nearest meteorological station. However, drought stress intensity and duration differed between indices and study sites. Both TI and REW showed greater drought stress in forests than gaps in managed as well as old-growth forests. Higher Spearman rank coefficients indicated a better agreement between daily REW and TI for the forests than for the gaps, implying that indices should be carefully selected when comparing water supply stress between different stages of forest stand development.
According to REW, the greatest and longest drought stress in all sites occurred in 2009, followed by the 2001 growing season. TI indicated the greatest and longest drought stress in 2011, followed by the 2003 and 2009 growing seasons. TI was more strongly correlated with the SPEI than REW but only for the forests. The SPEI and TI were not significantly correlated for the gaps.
Both indices (TI and REW) showed a greater water supply stress for the forests than for the gaps, which is in accordance with previous studies ([56], [54]). Due to lower interception and lower transpiration ([12], [62]), plants in the gaps benefit from higher precipitation input and increased soil water storage compared with the surrounding forest ([27], [42], [13]). However, REW indicated larger differences in drought stress duration between forests and their corresponding gaps (55-70%); similar differences were found via TI (23-25%). The REW calculation is based on the daily, minimum and maximum SWC for the measurement period, which can be derived from modeled data or from continuous SWC profile measurements ([44]). Such measurements are currently cost-effective ([20]) and can be numerously installed in larger forest areas. However, a sensitivity analysis revealed that REW is sensitive to both minimum and maximum SWC for the measurement period. Furthermore, REW satisfactorily indicated drought stress in forests but to lesser extent in gaps. Due to the low amount of required input data as well as parameters that can be measured in the field with relative ease, REW may be an efficient tool for field water supply diagnosis ([4]) when analyzing the drought stress of similar forest types and at unique stages of development.
TI demonstrated more consistent differences between forests and gaps in regard to drought stress in different stages of forest stand development. TI is a more complex drought stress indicator than REW. Measurements of actual and potential transpiration rates in trees are costly and time consuming ([23], [8]). Potential transpiration rates in forest trees are also difficult to measure; however, some studies have reported on the transpiration rates of trees under non-limiting soil water conditions ([10], [9], [11], [21]). Transpiration rates of forests are therefore often simulated using complex water balance models ([21], [52], [34]) with greater input data requirements ([28]). The actual and potential transpiration in the BROOK90 model can be controlled using a number of parameters related to the tree stand, including tree height, leaf water potential, soil matrix potential, inner plant resistance, and others. However, the better performance of TI is associated with a substantial increase in the need for input data and parameters compared with REW. Daily meteorological data as well as parameters describing the site, the canopy, the soil and the water flow through the soil are required. Many of these parameters are rarely measured in the field and are often obtained from the literature. Thus, TI may provide more accurate estimates of drought stress in different forest types and stages of forest stand development; however, due to the greater number of required input data and parameters, TI also appears to be a less efficient tool for field water supply diagnosis in forests.
Further research on site-specific REW and TI thresholds is needed, as well as the integration of drought stress indicators with forest reactions, e.g., crown defoliation ([61]) or increment losses ([35], [48]) for beech forests in Slovenia.
Conclusions
Both the relative extractable soil water (REW) and the transpiration index (TI) indicated the greatest drought stress in the years 2009, 2003 and 2011, as also shown by the SPEI at the nearest meteorological station.
Both indices (TI and REW) showed greater water supply stress for the forests than for the gaps in managed as well as old-growth forests. However, REW indicated larger differences in drought stress duration between forests and their corresponding gaps (55-70%), whereas for TI differences between forests and corresponding gaps were smaller (23-25%).
REW may be an efficient tool for field water supply diagnosis when analyzing the drought stress of similar forest types and at unique stages of development due to the low amount of required input data.
TI proved to be an appropriate index for the detailed analysis of drought stress variation in different forest types and stages of forest stand development. However, due to more complex measurements or the mathematical modeling of transpiration rates in forest ecosystems, TI also appears to be a more complex tool for field water supply diagnosis in forests compared to REW.
Acknowledgements
The study was part of the European 5FW project NAT-MAN (QLRT1-CT99-1349); the ManFor C.BD project “Managing forests for multiple purposes: carbon, biodiversity and socio-economic wellbeing” (LIFE09 ENV/IT/000078); EUFORINNO “European Forest Research and Innovation” (Reg. Pot No. 315982); several projects within the Programme group “Forest biology, ecology and technology”; and the Programme group Forest biology, ecology and technology (0404-501), which is financed by the Ministry of Education, Science and Sport, Republic of Slovenia.
References
Gscholar
Gscholar
CrossRef | Gscholar
Gscholar
Gscholar
Gscholar
Gscholar
Gscholar
CrossRef | Gscholar
Gscholar
Gscholar
Gscholar
Gscholar
Authors’ Info
Authors’ Affiliation
Slovenian Forestry Institute, Večna pot 2, 1000 Ljubljana (Slovenia)
Corresponding author
Paper Info
Citation
Vilhar U (2016). Comparison of drought stress indices in beech forests: a modelling study. iForest 9: 635-642. - doi: 10.3832/ifor1630-008
Academic Editor
Tamir Klein
Paper history
Received: Mar 03, 2015
Accepted: Dec 12, 2015
First online: May 06, 2016
Publication Date: Aug 09, 2016
Publication Time: 4.87 months
Copyright Information
© SISEF - The Italian Society of Silviculture and Forest Ecology 2016
Open Access
This article is distributed under the terms of the Creative Commons Attribution-Non Commercial 4.0 International (https://creativecommons.org/licenses/by-nc/4.0/), which permits unrestricted use, distribution, and reproduction in any medium, provided you give appropriate credit to the original author(s) and the source, provide a link to the Creative Commons license, and indicate if changes were made.

Web Metrics
Breakdown by View Type
Article Usage
Total Article Views: 53612
(from publication date up to now)
Breakdown by View Type
HTML Page Views: 42916
Abstract Page Views: 4140
PDF Downloads: 4882
Citation/Reference Downloads: 52
XML Downloads: 1622
Web Metrics
Days since publication: 3733
Overall contacts: 53612
Avg. contacts per week: 100.53
Article Citations
Article citations are based on data periodically collected from the Clarivate Web of Science web site
(last update: Mar 2025)
Total number of cites (since 2016): 19
Average cites per year: 1.90
Publication Metrics
by Dimensions ©
Articles citing this article
List of the papers citing this article based on CrossRef Cited-by.
Related Contents
iForest Similar Articles
Research Articles
Daily prediction modeling of forest fire ignition using meteorological drought indices in the Mexican highlands
vol. 14, pp. 437-446 (online: 28 September 2021)
Research Articles
Impact of climate change on tree-ring growth of Scots pine, common beech and pedunculate oak in northeastern Germany
vol. 9, pp. 1-11 (online: 13 October 2015)
Research Articles
Developing stand transpiration model relating canopy conductance to stand sapwood area in a Korean pine plantation
vol. 14, pp. 186-194 (online: 14 April 2021)
Research Articles
Coupling daily transpiration modelling with forest management in a semiarid pine plantation
vol. 9, pp. 38-48 (online: 06 August 2015)
Research Articles
Suitability of Fagus orientalis Lipsky at marginal Fagus sylvatica L. forest sites in Southern Germany
vol. 15, pp. 417-423 (online: 19 October 2022)
Research Articles
The impact of land use on future water balance - A simple approach for analysing climate change effects
vol. 14, pp. 175-185 (online: 13 April 2021)
Research Articles
Growing season water balance of an inner alpine Scots pine (Pinus sylvestris L.) forest
vol. 11, pp. 469-475 (online: 02 July 2018)
Research Articles
Measured and simulated tree and stand water use of Douglas-fir along a climatic gradient across Germany
vol. 18, pp. 309-318 (online: 30 October 2025)
Research Articles
An index of structural complexity for Apennine beech forests
vol. 8, pp. 314-323 (online: 03 September 2014)
Research Articles
Remote sensing of Japanese beech forest decline using an improved Temperature Vegetation Dryness Index (iTVDI)
vol. 4, pp. 195-199 (online: 03 November 2011)
iForest Database Search
Google Scholar Search
Citing Articles
Search By Author
Search By Keywords


