Patterns of genetic variation in bud flushing of Abies alba populations
iForest - Biogeosciences and Forestry, Volume 11, Issue 2, Pages 284-290 (2018)
doi: https://doi.org/10.3832/ifor2314-011
Published: Apr 13, 2018 - Copyright © 2018 SISEF
Research Articles
Abstract
In the spring of 2007, 51 full-sib and six half-sib families of European silver fir were obtained through controlled and open pollinations from the same clones in a seed orchard. Genetic variation and parameters for bud flushing were determined in two progeny tests established in a nursery. The results indicate a high genetic control of bud flushing of European silver fir. Both the additive and the dominance genetic variances were major sources of genetic variation. The additive genetic variance was greater for open-pollinated than for full-sib progeny, representing 50-95% of phenotypic variance. Narrow-sense individual heritability estimates for control-pollinated progenies ranged from 0.14 to 0.64, while the full-sib family heritability ranged from 0.09 to 0.40. In the open-pollinated progenies, the values of individual and family heritability were higher than those in control-pollinated progeny and ranged from 0.50 to 0.95 for both. In both experiments, genetic parameters were higher for bud flushing at the beginning of the growing period than at later stages. The genetic correlations between bud phenology and growth traits were positive and significant in control-pollinated progeny but not significant in open-pollinated progeny. Positive significant correlations between control-pollinated and open-pollinated progeny showed a maternal effect. Bud flushing was negatively correlated with geographic and climatic parameters of the site of parents’ origin, accounting for 83-97% of the total variation of this adaptive trait.
Keywords
Bud Flushing, Climatic Parameters, Correlations, Genetic Parameters, Genetic Variation, Silver Fir
Introduction
European silver fir (Abies alba Mill.) is one of the most important forest tree species in Europe, for both economic and ecological purposes. However, breeding programmes of European silver fir in many countries are less frequent compared with other species. In general, there are few provenance trials with a high number of provenances established in Europe and even less progeny trials. The reason why silver fir has not been considered a high priority species in breeding programmes is its capacity to regenerate naturally.
In Romania, the tree breeding programme started in the 1960s, and the European silver fir was one of the prioritised species. Breeding activities have focused on improving growth, wood quality and resistance to biotic and abiotic factors. Among abiotic factors, late spring frosts often cause injuries to young shoots of European silver fir, especially when the forest reproductive material is poorly adapted to local climate at the planting site. Frost injuries produce stem forking in coniferous species by killing the terminal shoot, which leads to an improper stem formation. The late frost injuries depend on the time of bud flushing and are related to the occurrence of severe frosts in late spring.
Genecology studies have shown that variation in the time of bud flush is a complex interaction among genetic characteristics of local sources and environmental conditions of the growing site ([8]). Genetic variation and inheritance of bud flushing timing have been studied for many tree species, such as Douglas fir ([3], [37]), white spruce ([30]), European beech ([7], [19], [42]), Norway spruce ([14]), European larch ([18], [43]), paper birch ([8]) and Pinus species ([39]). Bud flushing has been shown to be under strong genetic control, and late bud flushing to be highly correlated with reduced spring frost injury ([1], [22], [29]).
In the case of European silver fir, high genetic variability in growth, phenology and morphological traits has been reported among provenances ([23], [26], [31], [41]). Progeny tests have revealed high amounts of genetic variation at the family level for growth and quality traits, and a significant potential for selection and breeding ([4], [17], [32]). To assess the genetic potential for selection within and among families, the level of genetic control of economic and adaptive traits must be determined ([30]). Although the association between bud flush dates and spring injury has been reported for some Abies species ([13], [24]), there has been no study to assess the genetic control of bud flushing in European silver fir.
The phenology of bud flushing in forest species is fundamental for their survival and growth. Variation in the timing of bud flushing has implications in the susceptibility of genotypes to frost damage and may determine a variation of annual height growth ([30], [35]). Moreover, information on the genetic variation and inheritance of adaptive traits is extremely important in species breeding programme, both for the delineation of provenance regions and the production of high-quality timber. In this regard, bud flushing phenology is critical for decision-making on reforestation, particularly for the transfer of forest reproductive material, in order to maximise adaptability and wood production.
To address these problems, the objectives of this study were to: (i) investigate the genetic variation of bud flushing in two progeny tests of European silver fir created through controlled and open pollination at the nursery stage; (ii) determine and compare the genetic parameters of control- and open-pollinated tests; (iii) assess correlations between bud flushing and growth traits; (iv) assess the relationships among variation in bud flushing and the geographic and climatic parameters of the site of parents’ origin; and (v) evaluate the potential for selection and implications for breeding programmes.
Materials and methods
Genetic material and mating design
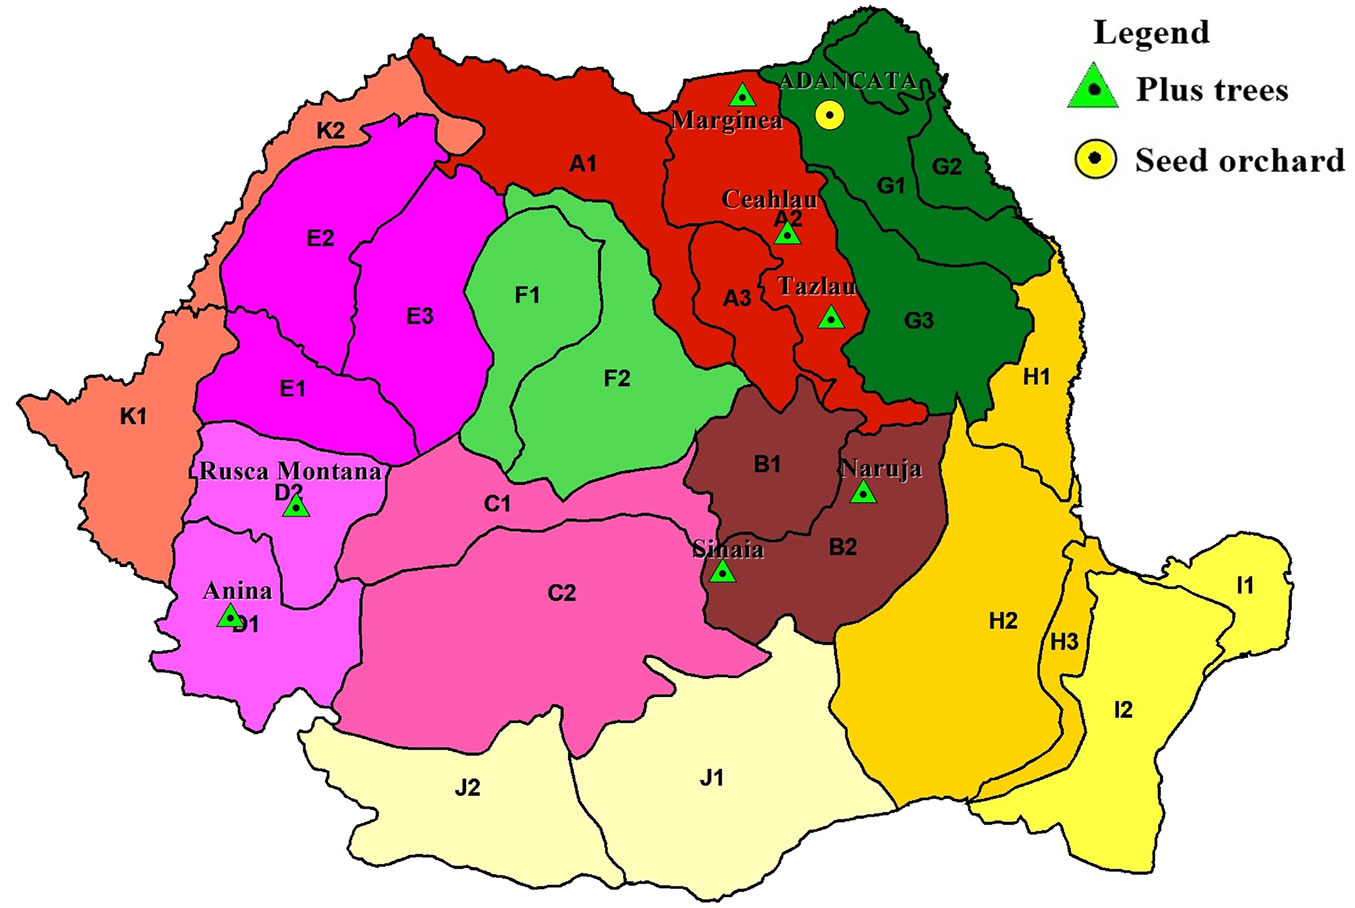
The study orchard of European silver fir is situated in the Adancata Forest District in the oak zone (latitude 47° 42′ N, longitude 26° 22′ E, elevation of 370 m a.s.l.) in northern Romania. The orchard is very well isolated and is composed of vegetative copies of 46 plus trees selected from four provenance regions ([34]). To maintain high genetic diversity in future generations, clones involved in both full-sib and open-pollinated families originate from all four provenance regions of plus trees (Fig. 1).
Fig. 1 - Location of the European silver fir seed orchard and tested populations (map of provenance regions taken from [34]).
In the spring of 2007, 11 clones of European silver fir from the seed orchard were mated in a half-diallel design, resulting in 51 full-sib families out of 55 possible crosses. Open-pollinated seed from six of the 11 clones used in controlled crosses also were collected from the seed orchard.
The flowers were isolated in paper bags on 20-21 April 2007, shortly after the occurrence but prior to pollen dissemination. Pollination was performed with fresh pollen on 27-28 April 2007.
Nursery design and assessment of bud flushing
Both full-sib and open-pollinated seeds were sown in nursery beds for germination in autumn 2007. At the age of two years, the seedlings were planted in polyethylene bags filled with humus in a randomised complete block design with three replications in a single experiment in the Sinaia nursery, which is situated in the mountain beech zone of Romania (latitude 45° 29′ N, longitude 25° 59′ E, elevation 695 m a.s.l. - Fig. 1).
The assessment of bud flushing was made in two consecutive growing seasons (2012 and 2013) by examining 14 seedlings per plot per family in each of three replications, both for full-sib and open-pollinated families. The bud flush survey involved recording only the terminal bud, as the lateral buds could be at a different stage, using a 5-point scale starting from 1 = unbroken bud to 5 = needles completely open and fully elongated ([10]). This has simplified interpretation of the data by ranking the family means to a scale of 1 = early to 5 = late. The observations were made in a single day with a periodicity of five days in 2012 and only once in 2013. Thus, in 2012 four evaluations were performed, starting at 30 April until 15 May, and in 2013 the assessment was made on 8 May. Accordingly, with the two sets of progeny generated by controlled crosses (CC) and by open pollination (OP), the following notations were used to refer to the different bud flushing evaluations:
- CC-I-2012, CC-II-2012, CC-III-2012, CC-IV-2012: bud flushing score in the full-sib progeny of the first, second, third and fourth evaluations in the year 2012, respectively;
- CC-2013: bud flushing score in the full-sib progeny of the evaluation in the year 2013;
- OP-I-2012, OP-II-2012, OP-III-2012, OP-IV-2012: bud flushing score in the open-pollinated progeny of the first, second, third and fourth evaluations in the year 2012, respectively;
- OP-2013: bud flushing score in the open-pollinated progeny of the evaluation in the year 2013.
In addition to bud flushing, growth characteristics were also measured. Results concerning the genetic variation and inheritance of growth characters at the nursery stage are reported in Mihai et al. ([32]). To assess the relationship between bud flushing and growth traits, we have included in this study only the following traits: total height (in cm) at the ages of 5 and 6 (H-2012, H-2013); current height increment (in cm) at ages 5 and 6 (h-2012, h-2013); and root collar diameter (in cm) at the ages of 5 and 6 (D-2012, D-2013).
For progeny tests, temperature and precipitation data were recorded using a logger installed at the nursery. Also, the climatic parameters at the site of the parents’ origin were determined. We used six bioclimatic variables (based on temperature and precipitation data) calculated for the period of 1968-1977 from the ROCADA gridded daily climatic dataset ([11]), a state-of-the-art homogenised climatic dataset throughout Romania with a spatial resolution of 0.1 × 0.1°, covering the period of 1961-2013, for nine meteorological variables.
Statistical analysis
Individual tree data for CC and OP progenies were analysed separately using appropriate mathematical models for the each type of mating design.
The full-sib progeny
A half-diallel mating design was used (method 4 - [21]), taking into account only direct crossings; reciprocal crosses and self-pollination were excluded. All effects were considered random for the estimation of variance components (model II, random - [20]), since the tested trees were random samples from the parent populations. Three parents had 1-2 missing crosses, for a total of four missing crossings in the entire experiment. However, according to Wu & Matheson ([44]), missing a few crosses in a complete half-diallel design does not significantly alter the hypothesis testing for the effects of replication, general combining ability (GCA) effect or specific combining ability (SCA) effect, and it does not significantly affect the relative GCA ranking of parents.
The statistical analysis used individual seedling measurements and followed the mathematical model (eqn. 1):
where Xijk is the individual seedling observation, μ is the overall mean, rk is the effect of the kth repetition, gi is the GCA of the ith parent, gj is the GCA of the jth parent, sij is the SCA of the ith and jth parents, so that sij = sji and eijk is the random error associated with the ijkth seedling.
The model of variance analysis and expected mean squares are listed in Tab. S1 (Supplementary material). The analyses were based on plot means using the least-squares method proposed by Schaffer & Usanis ([36]). Because data on individual seedlings were available, a separate analysis was performed to estimate the within-plot variance (σ2w).
It was assumed that epistatic components of genetic variance were negligible in the population examined. Therefore, GCA variance (σ2GCA) was used as an estimator of the additive genetic variance and SCA variance (σ2SCA) as an estimator of the dominance genetic variance, as in the following equations (eqn. 2, eqn. 3, eqn. 4, eqn. 5):
where σ2P is the phenotypic variance, σ2G is the genotypic variance, σ2A is the additive genetic variance and σ2D is the dominance genetic variance. Standard errors (SE) of variance components were estimated according to Becker ([5]).
Based on genetic variances, the narrow-sense individual (h2i) and full-sib family heritability (h2FS) were calculated as follows ([45] - eqn. 6, eqn. 7):
GCA effects were estimated following the methods reported by Griffing ([21]). Differences between GCA effects were tested using a Student’s t-test.
Genetic correlations were calculated from the GCA covariance component of two characters in the numerator and the square root of the product of their GCA variance components in the denominator ([45]).
The half-sib progeny
The statistical analysis was based on individual tree measurements using the following mathematical model ([33] - eqn. 8):
where Yijk is the performance of the kth seedling in the jth family in the ith repetition, μ is the overall mean, Bi is the effect of the ith repetition, Fj is the effect of the jth family, FBji is the interaction of the jth family and ith repetition, and eijk is the random error associated with the ijkth seedling.
The analyses of variance components were performed using the SPSS® software program ver. 19 (Univariate GLM & VARCOMP). The assumptions of the model were checked by the Shapiro & Wilk test for normality and by the Levene’s test for homogeneity. The family effects were assumed to be random and were associated with the average genetic effects of the OP families. We considered OP families as true half-sib families and, consequently (eqn. 9):
where σ2A is the additive genetic variance and σ2F is the family variance. The narrow-sense individual (h2i) and half-sib family heritabilities (h2HS) were calculated by the following formulas ([33] - eqn. 10, eqn. 11):
where σ2Ph1 and σ2Ph2 are the phenotypic variances; σ2A is the additive genetic variance; σ2F is the family variance; σ2FB is the family × repetition interaction variance; σ2e = σ2p + σ2w / n; σ2p is the variance among plots; σ2w is the within-plot variance; n is the number of seedlings per plot; and r is number of repetitions.
Standard errors for heritability were estimated according to Dickerson ([9]) by assuming that the denominator is a constant. Genetic correlations were calculated from the additive genetic covariance of two traits, X and Y, in the numerator and the square root of the product of their additive genetic variances in the denominator ([15]). Pearson’s correlations based on family means were also calculated to examine relationships between traits, generated by CCs and OP, and whether the observed differences in flushing reactions are correlated to the geographic coordinates and the climatic conditions of the parents’ origin (LAT: latitude; LONG: longitude; ALT: elevation, in m a.s.l.; TMA: mean annual temperature; PMA: mean annual precipitation calculated for the period of 1968-1977).
Results
Genetic variation and variance components
Mean squares estimates for bud flushing evaluations derived from each of the mating designs are presented in Tab. 1. The diallel analysis highlighted very significant (p < 0.001) differences among parents regarding GCA in both the 2012 and 2013 growing seasons. Also, there were highly significant (p < 0.001) differences among families with respect to SCA for all evaluations of bud flushing. Therefore, both GCA and SCA effects were very important sources of variation for this trait.
Tab. 1 - Analysis of variance for bud flushing in the nursery tests. (I-2012): the first evaluation in the year 2012; (II-2012): the second evaluation in the year 2012; etc. (*): p < 0.05; (***): p < 0.001.
| Progeny | Source of variation |
df | Evaluations / Mean squares | ||||
|---|---|---|---|---|---|---|---|
| I-2012 | II-2012 | III-2012 | IV-2012 | I-2013 | |||
| Full-sib | GCA | 10 | 1.087*** | 4.054*** | 3.520 | 6.047 | 5.454* |
| SCA | 44 | 0.282*** | 1.034*** | 2.487*** | 3.784*** | 2.498*** | |
| Error | 100 | 0.021 | 0.049 | 0.175 | 0.087 | 0.115 | |
| Within-plot error | 3663 | 0.129 | 0.416 | 0.603 | 0.523 | 1.542 | |
| Open-pollinated | Replication | 2 | 0.205 | 0.019 | 0.137 | 0.015 | 0.017 |
| Family | 5 | 0.004 | 2.546*** | 6.310*** | 3.791*** | 9.393*** | |
| Family × replication | 10 | 0.219 | 0.126 | 0.400 | 0.072 | 0.244 | |
| Error | 254 | 0.004 | 0.094 | 0.448 | 0.457 | 1.428 | |
For OP progenies, the analysis of variance also revealed highly significant (p < 0.001) differences among half-sib families for bud flushing in the two years of observations.
In 2012, the first assessment of bud flushing was performed on 30 April, when average percentages of bud flushing were 10% in CC progeny and 3% in OP progeny, and continued every five days until 15 May. In 2013, the bud flushing evaluation was made on 8 May, and bud flushing percentages were 88% in CC progeny and 81% in OP progeny. On average, the OP flushing index was smaller than the CC index. These differences could be assigned to paternal heredity, which is unknown in OP progeny.
In CC experiments, the earliest clones were 5 and 544, whose percentages of flushing at the first evaluation were 40-50%. They started bud flushing after seven consecutive days with temperatures higher than 10 °C. The differences in days among the earliest clones and the latest clone (376, 421 and 134) were 5 days. In OP experiments, the earliest clones were also 5, 371 and 145 and the latest 134 and 138.
Variance component estimates, their standard errors, dominance-to-additive ratios for CC and OP progenies are listed in Tab. S2 (Supplementary material). Thus, in CC experiments, the dominance variance (σ2SCA) exerted a greater influence on this trait, as evidenced by the σ2SCA/σ2GCA ratio for all evaluations. The σ2SCA/σ2GCA ratio ranged from 2.9 to 20.1, depending on the bud development stage. The additive genetic variance represented 6-25% of the phenotypic variance. The highest values of additive genetic variance were obtained during the first half of the assessment periods (CC-I-2012, CC-II-2012, CC-2013), when GCA also differed considerably between parents.
In the case of OP progenies, the additive genetic variance (σ2A) was greater than that of CC progenies, representing 50-95% of the phenotypic variance. The highest values were also obtained for the start of the growing period.
Genetic parameters
The values of the heritability coefficients based on the CC and OP progenies are listed in Tab. 2. Narrow-sense individual heritability estimates for CC progenies ranged from 0.139 to 0.638, while the full-sib family heritability ranged from 0.088 to 0.398. In the OP progenies, the values of individual and family heritabilities were higher than in the CC progeny and ranged from 0.495-0.950. In both experiments, heritabilities were higher for bud flushing at the beginning of the growing period (I-2012, II-2012) than at later stages.
Tab. 2 - Estimates of averages, phenotypic variances and heritabilities. (σ2Ph1, σ2Ph2): phenotypic variances; (h2i): narrow-sense individual heritability; (h2FS): full-sib family heritability; (h2HS): half-sib family heritability.
| Progeny | Genetic parameters |
Evaluations | ||||
|---|---|---|---|---|---|---|
| I-2012 | II-2012 | III-2012 | IV-2012 | I-2013 | ||
| Full-sib | Mean | 1.10 | 1.75 | 3.14 | 4.06 | 3.21 |
| σ 2 Ph1 | 0.585 | 2.104 | 3.294 | 4.788 | 4.543 | |
| σ 2 Ph2 | 0.449 | 1.681 | 2.611 | 4.239 | 3.078 | |
| h 2 i | 0.612 ± 1.401 | 0.638 ± 1.013 | 0.139 ± 0.277 | 0.210 ± 0.201 | 0.289 ± 0.375 | |
| h 2 FS | 0.398 ± 0.456 | 0.399 ± 0.317 | 0.088 ± 0.087 | 0.119 ± 0.057 | 0.213 ± 0.138 | |
| Open-pollinated | Mean | 1.00 | 1.17 | 3.13 | 4.20 | 2.99 |
| σ 2 Ph1 | 0.024 | 0.247 | 0.592 | 0.573 | 1.730 | |
| σ 2 Ph2 | 0.010 | 0.061 | 0.152 | 0.109 | 0.280 | |
| h 2 i | 0.837 ± 1.634 | 0.934 ± 2.114 | 0.950 ± 1.740 | 0.618 ± 1.780 | 0.503 ± 1.039 | |
| h 2 HS | 0.495 ± 0.968 | 0.950 ± 2.151 | 0.923 ± 1.718 | 0.815 ± 2.348 | 0.778 ± 1.605 | |
GCA effects were calculated for each parent from the diallel design (Tab. 3). Both positive and negative significant effects (p < 0.001) were found for this phenological trait. Therefore, the parents in this experiment could be separated into three categories: early flushing, late flushing and intermediary.
Tab. 3 - General combining ability (GCA) effects for 11 parents in silver fir half-diallel. (CC-I-2012): the bud flushing score in the full-sib progeny of the first evaluation in the year 2012; (CC-II-2012): the bud flushing score in the full-sib progeny of the second evaluation in the year 2012, etc. (*): p < 0.05; (**): p < 0.01; (***): p < 0.001.
| Clone | CC-I-2012 | CC-II-2012 | CC-III-2012 | CC-IV-2012 | CC-I-2013 |
|---|---|---|---|---|---|
| 5 | 0.382*** | 0.705*** | 0.466** | 0.447 | 0.517* |
| 544 | 0.249*** | 0.398* | 0.323 | 0.506 | 0.445 |
| 50 | 0.018 | 0.054 | -0.075 | -0.193 | 0.067 |
| 541 | -0.043 | 0.074 | 0.152 | -0.015 | 0.089 |
| 371 | 0.053 | 0.262 | 0.289 | 0.379 | 0.312 |
| 35 | 0.018 | -0.025 | 0.101 | 0.260 | 0.067 |
| 138 | -0.072 | -0.302 | 0.059 | 0.346 | 0.188 |
| 376 | -0.220*** | -0.385* | -0.557** | -0.665* | -0.664** |
| 145 | -0.057 | -0.099 | -0.033 | -0.193 | -0.268 |
| 421 | -0.198*** | -0.325 | -0.493 | -0.691* | -0.713** |
| 134 | -0.131** | -0.358 | -0.232 | -0.181 | -0.041 |
Genetic correlations between analysed traits in CC experiment are shown in Tab. 4. High additive genetic correlations were obtained between bud flushing stages evaluated in the spring of 2012 and 2013. The genetic correlations between bud flushing and growth traits were positive and very significant only for D-2012, D-2013 and H-2012. Significant correlations between current height increment in 2012 and 2013, and bud flushing was not found.
Tab. 4 - Trait-trait additive genetic correlations and phenotypic correlations with geographic coordinates of the parent for full-sib progeny. (H-2012, H-2013): total height at the ages of 5 and 6; (h-2012, h-2013): current height increment at ages of 5 and 6; (D-2012, D-2013): root collar diameter at the ages of 5 and 6; (LAT): latitude; (LONG): longitude; (ALT): elevation. (*): p < 0.05; (**): p < 0.01; (***): p < 0.001.
| Traits | CC-I-2013 | H-2012 | H-2013 | h-2012 | h-2013 | D-2012 | D-2013 | LAT | LONG | ALT |
|---|---|---|---|---|---|---|---|---|---|---|
| CC-I-2012 | 0.328* | -0.002 | -0.057 | -0.030 | -0.108 | 0.174 | 0.088 | -0.225 | 0.240 | -0.441 |
| CC-II-2012 | 0.309* | -0.052 | -0.083 | -0.035 | -0.112 | 0.097 | 0.055 | -0.327 | 0.078 | -0.558* |
| CC-III-2012 | 0.600*** | 0.335* | 0.184 | 0.176 | 0.051 | 0.665*** | 0.456*** | -0.078 | 0.252 | -0.348 |
| CC-IV-2012 | 0.522*** | 0.437*** | 0.252 | 0.190 | 0.091 | 0.739*** | 0.498*** | -0.012 | 0.236 | -0.256 |
| CC-I-2013 | - | 0.352** | 0.212 | 0.196 | 0.091 | 0.597*** | 0.388** | -0.066 | 0.281 | -0.339 |
In OP progenies, significant genetic correlations between bud flushing and growth traits were not found; for this reason, phenotypic correlations are presented in Tab. 5 instead. Negative phenotypic correlations between bud flushing and height, root collar diameter and current height increment were obtained. Significant correlations also were highlighted between bud flushing stages evaluated in OP progenies and CC progenies, indicating a maternal genetic control of this trait.
Tab. 5 - Phenotypic correlations among traits and geographic coordinates of the parent for half-sib progeny. (OP-I-2012): bud flushing score in the open-pollinated progeny of the first evaluation in the year 2012; (OP-II-2012): bud flushing score in the open-pollinated progeny of the second evaluation in the year 2012, etc.; (LAT): latitude; (LONG): longitude; (ALT): elevation. (*): p < 0.05; (**): p < 0.01; (***): p < 0.001.
| Traits | OP-I-2013 | CC-I-2012 | H-2012 | H-2013 | h-2012 | D-2012 | D-2013 | LAT | LONG | ALT |
|---|---|---|---|---|---|---|---|---|---|---|
| OP-I-2012 | 0.760* | 0.929*** | -0.394 | -0.131 | -0.138 | 0.156 | 0.144 | -0.605 | 0.178 | -0.581 |
| OP-II-2012 | 0.359 | 0.168 | -0.104 | -0.458 | -0.049 | 0.328 | 0.650 | -0.322 | -0.976*** | -0.109 |
| OP-III-2012 | 0.678* | 0.343 | -0.635 | -0.622 | -0.723* | -0.775* | -0.484 | 0.531 | 0.122 | 0.536 |
| OP-IV-2012 | 0.563 | 0.106 | -0.803* | -0.751* | -0.834** | -0.910** | -0.576 | 0.388 | 0.367 | 0.347 |
| OP-I-2013 | - | 0.852** | - | 0.412 | - | - | 0.548 | -0.805* | -0.396 | -0.702* |
In both OP and CC progenies, bud flushing was negatively correlated with altitude (r ranged from -0.702 to -0.109) of the location of origin of the plus trees. Correlations with longitude and latitude were also negative and were found for the OP family only. Correlations with altitude and latitude were low but significant (p < 0.05), which indicates that trees from lower altitudes and southern latitudes open their buds earlier than trees from northern latitudes and higher altitudes. The correlation with longitude of the origin of plus trees was stronger (r = -0.98).
Bud flushing variation at the family level was related to geographic and climatic parameters of the parents’ origin (LAT, LONG, ALT, TMA, PMA) by multiple regression analysis. For CC-II-2012 and OP-II-2012, the models were significant, accounting for 83% and 97%, respectively, of the total variation of these traits (Tab. S3 in Supplementary material).
Discussion
Bud burst and bud set are important adaptive traits, because they determine the co-adaptation of the vegetation period of trees to the periodic variation of the climatic components of the environment where trees live ([16]). In this study, because the dates for bud set were not monitored, the average season length could not be determined.
European silver fir has a high degree of variation within populations ([27], [40]). The large non-additive variance for bud flushing, as well as for growth traits, is in agreement with the genetic system of European silver fir. From a practical standpoint, these results indicate that bud flushing of European silver fir is under genetic control and provides information on family, within-family and parental selection. In a breeding programme, individuals that start later in terms of vegetation are of interest, because they are not harmed by late spring frosts. Our results are in agreement with data published by Hansen & Larsen ([23]), who found significant variation among European silver fir provenances concerning the bud-burst and a positive correlation between the resistance to winter frost and the later bud burst.
Individual and family heritability estimates in CC progenies differ comparatively with those obtained in OP progenies. For the first two evaluations, which refer to the beginning of the growing season, the differences between CC and OP estimates varied from 36 to 46% for individual heritability and from 24 to 38% for family heritability. OP estimates of additive genetic variance and heritability were greater than estimates of these parameters in CC progenies. Although the parameters do not differ significantly from each other at the 0.05 level, we should interpret OP estimates with caution. The differences between genetic parameters obtained in CC and OP progenies could be explained by violation of the true half-sib assumption (an intraclass correlation coefficient of 0.25) or by different male parents involved in the two experiments. The high heritabilities we observed for bud flush dates agree with the results found in other species ([1], [22]).
The correlations among bud flushing determined in CC progeny and in OP progeny were positive and significant, which proves a maternal effect of heredity of this trait. In order to establish both species breeding strategies and the rules for transfer of forest reproductive material, the correlations between bud flushing and growth traits should be known. To safeguard trees against late spring frost and early fall frost, superior growth potential should be independent of shoot phenology and duration of the growing season ([35]). Overall, we found significant correlations between phenology and growth in both experiments but in different directions. In CC progeny, the genetic correlations between bud phenology and growth performance were positive and significant only for root collar diameter (D-2012, D-2013) and H-2012. This means the seedlings that flushed earlier had a higher growth rate. Non-existent correlations with annual height increment could be explained by the fact that they were assessed only on the date of bud flushing initiation and not throughout the growing season. However, this does not preclude the dependence of the annual height increment on the length of the growing season.
In OP progeny, significant genetic correlations between bud phenology and growth performances were not obtained, but phenotypic correlations were negative for growth traits assessed in the 2012 growing season and with H-2013. Studies of other species, such as white spruce, indicated that growth potential was negatively related to shoot phenology ([30]). In Norway spruce, Sonesson & Eriksson ([38]) observed a low correlation between the time of bud flushing and the height increment in the second growing season. Further, different stages of bud flushing in Norway spruce were slightly negatively correlated genetically with 9-14 year-old field heights ([22]). Genetic correlations between phenological traits and growth traits in Pinus brutia ([25]) were negative in most cases and not very strong, indicating that those seedlings with high growth performance are not necessarily the ones with a longer growing season. The diameter of Douglas fir can be effectively increased by simultaneously selecting for later bud burst, because these traits are uncorrelated in studied populations ([37]).
The genetic material in both CC and OP experiments consists of progeny of plus trees originating from different latitudes, longitudes and altitudes, tested in a seed orchard. The correlations indicated some geographic clines for bud phenology of European silver fir. Indeed, in both CC and OP progenies, negative significant correlations with the altitude of the location of origin of plus trees were obtained. Significant correlations with latitude and longitude were found only in OP families. Further, trees originating from southern latitudes and western longitudes are characterised by an earlier onset of bud flushing. Latitude, longitude, altitude, TMA and PMA were found to be statistically significant explanatory variables for bud flushing.
Provenance studies also indicated a variable pattern of phenological traits of European silver fir with geographic coordinates of the place of origin ([41]). Such geographic variation of the European silver fir populations could be the result of local adaptation to different climatic conditions of the location of origin. The differences in terms of climate between the south-western (Mediterranean) and the north-eastern (semi-arid) regions of Romania ([6]) can significantly influence the adaptive traits of species. Long-term climatic changes throughout Romania are well documented in various recent papers. Climatic changes in Romania since 1961 show increasing temperatures in all seasons except autumn ([12]).
Relationships among variation of bud flushing and geographic coordinates also were observed in other species, such as Picea sitchensis ([16]), Picea glauca ([30]), Picea abies ([28]), Pinus sylvestris ([2]) and Fagus sylvatica ([7]). The patterns of variation varied with species, some exhibiting positive correlations, others showing negative correlations.
Our findings revealed a high genetic control of bud flushing of European silver fir, whereby a large genetic gain can be obtained in future breeding generations. Selections at the genitor as well as family levels will increase the genetic gain during the breeding programme.
Acknowledgements
This work was realised within the framework of the GENCLIM project (“Evaluating the adaptive genetic potential of the main coniferous species for sustainable forest management in the context of climate change”) financed by the Romanian Executive Agency for a Higher Education, Research, Development and Innovation Funding, grant number PN-II-PC-PCCA-2013-4-0695. The authors also thank the anonymous reviewers for their useful comments and advice.
References
Gscholar
Gscholar
Gscholar
Gscholar
Gscholar
Gscholar
Gscholar
Gscholar
Gscholar
Gscholar
Gscholar
Gscholar
Gscholar
Gscholar
Gscholar
Gscholar
Gscholar
Gscholar
Authors’ Info
Authors’ Affiliation
Ionel Mirancea
Marin Dracea National Institute for Research and Development in Forestry, Department of Forest Genetics and Tree Breeding. Bulevardul Eroilor nr. 128, Voluntari, Ilfov (Romania)
Alexandru Dumitrescu
Meteo Romania - National Meteorological Administration, Department of Climatology, Sos Bucuresti-Ploiesti 97, 013686 Bucharest (Romania)
Corresponding author
Paper Info
Citation
Mihai G, Mirancea I, Birsan M-V, Dumitrescu A (2018). Patterns of genetic variation in bud flushing of Abies alba populations. iForest 11: 284-290. - doi: 10.3832/ifor2314-011
Academic Editor
Mike Perks
Paper history
Received: Dec 14, 2016
Accepted: Jan 13, 2018
First online: Apr 13, 2018
Publication Date: Apr 30, 2018
Publication Time: 3.00 months
Copyright Information
© SISEF - The Italian Society of Silviculture and Forest Ecology 2018
Open Access
This article is distributed under the terms of the Creative Commons Attribution-Non Commercial 4.0 International (https://creativecommons.org/licenses/by-nc/4.0/), which permits unrestricted use, distribution, and reproduction in any medium, provided you give appropriate credit to the original author(s) and the source, provide a link to the Creative Commons license, and indicate if changes were made.

Web Metrics
Breakdown by View Type
Article Usage
Total Article Views: 48181
(from publication date up to now)
Breakdown by View Type
HTML Page Views: 40462
Abstract Page Views: 3303
PDF Downloads: 3340
Citation/Reference Downloads: 12
XML Downloads: 1064
Web Metrics
Days since publication: 2952
Overall contacts: 48181
Avg. contacts per week: 114.25
Article Citations
Article citations are based on data periodically collected from the Clarivate Web of Science web site
(last update: Mar 2025)
Total number of cites (since 2018): 12
Average cites per year: 1.50
Publication Metrics
by Dimensions ©
Articles citing this article
List of the papers citing this article based on CrossRef Cited-by.
Related Contents
iForest Similar Articles
Research Articles
Age trends in genetic parameters for growth and quality traits in Abies alba
vol. 9, pp. 954-959 (online: 07 July 2016)
Research Articles
Seedling emergence capacity and morphological traits are under strong genetic control in the resin tree Pinus oocarpa
vol. 17, pp. 245-251 (online: 16 August 2024)
Research Articles
Comparison of genetic parameters between optimal and marginal populations of oriental sweet gum on adaptive traits
vol. 11, pp. 510-516 (online: 18 July 2018)
Research Articles
Genetic variation and heritability estimates of Ulmus minor and Ulmus pumila hybrids for budburst, growth and tolerance to Ophiostoma novo-ulmi
vol. 8, pp. 422-430 (online: 15 December 2014)
Research Articles
Genetic diversity of core vs. peripheral Norway spruce native populations at a local scale in Slovenia
vol. 11, pp. 104-110 (online: 31 January 2018)
Research Articles
Genetic variation of Fraxinus excelsior half-sib families in response to ash dieback disease following simulated spring frost and summer drought treatments
vol. 9, pp. 12-22 (online: 08 September 2015)
Research Articles
Comparison of range-wide chloroplast microsatellite and needle trait variation patterns in Pinus mugo Turra (dwarf mountain pine)
vol. 10, pp. 250-258 (online: 11 February 2017)
Review Papers
Genetic diversity and forest reproductive material - from seed source selection to planting
vol. 9, pp. 801-812 (online: 13 June 2016)
Research Articles
Preliminary study on genetic variation of growth traits and wood properties and superior clones selection of Populus ussuriensis Kom.
vol. 12, pp. 459-466 (online: 29 September 2019)
Research Articles
Fine-scale spatial genetic structure in a multi-oak-species (Quercus spp.) forest
vol. 8, pp. 324-332 (online: 05 September 2014)
iForest Database Search
Search By Author
Search By Keyword
Google Scholar Search
Citing Articles
Search By Author
Search By Keywords
PubMed Search
Search By Author
Search By Keyword


