
The effect of clear-cut age on soil organic carbon and nitrogen indices in Scots pine (Pinus sylvestris L.) stands
iForest - Biogeosciences and Forestry, Volume 18, Issue 3, Pages 146-153 (2025)
doi: https://doi.org/10.3832/ifor4711-018
Published: Jun 09, 2025 - Copyright © 2025 SISEF
Research Articles
Abstract
Clear-cutting practices in hemiboreal forests significantly alter forest ecosystems, leading to substantial changes in soil carbon and nitrogen dynamics. This study investigated the impact of clear-cutting age on soil organic carbon (SOC) and total nitrogen (TN) focusing on soil microbial biomass carbon (SMBC), soil microbial biomass nitrogen (SMBN), and soil microbial respiration in the mineral topsoil 0-10 cm and 10-20 cm layers. The study sites included 1st-, 2nd-, and 3rd-year clear-cut sites, and adjacent mature Scots pine stand sites, adopting a paired-site design to compare clear-cuts of different ages and forest sites. Clear-cutting in Scots pine forests significantly impacted SOC and TN concentrations, initially leading to a decrease in SOC followed by an increase in TN levels. We found higher concentrations of nitrate (NO3-N), nitrite (NO2-N), and ammonium (NH4-N) in clear-cuts compared to mature forests, indicating enhanced nitrification and mineralization processes after clear-cut. The SOC and TN stocks were higher in the forest topsoil layers than in the clear-cut sites, except for the TN values in the 3rd-year clear-cuts. The SMBC concentrations were higher in forests than in clear-cuts, which showed the importance of forest ecosystems in supporting microbial activity and soil health. Variations in the SOC:TN and SMBC:SMBN ratios between forests and clear-cuts suggested alterations in soil nutrient dynamics and microbial community structure resulting from the clear-cutting of mature forests. We concluded that further research is needed to understand better the long-term impacts of clear-cutting on soil quality and the status of reforested ecosystems, while evaluating the interactions between soil chemical and biological properties as more effective indicators.
Keywords
Pinus sylvestris L., Clear-cutting, Soil Organic Carbon, Soil Nitrogen, Microbial Biomass
Introduction
Clear-cutting is a common forestry practice in hemiboreal forests, significantly altering several ecosystem components. It results in substantial physical, chemical, and microbiological changes in soil, disturbing the soil organic layer, impacting understory vegetation, and the processes crucial for forest regeneration ([7], [40]). The extent of these effects varies depending on the intensity of the disturbances. Among other consequences, clear-cutting or intensive timber harvesting results in the depletion of soil organic matter (SOM - [4], [10]). Furthermore, it has a significant influence on the contents of soil organic carbon (SOC) and total nitrogen (N) and soil nutrients such as phosphorus (P), potassium (K), calcium (Ca), and magnesium (Mg - [28], [4], [25]). Forest soils play a vital role in N cycling and C sequestration, and clear-cutting has a direct and indirect impact on these processes ([39], [27], [25]). Clear-cutting disrupts SOC and N dynamics by reducing litter, altering soil temperature and moisture, and affecting microbial activity, which influences SOM mineralization and nitrification ([31], [11]). Harvested trees and reduced ground vegetation limit the availability of litterfall and root exudates, which are the primary food sources for soil microorganisms, resulting in reduced microbial biomass and respiration ([16]). These effects vary with factors such as climate, vegetation, disturbance intensity, and soil type ([36], [23]).
Previous studies have demonstrated that the variation in the harvesting impact on C stocks in mineral soils depends primarily on soil type. Sandy soils are considered relatively sensitive to intensive forest harvesting due to their poorly preserved soil organic matter ([9], [29]). For instance, the National Forest Inventory program in Sweden demonstrated that the C content in the organic layer decreased by an average of 16.5% within the first 29-50 years after forest harvesting in different forest types ([12]). The recovery period for soil carbon content after harvesting has been shown to depend on soil type, with a recovery time of approximately 60 years for productive forests ([22]). However, soil microbiological parameters, such as soil microbial biomass carbon (SMBC), microbial biomass nitrogen (SMBN), and microbial respiration, provide an immediate response to changes in soil conditions, SOM quality, and C and N dynamics ([1], [2], [40]). For this reason, these parameters are effective indicators of soil quality under various management practices, including clear-cutting ([32], [15]). Furthermore, these soil biological parameters are critical for SOC immobilization. Indeed, soil microbial respiration - the production of CO2 resulting from the decomposition of organic matter in soil - represents a significant carbon flux from forest ecosystems to the atmosphere. Generally, CO2 release is enhanced by soil microbial activity due to site disturbances, followed by changes in soil temperature and moisture regimes, as well as carbon availability ([8]).
This study aimed to evaluate the SOC and TN stocks, along with the concentrations of SMBC and SMBN, as well as their ratios (SOC:TN and SMBC:SMBN), and soil microbial respiration during the first three years following clear-cutting of a Scots pine (Pinus sylvestris L.) stand, and compare them with those measured in a mature Scots pine stand. We hypothesized that parameters such as SMBC, SMBN, SMBC:SMBN, and microbial respiration, evaluated together with SOC and TN stocks, are more responsive to drastic ecosystem changes, making this combination of parameters more effective in identifying changes and potential stabilization of SOC and TN soon after clear-cutting.
Materials and methods
Study site
The study area was located in southeastern Lithuania (54° 24′ N, 25° 00′ E). The research was conducted in 1st-, 2nd- and 3rd-year clear-cuts of former mature Scots pine (Pinus sylvestris L.) stands and their adjacent mature Scots pine stand. All sites are classified as Vaccinio-myrtillosum forest type and are characterized by infertile sandy soil with an approximate 3% humus content and an average forest floor depth of 2-4 cm. According to the National Forest Inventory data (2023), Scots pine covers 34.5% of Lithuania’s territory and is the predominant forest type in the country. The mean annual air temperature in the study area is 7.4 °C, and the mean annual precipitation is 695 mm, according to Lithuania’s 1991-2020 climate normal data.
The soil was described as an infertile sandy Arenosol ([41]), dominated by a sand fraction of 79%-85% with a minor admixture of silt and clay. The forest site type was characterized as oligotrophic mineral soil with normal moisture (classified as Nb according to the Lithuanian classification - [37]). The key dominant vascular vegetation species in the ground vegetation layer were Vaccinium myrtillus L., Vaccinium vitis-idaea L., Melampyrum pratense L., Luzula pilosa (L.) Wild, and Trientalis europaea L., covering from 14% to 40% of the area, while the moss Ptilium crista-castrensis (Hedw.) De Not. and Hylocomium splendens (Hedw.) Schimp. covers 85%.
To evaluate selected chemical and microbiological soil parameters, the study area included one-, two-, and three-year-old clear-cut sites, where mature Scots pine stands have been harvested by final clear-cutting in 2017, 2016, and 2015, respectively. These sites were adjacent to 105- to 130-year-old Scots pine stands, which were left as control sites. Forest harvesting was organized as clear-cutting, meaning all tree stems and large branches were removed from the sites. During the study period, the mature stands corresponded to a forest stand volume of 310-340 m3 ha-1, with a mean tree diameter at 1.3 m above ground level (DBH) of 37-38 cm, and a mean tree height of approximately 31 m. The stocking level (i.e., the ratio of the sums of diameters of the measured vs. normal stands, assuming a value of 1 in normal stands where tree crowns are completely closed) ranged from 0.7 to 0.8. More specifically, the paired-site design was applied, and three pairs of study sites were chosen: a 1st-year clear-cut site and its adjacent forest site, a 2nd-year clear-cut site and its adjacent forest site, and a 3rd-year clear-cut site and its adjacent forest site. All sites were located within a radius of about 5 km. The data was compared between the clear-cut site and the adjacent forest site.
Soil sampling and measurements
Each clear-cut and the adjacent mature forest were designed with three temporary observation plots of 400 m2. A metal auger with a 3 cm diameter was used to collect mineral soil samples at the end of the vegetation period. Samples were collected separately from two layers: 0-10 cm and 10-20 cm. One pooled sample was created for each observation plot and soil layer, resulting in three samples (replicates) for each 1st-year, 2nd-year, and 3rd-year clear-cut, as well as the mature forest. Each pooled soil sample was formed by combining ten subsamples, which were collected from ten points/places along two south-north transects within each observation plot. The distance between these two transects was about 15 meters, and the distance between the sample points/places was 5.0 ± 0.5 meters. Atypical places, such as under accumulations of logging residues, near stumps or large roots, were avoided.
The chemical analyses were performed on soil samples to estimated the followingvariables: total nitrogen (TN), which was analyzed by the Kjeldahl method ([18]); NH4-N by sodium phenolate and sodium-hypochlorite; NO3-N and NO2-N by sulfanilamide; total SOC concentration was determined using a dry combustion method with a total carbon analyzer (Analytic Jena multi EA 4000, Germany), according to the standard ISO-10694 ([17]). The bulk density (g cm-3) of fine (<2 mm) mineral soil in the 0-10 cm and 10-20 cm soil layers was analyzed according to the standard ISO-11272 ([19]). This data was used to calculate the SOC and TN stocks.
The soil microbial biomass carbon (SMBC) and nitrogen (SMBN) concentrations were analyzed by the fumigation-extraction process ([20]). Soil samples were fumigated in a vacuum desiccator for 24 hours with alcohol-free chloroform (CHCl3) vapor. The SMBC concentrations (µg g-1) were estimated using the 0.5 M K2SO4 extract with an efficiency factor of 2.64 ([38]), and the SMBN concentration (µg g-1 DM) was estimated using the potassium sulphate (K2SO4) extract with an efficiency factor of 0.54 ([5]). Soil microbial respiration was measured in the 2nd-year and 3rd-year clear-cuts, comparing their values with those obtained in a mature forest. The 1st-year clear-cut was not included in this analysis because it was assumed that a rapid response to the high ecosystem disturbance might yield inaccurate values. The soil microbial respiration, as measured by the average released CO2 (mg g-1 per day) in the 0-10 cm and 10-20 cm soil layers, was determined using the CO2 titration method ([21]). The procedure involved soil incubation in a closed vessel for 7 days, after which the released CO2 was absorbed in a sodium hydroxide (NaOH) solution. After the titration, the released CO2 was calculated according to ISO-16072 ([21]) and Schinner et al. ([34]) (eqn. 1):
where RCO2 is the rate of CO2 release from dry soil (mg CO2 g-1 day-1); V is the volume of HCl used in control (ml); V1 is the volume of HCl used in the test sample (ml); m is the mass of the dry soil sample (g); 4.4 is a factor (1 ml of 0.2 molars NaOH corresponds to 4.4 mg of CO2) (mg ml-1); t is the incubation period (days).
Data analysis
The SOC and TN stocks in mineral soil 0-10 cm and 10-20 cm layers were calculated according as follows (eqn. 2, eqn. 3):
where SOC is soil organic carbon (t ha-1); TN is total nitrogen (t ha-1); ρi is the bulk density of the <2 mm fraction (g cm-3); δi, 2 mm is the relative volume of the ≥ 2 mm fraction (%); di denotes the thickness of layer i (cm); Ci and Ni denote the SOC or TN concentration of layer i, respectively (mg g-1); and 10-1 is a unit factor (10-9 mg Mg-1 × 108 cm2 ha-1).
The obtained data were used to calculate the following indices: the SMBC:SMBN ratio, calculated as the ratio of soil microbial biomass C to N; the SMBC/SOC ratio, the ratio of SMBC to SOC; and the SMBN/TN ratio, the ratio of SMBC to TN. The normality of the data was tested using the Lilliefors and Kolmogorov-Smirnov tests, which indicated that the data distribution did not meet normality assumptions. Therefore, a non-parametric Kruskal-Wallis analysis of variance (ANOVA) followed by a Dunn-Bonferroni post-hoc test was used. Pearson’s correlation analysis was conducted to evaluate the relationship between soil quality indicators. Data are presented as means ± standard error (SE). All statistical analyses were carried out using the software STATISTICA® v. 12.0 (StatSoft Inc., Tulsa, OK, USA) with a significance level of α = 0.05 in all cases.
Results
Soil organic carbon and nitrogen concentrations and stocks
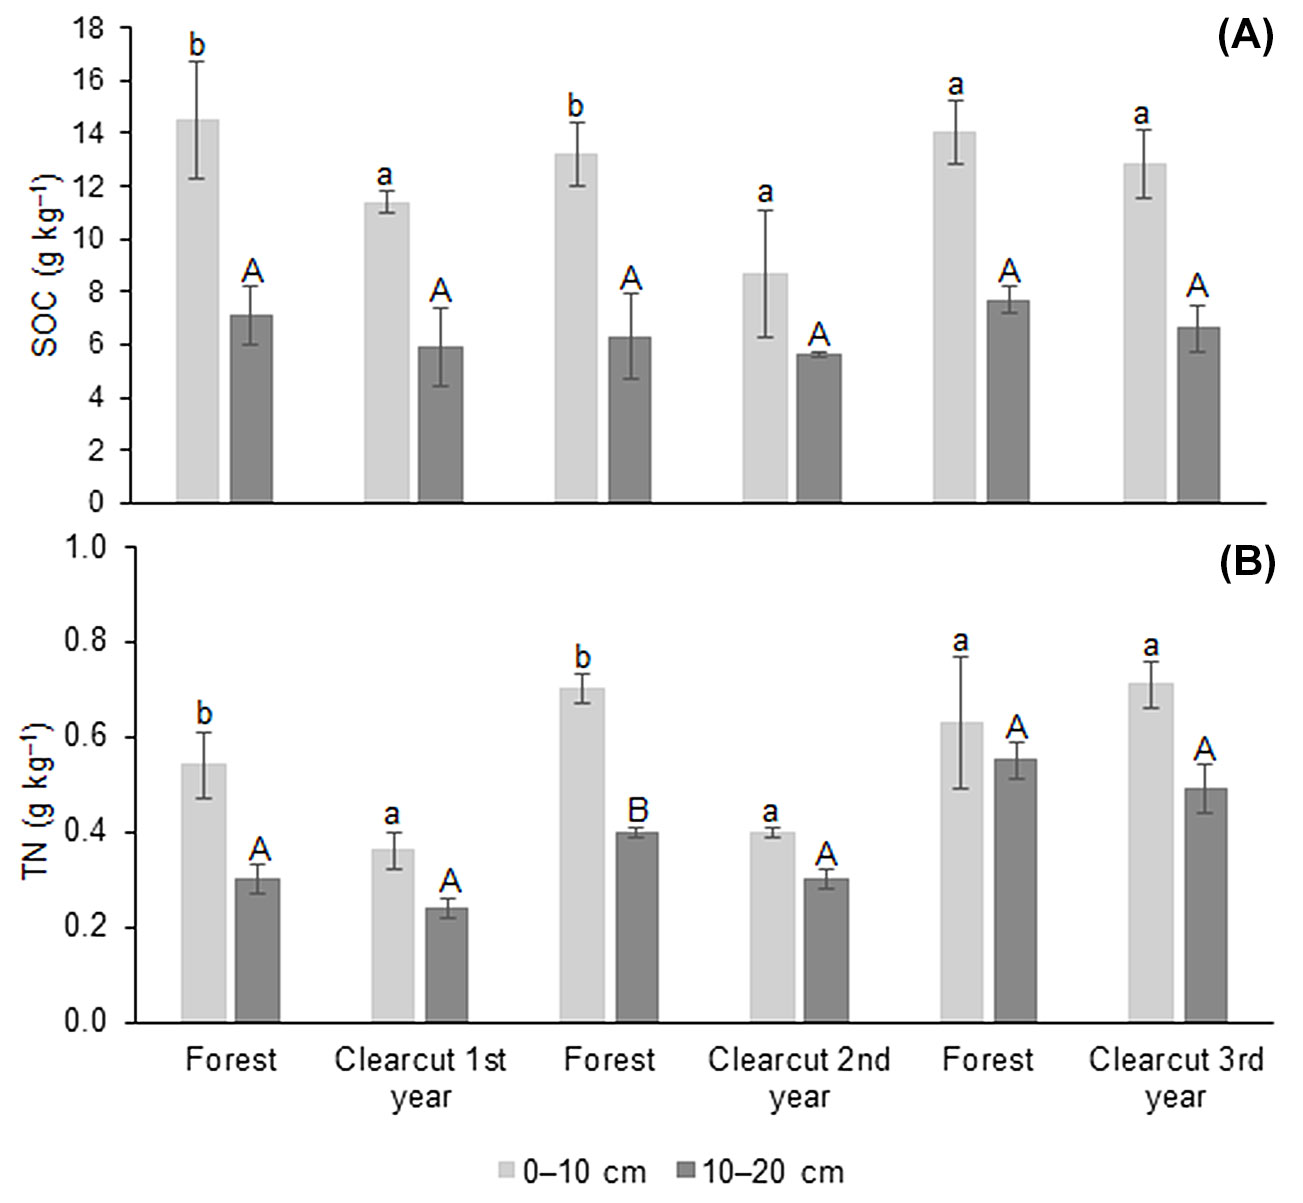
The mean concentrations of SOC in the 0-10 cm and 10-20 cm layers of the studied soils ranged from approximately 5.6 to 14.5 g kg-1 (Tab. 1). Significant differences (p ≤ 0.05) in mean SOC concentrations were found in the 0-10 cm soil layer between the forest and the 1st- and 2nd-year clear-cut. The SOC concentrations were 1.3-1.5 times higher in the forest than in the clear-cuts. The concentrations of NO3-N, NO2-N, and NH4-N nitrogen were up to 5.9 times lower in the control mature stands than in the clear-cuts (Tab. 1). The concentrations of NO3-N, NO2-N, and NH4-N were 3.7 times higher in the 3rd-year than in the 1st-year clear-cuts soil samples.
Tab. 1 - Mean (± SE) concentrations of soil organic carbon (SOC, g kg-1), nitrate (NO3-N, mg kg-1), nitrite (NO2-N, mg kg-1) and ammonium (NH4-N, mg kg-1) and total nitrogen (TN, g kg-1) in mature Scots pine stand (Forest) and clear-cuts. (*): Significant differences (p ≤ 0.05) between the forest and 1st-year clear-cut, forest and 2nd-year clear-cut, and forest and 3rd-year clear-cut within each soil layer.
| Parameter | Soil Layer | Forest | 1st-year clear-cut |
Forest | 2nd-year clear-cut |
Forest | 3rd-year clear-cut |
|---|---|---|---|---|---|---|---|
| SOC (g kg-1) | 0-10 cm | 14.5 ± 2.2* | 11.4 ± 0.4 | 13.2 ± 1.2* | 8.7 ± 2.4 | 14.0 ± 1.2 | 12.8 ± 0.8 |
| 10-20 cm | 7.1 ± 1.1 | 5.9 ± 1.5 | 6.3 ± 1.6 | 5.6 ± 0.1 | 7.7 ± 0.5 | 6.6 ± 0.9 | |
| NO3-N (mg kg-1) | 0-10 cm | 0.03 ± 0.02 | 0.09 ± 0.02* | 0.22 ± 0.03 | 1.30 ± 0.47* | 0.08 ± 0.00 | 0.18 ± 0.08* |
| 10-20 cm | 0.06 ± 0.02 | 0.13 ± 0.04* | 0.23 ± 0.01 | 0.62 ± 0.24* | 0.01 ± 0.00 | 0.26 ± 0.19* | |
| NO2-N (mg kg-1) | 0-10 cm | 2.52 ± 0.04 | 2.76 ± 0.45 | 1.74 ± 0.23 | 5.72 ± 1.56* | 2.37 ± 0.54 | 10.20 ± 2.75* |
| 10-20 cm | 1.73 ± 0.43 | 2.03 ± 0.57 | 1.24 ± 0.05 | 1.76 ± 0.68 | 2.48 ± 0.36 | 4.27 ± 0.71* | |
| NH4-N (mg kg-1) | 0-10 cm | 2.49 ± 0.38 | 2.67 ± 0.43 | 1.52 ± 0.20 | 4.42 ± 1.60* | 2.30 ± 0.46 | 10.02 ± 2.77* |
| 10-20 cm | 1.67 ± 0.44 | 2.03 ± 0.50 | 1.01 ± 0.05 | 1.14 ± 0.24 | 2.47 ± 0.37 | 4.01 ± 0.68* | |
| TN (g kg-1) | 0-10 cm | 0.54 ± 0.07* | 0.36 ± 0.04 | 0.70 ± 0.03* | 0.40 ± 0.01 | 0.63 ± 0.14 | 0.71 ± 0.05 |
| 10-20 cm | 0.30 ± 0.03* | 0.24 ± 0.02 | 0.40 ± 0.01* | 0.30 ± 0.02 | 0.55 ± 0.04 | 0.49 ± 0.05 |
The mean concentrations of TN varied from 0.36 to 0.71 g kg-1 in the 0-10 cm layer and from 0.24 to 0.55 g kg-1 in the 10-20 cm layer (Tab. 1). The mean TN concentrations in the adjacent, mature forest were 1.5-1.8 times higher in the 0-10 cm layer and 1.3 times higher in the 10-20 cm layer than in the 1st- and 2nd-year clear-cuts. No differences were found between the 3rd-year clear-cuts and the mature forest.
The SOC stocks were 1.4-1.5 times higher in the 0-10 cm and 10-20 cm soil layers in the mature forest than in the 1st- and 3rd-year clear-cuts (Fig. 1). Similarly, 1.5-2.0 times higher TN stocks were found in the forest topsoil layer than in the 1st- and 2nd-year clear-cuts. The smallest differences in SOC or no significant differences in the TN stocks were found between the mature forest and the 3rd-year clear-cut.
Fig. 1 - Mean (± SE) stocks of soil organic carbon (SOC, t ha-1 - A) and total nitrogen (TN, t ha-1 - B) in forest and clear-cut at a layer of 0-10 cm and 10-20 cm (n = 3). Different lowercase letters indicate significant differences (p ≤ 0.05) in the 0-10 cm soil layer, and uppercase letters indicate significant differences in the 10-20 cm soil layer between forest and 1st-3rd-year clear-cuts at p ≤ 0.05.
Soil microbial biomass carbon and nitrogen concentrations and microbial respiration
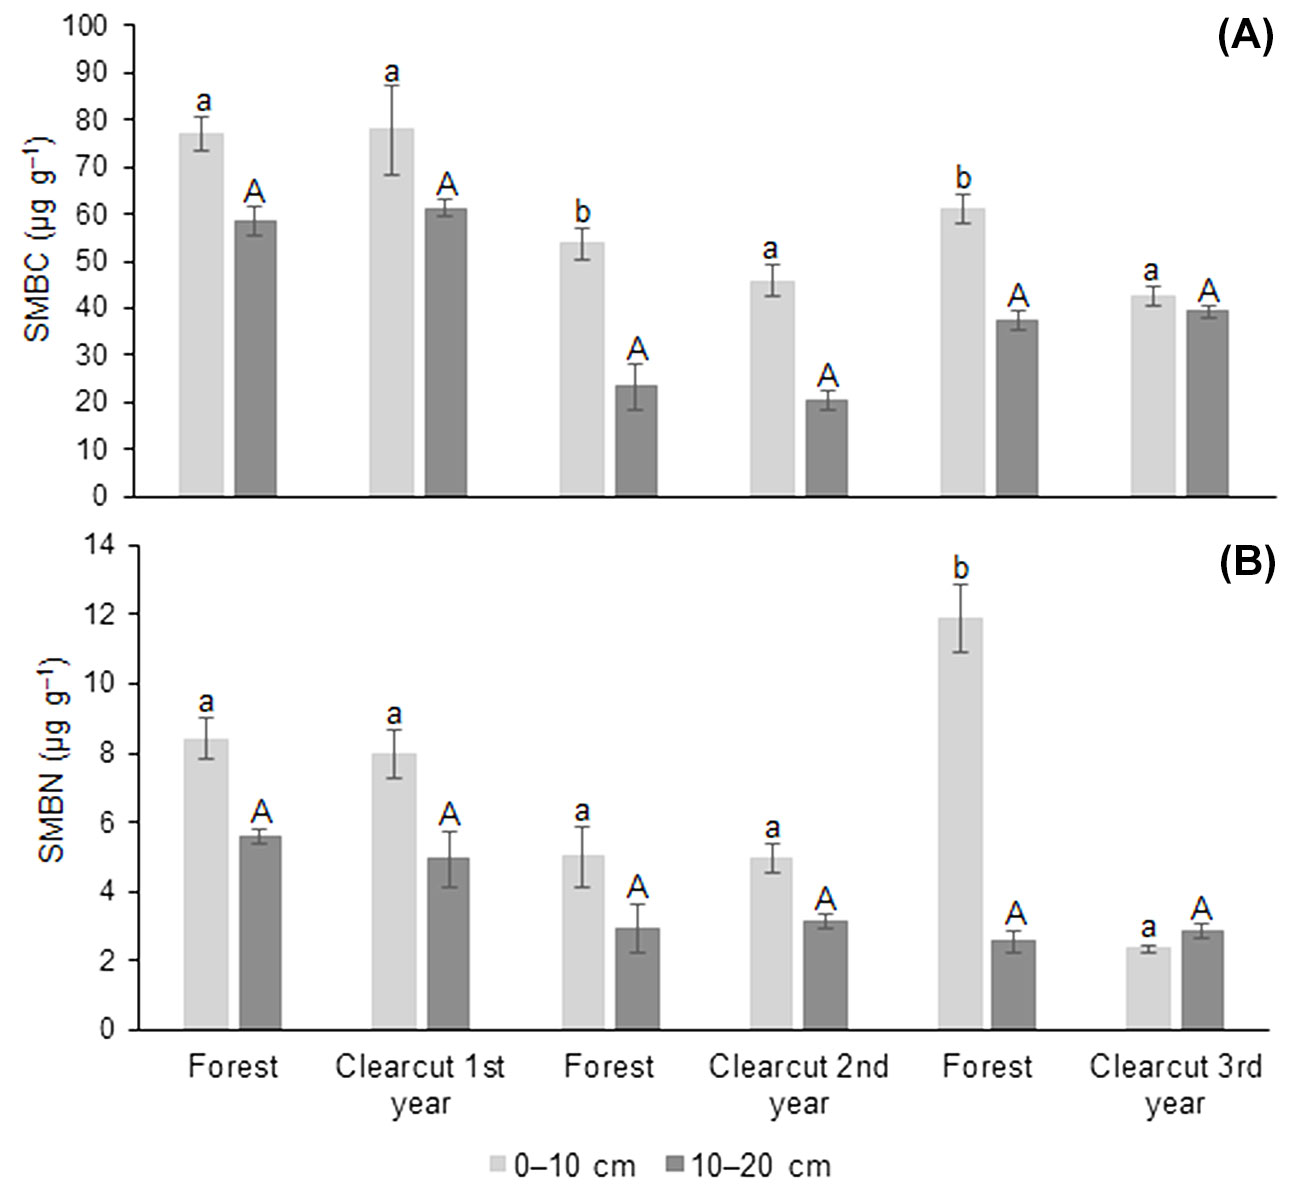
The mean SMBC concentrations in mature forests and clear-cuts ranged from 42.7 to 77.8 µg g-1 in the 0-10 soil layer and from 20.4 to 61.3 µg g-1 in the 10-20 cm layer (Fig. 2). There were no differences between the forest and the 1st-year clear-cut. The SMBC concentration in the mature forest soil samples was 1.2-1.4 times higher than in the 2nd- and 3rd-year clear-cut soil samples. In the mature forest and clear-cuts, the mean SMBN concentrations were from 2.4 to 11.9 µg g-1 in the 0-10 soil layer and from 2.9 to 5.6 µg g-1 in the 10-20 cm layer (Fig. 2). The mean SMBN concentration did not differ between forest and 1st- and 2nd-year clear-cuts. In the 3rd-year of clear-cut, the SMBN concentrations were about five times higher in the 0-10 cm layer in the mature forests than in the clear-cuts (Tab. 2).
Fig. 2 - Mean (± SE) concentrations of soil microbial biomass carbon (SMBC, µg g-1 - A) and nitrogen (SMBN, µg g-1 - B) in forest and clear-cut at a layer of 0-10 cm and 10-20 cm (n = 3). Different lowercase letters indicate significant differences (p ≤ 0.05) in the 0-10 cm soil layer, and uppercase letters indicate significant differences in the 10-20 cm soil layer between forest and 1st-3rd-year clear-cuts.
Tab. 2 - Mean (±SE) ratios of soil organic carbon (SOC) and total nitrogen (TN) parameters in 0-10 cm and 10-20 cm layers in forests and clear-cuts. (*): Significant differences (p ≤ 0.05) between the forest and 1st-year clear-cut, forest and 2nd-year clear-cut, and forest and 3rd-year clear-cut within each soil layer.
| Parameter | Layer (cm) | Mature Forest |
1st year clear-cut |
Mature Forest |
2nd year clear-cut |
Mature Forest |
3rd-year clear-cut |
|---|---|---|---|---|---|---|---|
| SOC:TN | 0-10 cm | 27.01 ± 2.99 | 32.54 ± 3.49 | 18.91 ± 0.02 | 22.73 ± 0.52* | 23.53 ± 3.40* | 18.14 ± 1.22 |
| 10-20 cm | 23.16 ± 2.23 | 24.40 ± 3.95 | 17.38 ± 0.53 | 19.29 ± 1.00* | 14.37 ± 1.65 | 13.66 ± 2.09 | |
| SMBC/SOC (%) | 0-10 cm | 0.61 ± 0.10 | 0.67 ± 0.05 | 0.42 ± 0.02 | 0.61 ± 0.04* | 0.47 ± 0.13* | 0.34 ± 0.03 |
| 10-20 cm | 0.88 ± 0.19 | 1.16 ± 0.26 | 0.46 ± 0.02* | 0.36 ± 0.01 | 0.48 ± 0.10 | 0.62 ± 0.02 | |
| SMBN/TN (%) | 0-10 cm | 1.61 ± 0.23 | 1.44 ± 0.17 | 0.97 ± 0.01 | 1.21 ± 0.03* | 0.47 ± 0.12 | 0.35 ± 0.01 |
| 10-20 cm | 1.89 ± 0.08 | 2.27 ± 0.50 | 0.75 ± 0.17 | 1.09 ± 0.01* | 0.49 ± 0.02 | 0.59 ± 0.06* | |
| SMBC:SMBN | 0-10 cm | 9.30 ± 1.10 | 9.68 ± 0.37 | 11.34 ± 1.24* | 9.25 ± 0.78 | 17.49 ± 7.77 | 18.19 ± 0.89 |
| 10-20 cm | 10.41 ± 0.80 | 10.21 ± 0.33 | 7.92 ± 0.60* | 6.44 ± 0.14 | 14.80 ± 1.04 | 13.82 ± 1.22 |
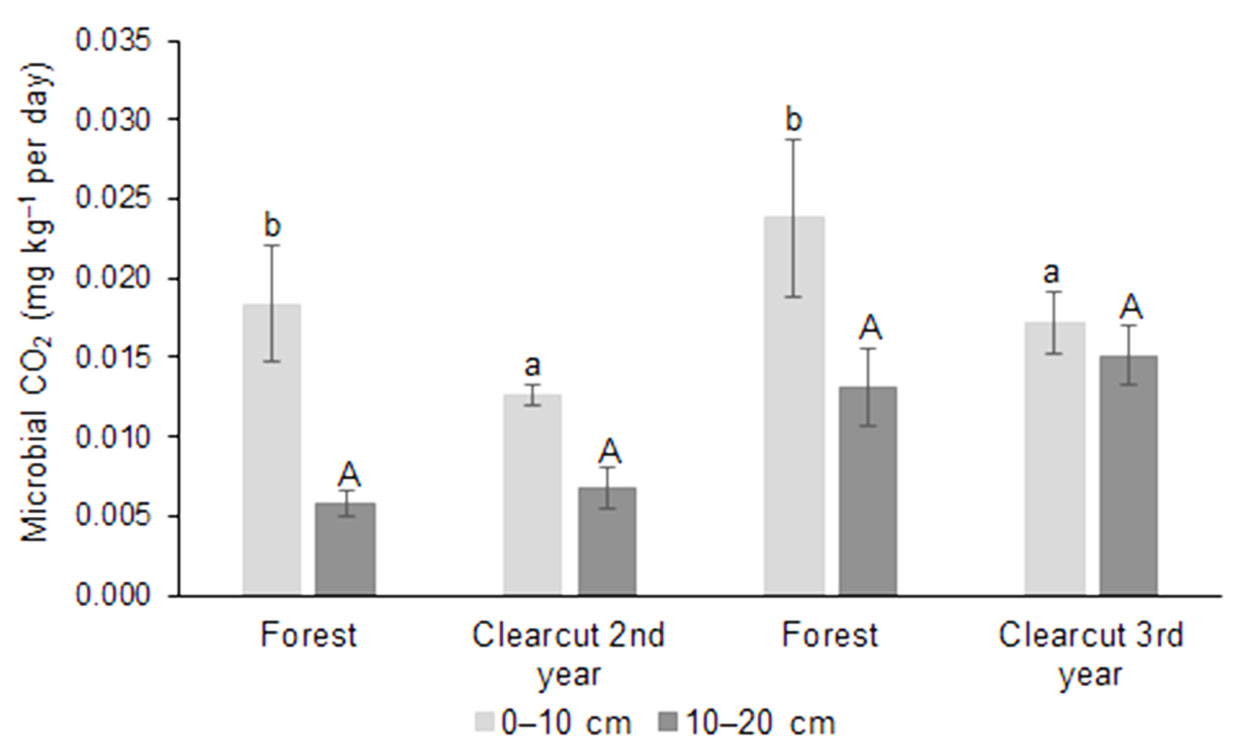
The mean soil microbial respiration (microbial CO2, an indicator of soil microbial activity) varied between 0.0058 mg g-1 and 0.0238 mg g-1 per day in the mature forests and clear-cuts (Fig. 3). The mean microbial CO2 in the 0-10 cm soil layer was 1.4 times higher in the forest than in the 2nd and 3rd-year clear-cut. No significant differences in microbial CO2 intensity were found in the 10-20 cm soil layer.
Fig. 3 - Mean (± SE) soil microbial respiration (CO2, mg g-1 per day) in the 0-10 cm and 10-20 cm layers in the forest and in the 2nd- and 3rd-year clear-cuts. Different lowercase letters indicate significant differences (p ≤ 0.05) in the 0-10 cm soil layer, and uppercase letters indicate significant differences in the 10-20 cm soil layer between forest and 1st-3rd-year clear-cuts.
Relationships between soil indices
The SOC:TN ratio in the 0-10 and 10-20 cm soil layers ranged from 13.7 to 32.5 in the mature Scots pine forest and 1st- to 3rd-year clear-cuts (Tab. 3). The SOC:TN ratio was 1.2 times lower in the forest than in the clear-cuts. The SMBC/SOC ranged from 0.34% to 1.16%, with significant differences between the mature forest and 2nd- and 3rd-year clear-cut plots. The SMBN/TN ratio ranged from 0.35 to 1.61 in the 0-10 cm soil layer and from 0.49 to 2.27 in the 10-20 cm layer. A significantly higher SMBN/TN ratio was found in the control forest than in the 2nd-year clear-cut. The mean SMBC:SMBN ratios varied from 7.9 to 18.2 (Tab. 3). No significant differences were found in the SMBC:SMBN ratios between the forest and clear-cuts, except in the 0-10 and 10-20 cm soil layers between the mature forest and the 2nd- year clear-cut plot.
Tab. 3 - Correlation coefficients between different soil indicators in the mature Scots pine forests (data was aggregated from three forest sites and both soil layers together, n = 18) and in the 1st-, 2nd- and 3rd-years clear-cuts (for each clear-cut, data was aggregated from both soil layers, n = 9). (SOC): soil organic carbon; (TN): total nitrogen in soil; (NO3): nitrate; (NO2): nitrite; (NH4): ammonium; (SMBC): soil microbial biomass carbon; (SMBN): soil microbial biomass nitrogen; (CO2): soil microbial respiration; (SOC:TN): SOC and TN ratio; (SMBC:SMBN): soil microbial biomass carbon and soil microbial biomass nitrogen ratio; (SMBC/SOC): soil microbial biomass carbon in SOC concentration; (SMBN/TN): soil microbial biomass nitrogen in TN concentration; (*): p ≤ 0.05.
| Case | Indicator | TN | NO3 | NO2 | NH4 | SMBC | SMBN | CO2 | SOC:TN | SMBC:SMBN | SMBC/SOC | SMBN/TN |
|---|---|---|---|---|---|---|---|---|---|---|---|---|
| Mature Scots pine forest |
SOC | 0.53* | 0.01 | 0.43 | 0.41 | 0.60* | 0.22 | 0.47* | 0.57* | 0.38 | -0.44* | -0.18 |
| TN | - | 0.35 | 0.44 | 0.37 | -0.06 | -0.17 | 0.3 | -0.41* | 0.32 | -0.56* | -0.63* | |
| NO3 | - | - | -0.27 | -0.4 | -0.39 | -0.13 | 0.39 | -0.3 | -0.2 | -0.33 | -0.26 | |
| NO2 | - | - | - | 0.99* | 0.24 | 0.06 | 0.03 | 0.04 | 0.37 | -0.26 | -0.18 | |
| NH4 | - | - | - | - | 0.29 | 0.08 | -0.03 | 0.08 | 0.38 | -0.21 | -0.14 | |
| SMBC | - | - | - | - | - | 0.65* | 0.62* | 0.68* | 0.2 | 0.39 | 0.51* | |
| SMBN | - | - | - | - | - | - | 0.22 | 0.38 | -0.57* | 0.36 | 0.79* | |
| CO2 | - | - | - | - | - | - | - | 0.24 | 0.38 | 0.26 | 0.07 | |
| SOC:TN | - | - | - | - | - | - | - | - | 0.11 | 0.04 | 0.41 | |
| SMBC:SMBN | - | - | - | - | - | - | - | - | - | -0.12 | -0.52* | |
| SMBC/SOC | - | - | - | - | - | - | - | - | - | - | 0.71* | |
| 1st-year clear-cuts |
SOC | 0.84* | -0.29 | 0.28 | 0.3 | 0.61* | 0.42 | - | 0.77* | 0.56* | -0.88* | -0.83* |
| TN | - | -0.13 | 0.44 | 0.44 | 0.83* | 0.36 | - | 0.3 | 0.12 | -0.61* | -0.55* | |
| NO3 | - | - | -0.33 | -0.39 | 0.04 | 0.60* | - | -0.33 | 0.05 | 0.25 | 0.03 | |
| NO2 | - | - | - | 0.99* | 0.78* | -0.04 | - | -0.06 | 0 | 0.18 | 0.16 | |
| NH4 | - | - | - | - | 0.76* | -0.08 | - | -0.03 | 0 | 0.16 | 0.16 | |
| SMBC | - | - | - | - | - | 0.4 | - | 0.09 | 0.15 | -0.2 | -0.24 | |
| SMBN | - | - | - | - | - | - | - | 0.38 | 0.68* | -0.43 | -0.67* | |
| CO2 | - | - | - | - | - | - | - | - | - | - | - | |
| SOC:TN | - | - | - | - | - | - | - | - | 0.86* | -0.85* | -0.86* | |
| SMBC:SMBN | - | - | - | - | - | - | - | - | - | 0.60* | -0.76* | |
| SMBC/SOC | - | - | - | - | - | - | - | - | - | - | 0.95* | |
| SMBN/TN | - | - | - | - | - | - | - | - | - | - | - | |
| 2nd-year clear-cuts |
SOC | 0.55* | 0.35 | 0.91* | 0.92* | 0.86* | 0.93* | 0.81* | 0.32 | 0.69* | 0.43 | -0.22 |
| TN | - | 0.59* | 0.76* | 0.67* | 0.32 | 0.38 | 0.66* | -0.60* | 0.2 | -0.07 | -0.29 | |
| NO3 | - | - | 0.53 | 0.29 | 0.60* | 0.47 | 0.76* | -0.39 | 0.62* | 0.61 | 0.41 | |
| NO2 | - | - | - | 0.96* | 0.75* | 0.85* | 0.80* | -0.02 | 0.52* | 0.28 | 0.2 | |
| NH4 | - | - | - | - | 0.66* | 0.81* | 0.67* | 0.1 | 0.40* | 0.12 | -0.36 | |
| SMBC | - | - | - | - | - | 0.96* | 0.86* | 0.41 | 0.94* | 0.82* | 0.17 | |
| SMBN | - | - | - | - | - | - | 0.78* | 0.44 | 0.80* | 0.66* | -0.06 | |
| CO2 | - | - | - | - | - | - | - | -0.05 | 0.84* | 0.61* | 0.22 | |
| SOC:TN | - | - | - | - | - | - | - | - | 0.39 | 0.45 | -0.04 | |
| SMBC:SMBN | - | - | - | - | - | - | - | - | - | 0.92 | 0.35 | |
| SMBC/SOC | - | - | - | - | - | - | - | - | - | - | 0.49 | |
| 3rd-year clear-cuts |
SOC | 0.90* | 0.06 | 0.59* | 0.59* | 0.23 | -0.60* | 0.76* | 0.85* | 0.57* | -0.93* | -0.91* |
| TN | - | 0.21 | 0.81* | 0.79* | 0.25 | -0.65* | 0.74* | 0.56* | 0.47 | -0.81* | -0.93* | |
| NO3 | - | - | -0.14 | -0.19 | -0.77* | 0.2 | -0.48 | -0.1 | -0.64* | -0.24 | 0.05 | |
| NO2 | - | - | - | 0.99* | 0.53 | -0.51 | 0.78* | 0.2 | 0.48 | -0.46 | -0.74* | |
| NH4 | - | - | - | - | 0.56* | -0.52* | 0.79* | 0.17 | 0.51 | -0.44 | -0.74* | |
| SMBC | - | - | - | - | - | -0.58* | 0.72* | -0.32 | 0.86* | -0.1 | -0.49 | |
| SMBN | - | - | - | - | - | - | -0.78* | 0.55* | -0.82* | 0.36 | 0.84* | |
| CO2 | - | - | - | - | - | - | - | - | 0.87* | -0.53* | -0.88* | |
| SOC:TN | - | - | - | - | - | - | - | - | 0.51 | -0.87* | -0.64* | |
| SMBC:SMBN | - | - | - | - | - | - | - | - | - | -0.37 | -0.75* | |
| SMBC/SOC | - | - | - | - | - | - | - | - | - | - | 0.77* |
Relationships between soil properties
In the mature Scots pine forest, the SOC concentration was positively correlated with the TN, SMBC, microbial CO2 concentrations and the SOC:TN ratio (r = 0.47-0.60, p ≤ 0.05), but negatively correlated with the SMBC/SOC ratio (r = -0.44, p ≤ 0.05 - Tab. 3). The TN concentration was negatively correlated with the SOC:TN, SMBC/SOC and SMBN/TN ratios (r = -0.41 to -0.63). The SMBC showed a positive, moderate correlation with the SMBN, microbial CO2, SOC:TN, and SMBN/TN ratios (r = 0.51-0.68). The SMBN had a strong positive correlation with the SMBN/TN (r = 0.79) and a negative correlation with the SMBC:SMBN (r = -0.57). Moderate negative correlations were found between SMBC:SMBN and SMBN/TN, while SMBC/SOC was strongly positively correlated with SMBN/TN.
In the 1st-year clear-cuts, the concentration of SOC showed a strong positive correlation with TN (r = 0.84, p ≤ 0.05) and the SOC:TN ratio (r = 0.77), a moderate correlation with SMBC:SMBN (r = 0.56), and a negative correlation with SMBC/SOC and SMBN/TN (r = -0.88 and -0.83, respectively - Tab. 3). TN was strongly correlated with SMBC (r = 0.83) but negatively correlated with SMBC/SOC and SMBN/TN (r = -0.61 and r = -0.55, respectively). SMBC concentrations showed moderate to strong positive correlations with SOC, TN, NO3-N, and NH4+-N (r = 0.61-0.83). Meanwhile, SMBN had a positive correlation with NO3-N and the SMBC:SMBN ratio (r = 0.60-0.68) and a negative correlation with SMBN/TN (r = -0.67). In the 2nd-year clear-cuts, SOC showed positive correlations with TN, NO2-N, NH4-N, SMBC, SMBN, microbial CO2, and the SMBC:SMBN ratio (r = 0.55-0.92). TN positively correlated with NO3-N, NO2-N, NH4-N, and microbial CO2 (r = 0.59-0.76) but negatively correlated with the SOC:TN ratio (r = -0.60). Microbial properties, such as SMBC and SMBN, had a strong positive correlation with each other, as well as with SOC, NO2-N, NH4-N, and microbial CO2 (r = 0.66-0.96). In the 3rd-year clear-cuts, SOC showed strong positive correlations with TN and the SOC:TN ratio (r = 0.90 and 0.85, respectively). It also correlated with NO2-N, NH4-N, microbial CO2, and the SMBC:SMBN ratio (r = 0.66-0.96). SOC and TN showed negative correlations with SMBN, SMBC/SOC, and SMBN/TN (r = -0.60 to -0.93). The SMBC showed a positive correlation with CO2, SMBC:SMBN, and NH4-N (r = 0.56-0.86), while exhibiting a negative correlation with SMBN (r = -0.58) and NO3-N (r = -0.77). The SMBN was negatively related to several parameters, including SOC, TN, NH4-N, SMBC, CO2, and the SMBC:SMBN ratio (r = -0.52 to -0.82).
Discussion
This study aimed to evaluate the dynamics of SOC and TN in the soil of mature Scots pine stands in the three years immediately following clear-cutting. We simulated the clear-cutting response to soil quality parameters through a paired-site design, showing the potential immediate effects of clear-cutting. The first objective was to compare SOC and TN concentrations and stocks, as well as the SOC:TN ratio, between Scots pine mature forests and adjacent clear-cut plots. The results showed that in the initial two years after clear-cutting, SOC concentrations were up to 1.5 times higher in the mature forests than in the clear-cut areas, with the lowest SOC concentration observed in the 2nd year after clear-cutting. By the third year, the differences in SOC concentrations between the mature forests and clear-cuts became insignificant, though SOC concentrations remained higher in the forest soil. Similarly, TN concentrations remained higher in the soil of mature forests than in the clear-cut areas in 0-10 and 10-20 cm soil layers during the first and second years after clear-cutting. However, by the 3rd year, TN concentrations in the 0-10 cm soil layer of the clear-cut showed a slight but statistically insignificant increasing trend. The SOC and TN stocks showed higher values in the forest topsoil layers than in the clear-cut sites, but the TN values in the mature forest and 3rd-year clear-cuts were comparable. The SOC:TN ratio in the first two years after clear-cutting was 1.2 times lower in the forest than in the clear-cuts. An increase in the SOC:TN ratio in the soil after clear-cutting is a typical consequence due to soil C and N dynamics, indicating C accumulation and N loss ([36]), as well as slower N release, changes in microbial activity, and reduced N inputs from vegetation due to lower litterfall and root turnover ([10]). Tutua et al. ([36]) indicated that harvest residue retention by 45% and 32%, respectively, increased total C and N in the soil over a 12- to 24-month period. The opposite results were reported by Fujii et al. ([10]), who found that the SOC:TN ratio decreased in the second year after clear-cutting due to the removal of harvest residues and changes in microclimatic conditions.
In the forest, a SOC:TN ratio above 30, resulting from fresh litter input, enhances microbial N uptake ([33]). In our study, the SOC:TN ratio was less than 30 in most cases, while a higher ratio was observed only in the 0-10 cm soil layer at the 1st-year clear-cut area, indicating an immediate response to clear-cutting. This could be due to changes in microbial activity, which can also influence SOC:TN ratios ([6], [25]).
The concentrations of NO3-N, NO2-N, and NH4-N were almost five times higher in the 2nd- and 3rd-year clear-cuts compared with the mature Scots pine forest. This trend indicated a faster nitrification and mineralization (ammonification) process over time, particularly in the surface layer (0-10 cm), after the clear-cutting. Previous studies have shown that NH4+ and NO3- concentrations in mineral soil horizons typically increase after clear-cutting ([3], [13]). The higher concentrations of NO3-N, NO2-N, and NH4-N in the clear-cuts can be attributed to various factors, including the decomposition of forest floor materials and organic matter, mineralization processes driven by microbial activity, and the release of N from biomass and harvesting residues. Gustiene ([14]) found that the concentration of mineral N (NO3-N + NO2-N + NH4-N) in clear-cuts increased 6 times after forest harvesting. Smolander et al. ([35]) and Mäkipää et al. ([24]) indicated that the main drivers of these processes are the intensive sunlight in the clear-cuts, the increased atmospheric precipitation, and higher soil temperatures, which accelerated the mineralization and nitrification of organic matter in the mineral soil. Additionally, it was assumed that evaluating soil microbial properties, such as SMBC and SMBN concentrations, their percentages in SOC and TN, the ratio of SMBC:SMBN, and microbial respiration, together with soil chemical indicators, allows for a more effective assessment of changes in SOC and TN indices. Significant differences in SMBC concentrations were observed in the 2nd- and 3rd-year clear-cuts, with values 1.2-1.4 times lower in the clear-cuts than in the forest. Meanwhile, the lower SMBN concentration was found only in the 0-10 cm layer of the 3rd-year clear-cuts compared to the forest.
The SMBC/SOC, SMBN/TN, and SMBC: SMBN were comparable in the 1st- and 3rd-year clear-cuts with the adjacent mature forest (Tab. 2). However, the SMBC/SOC and SMBN/TN were significantly higher in the 2nd-year clear-cuts than in the mature forest, except the SMBC/SOC in the 10-20 cm soil layer, which was higher in the forest. In contrast, the SMBC:SMBN ratio was higher in the mature forest than in the 2nd-year clear-cuts. Our findings also showed positive correlations between SOC, TN, SMBC, microbial CO2, and SOC:TN ratio, indicating efficient nutrient cycling in the Scots pine forests. The correlations between most of the parameters in the 1st-year clear-cuts were comparable to those obtained in the mature forests. However, some differences were specific to the 1st-year clear-cuts. For example, in 1st-year clear-cuts, stronger positive correlations were found between SMBC with TN, NO2-N and NH4-N, and stronger negative correlations between SOC and TN with SMBC/SOC and SMBN/TN. These trends suggest that microbial properties respond rapidly to clear-cutting.
In the 2nd-year clear-cuts, significant relationships were found between SMBN and N compounds (NO2-N and NH4-N), which were not observed in the mature forest. The SMBC:SMBN ratio positively correlated with SOC, N compounds (NO3-N, NO2-N, and NH4-N), SMBC, SMBN, and microbial CO2. Our findings also showed that in the third year after the clear-cut, changes in the N cycle contributed to a decrease in SMBN concentration, as indicated by the negative correlations between SMBN and TN, NO3-N, and NH4-N. These findings suggest that properties like SMBC and SMBN are suitable proxy of microbial activity useful for monitoring the dynamics of SOC and TN concentrations in the soil. Previous studies have demonstrated that the SMBC: SMBN ratio is a crucial indicator of soil nitrogen mineralization capacity and has a significant ecological impact on the carbon and nitrogen balance in soils ([30], [26]). Consequent-ly, when assessing SOC and TN stability in clear-cuts and forests, we recommend to consider parameters such as SMBC, SMBC: SMBN, and microbial CO2. These parameters provide valuable insights into the dynamics and retention in the soil of SOC and TN by the microbial biomass, and help monitoring soil ecosystem stability and resilience to disturbances. James & Harrison ([22]) reported that soil nutrient levels are influenced by soil type and may take several decades to stabilize. Mayer et al. ([25]) indicated that the stabilization process depends on the tree species being cultivated. Wan et al. ([40]) demonstrated that various forest management practices, including clear-cutting, resulted in significant changes to microbial properties, which were not reflected in commonly used soil indicators such as SOC, TN, pH, SOM, among others. Overall, the soil quality parameters analyzed in this study revealed a variable response to clear-cutting of mature Scots pine forests. These findings contribute to a better understanding of the influence of different forest ecosystem stages on key forest soil properties and provide insights into the importance of continuous forest management practices that combine intensive forest management with maintaining ecosystem stability.
The relatively short time frame analyzed in this study could be considered as one of its limitations. This underscores the necessity of extending such investigations over time, until the forest ecosystems have fully recovered from clear-cutting.
Conclusions
Soil organic carbon (SOC) concentration in the 0-10 cm layer and total nitrogen (TN) concentration in the 0-10 cm and 10-20 cm layers were significantly lower in the 1st- and 2nd-year clear-cuts than in the mature Scots pine forests. Significantly higher concentrations of the nitrate-nitrogen (NO3-N) were observed in both soil layers in the 1st- and 3rd-year clear-cut areas. While the concentrations of the nitrite-nitrogen (NO2-N) and ammonium-nitrate (NH4-N) were higher in the 0-10 cm layer in the 2nd-year clear-cuts, and both soil layers in the 3rd-year clear-cuts were higher than in the mature forests. These findings confirm a more intensive nitrification and mineralization processes after clear-cutting in Scots pine hemiboreal forests. SOC and TN stocks in the 0-10 cm and 10-20 cm layers were significantly lower in the 1st- and 3rd-year clear-cuts, except for the TN stock in the 3rd-year clear-cut plot, than in the mature forests, indicating the stabilization of these elements over time. Conversely, soil microbial properties and their relations with key soil parameters in the 2nd- and 3rd-year clear-cuts suggest instability, as indicated by the negative correlations between SMBN and the concentrations of SOC, TN, and SMBC in the 3rd-year clear-cuts. In the 0-10 cm soil layer, the concentrations of soil microbial biomass carbon (SMBC) in the 2nd- and 3rd-clear-cut areas, and microbial biomass nitrogen (SMBN) in the 3rd-clear-cut areas, were lower than in the mature forests, confirming the importance of forest ecosystems in supporting microbial activity and soil health. The SOC:TN and SMBC:SMBN ratios differed between mature forests and clear-cuts, indicating shifts in nutrient dynamics and microbial community structure due to dramatic changes in the forest ecosystem. Further long-term research should be conducted to deepen our understanding of soil properties, their interactions, and overall soil quality at various depths in reforested land following clear-cutting.
Data Availability
The original contributions presented in the study are included in the article; further inquiries can be directed to the corresponding author.
Author Contributions
MM, IVK and VS: conceptualization, data curation, investigation, methodology; MM and IVK: visualization; MM: writing - original draft; IVK and VS: writing - review & editing. All authors have read and agreed to the published version of the manuscript.
Acknowledgements
This work has been financially supported by the long-term research program “Sustainable Forestry and Global Changes”, implemented by the Lithuanian Research Centre for Agriculture and Forestry.
References
Gscholar
CrossRef | Gscholar
Gscholar
Gscholar
Gscholar
Gscholar
Gscholar
CrossRef | Gscholar
CrossRef | Gscholar
Gscholar
Gscholar
Authors’ Info
Authors’ Affiliation
Iveta Varnagiryte-Kabašinskiene 0000-0002-6733-5302
Vidas Stakenas 0000-0001-5553-9378
Lithuanian Research Centre for Agriculture and Forestry, Institute of Forestry, Liepu St. 1, Girionys, LT-53101, Kaunas distr. (Lithuania)
Corresponding author
Paper Info
Citation
Muraškiene M, Varnagiryte-Kabašinskiene I, Stakenas V (2025). The effect of clear-cut age on soil organic carbon and nitrogen indices in Scots pine (Pinus sylvestris L.) stands. iForest 18: 146-153. - doi: 10.3832/ifor4711-018
Academic Editor
Giorgio Alberti
Paper history
Received: Aug 19, 2024
Accepted: Feb 24, 2025
First online: Jun 09, 2025
Publication Date: Jun 30, 2025
Publication Time: 3.50 months
Copyright Information
© SISEF - The Italian Society of Silviculture and Forest Ecology 2025
Open Access
This article is distributed under the terms of the Creative Commons Attribution-Non Commercial 4.0 International (https://creativecommons.org/licenses/by-nc/4.0/), which permits unrestricted use, distribution, and reproduction in any medium, provided you give appropriate credit to the original author(s) and the source, provide a link to the Creative Commons license, and indicate if changes were made.

Web Metrics
Breakdown by View Type
Article Usage
Total Article Views: 8052
(from publication date up to now)
Breakdown by View Type
HTML Page Views: 3563
Abstract Page Views: 2145
PDF Downloads: 2088
Citation/Reference Downloads: 1
XML Downloads: 255
Web Metrics
Days since publication: 417
Overall contacts: 8052
Avg. contacts per week: 135.17
Article Citations
Article citations are based on data periodically collected from the Clarivate Web of Science web site
(last update: Jul 2026)
(No citations were found up to date. Please come back later)
Publication Metrics
by Dimensions ©
Articles citing this article
List of the papers citing this article based on CrossRef Cited-by.
Related Contents
iForest Similar Articles
Research Articles
Relationship between microbiological, physical, and chemical attributes of different soil types under Pinus taeda plantations in southern Brazil
vol. 17, pp. 29-35 (online: 28 February 2024)
Research Articles
Effects of tree species, stand age and land-use change on soil carbon and nitrogen stock rates in northwestern Turkey
vol. 9, pp. 165-170 (online: 18 June 2015)
Research Articles
Soil stoichiometry modulates effects of shrub encroachment on soil carbon concentration and stock in a subalpine grassland
vol. 13, pp. 65-72 (online: 07 February 2020)
Research Articles
Assessing the restoration of a seasonally flooded riparian forest through soil carbon and nitrogen cycling indicators and soil microbial communities
vol. 19, pp. 254-260 (online: 21 July 2026)
Short Communications
Is microbial biomass measurement by the chloroform fumigation extraction method biased by experimental addition of N and P?
vol. 14, pp. 408-412 (online: 04 September 2021)
Short Communications
Not all long-distance-exploration types of ectomycorrhizae are the same: differential accumulation of nitrogen and carbon in Scleroderma and Xerocomus in response to variations in soil fertility
vol. 14, pp. 48-52 (online: 18 January 2021)
Research Articles
Wood-soil interactions in soil bioengineering slope stabilization works
vol. 2, pp. 187-191 (online: 15 October 2009)
Research Articles
Seasonal dynamics of soil respiration and nitrification in three subtropical plantations in southern China
vol. 9, pp. 813-821 (online: 29 May 2016)
Research Articles
Thinning effects on soil and microbial respiration in a coppice-originated Carpinus betulus L. stand in Turkey
vol. 9, pp. 783-790 (online: 29 May 2016)
Research Articles
Soil C:N stoichiometry controls carbon sink partitioning between above-ground tree biomass and soil organic matter in high fertility forests
vol. 8, pp. 195-206 (online: 26 August 2014)
iForest Database Search
Search By Author
Search By Keyword
Google Scholar Search
Citing Articles
Search By Author
Search By Keywords
PubMed Search
Search By Author
Search By Keyword


