Soil stoichiometry modulates effects of shrub encroachment on soil carbon concentration and stock in a subalpine grassland
iForest - Biogeosciences and Forestry, Volume 13, Issue 1, Pages 65-72 (2020)
doi: https://doi.org/10.3832/ifor3091-012
Published: Feb 07, 2020 - Copyright © 2020 SISEF
Research Articles
Abstract
There is little information available on the mediating effects of soil nutrient stoichiometry and enzyme stoichiometry on soil carbon (C) during shrub encroachment and their contributions to changes in soil C. Here, we characterized the concentration and stock of soil organic carbon (SOC), inorganic carbon (SIC) and total carbon (STC) along the shrub encroachment sequence (SES). We constructed linkages between soil C and SES with soil nutrient stoichiometric ratios and C-, nitrogen- and phosphorus-acquiring enzyme stoichiometry ratios using structural equation modeling (SEM), and disentangled the contributions of the soil nutrient stoichiometric ratios and enzyme stoichiometric ratios to shaping SOC and SIC using redundancy analysis (RDA) and SEM. Results revealed that the increases in STC stock derived from the increases in both the SOC stock and the SIC stock. Soil stoichiometric ratios played a mediating role in structuring soil C over SES, the mediating pattern depended on soil stoichiometry types (nutrient stoichiometry or enzyme stoichiometry) and soil C types (SOC, SIC or STC). Soil nutrient stoichiometric ratios contributed more than soil enzyme stoichiometric ratios to the variation in SOC and STC, while the contributions of these two types of soil stoichiometric ratios to the variation in SIC changed with soil stoichiometry types. Soil nutrient stoichiometry had positive or negative or threshold effects on soil C, but soil enzyme stoichiometry had monotonously increasing effects on soil C. This study showed that the soil stoichiometry had modulatory effects on soil C during shrub encroachment in the subalpine grassland, China.
Keywords
Encroachment Succession, Soil Organic Carbon, Soil Inorganic Carbon, Soil Total Carbon, Nutrient Stoichiometry, Enzyme Stoichiometry, Mediating Effect, Relative Importance
Introduction
Shrub encroachment has been one of the most noticeable changes in land cover in global rangelands ([42]) over the past 150 years. Shrub encroachment decreases livestock production ([3]), reduces plant and faunal diversity ([21]), increases the fire risk, and reduces the ecosystem and cultural services ([32]), and reduces the overall quality of grassland. Shrub encroachment threatens food security ([3]), and grassland economy, especially subalpine economy ([32]). Furthermore, shrub encroachment is predicted to increase over the coming century ([41]).
The soil carbon (C) pool, including SOC (organic) and SIC (inorganic), is the largest terrestrial C pool ([23]), and represents approximately 1.9 times the total size of the atmospheric and biotic C pools ([22]). Any fluctuations in soil C may alter the global C budget and atmospheric CO2 concentrations ([6]). Numerous studies quantified the effects of plant encroachment on SOC at local ([4]), regional ([29], [1]) and global scales ([18]). Studies demonstrated that SOC was altered by shrub encroachment, with changes ranging from -50% to + 300% ([24]), with a positive average accumulation effect ([9]). These effects on SOC were regulated directly or indirectly by climate ([1]), vegetation traits ([4], [24], [8]) and soil conditions ([24]). However, little information is available on the effect of shrub encroachment on SIC and how shrub encroachment changes both the SOC and SIC pools.
A recent study revealed the nutrient stoichiometry regulated soil C cycling ([15]). Kirkby et al. ([20]) and Alberti et al. ([2]) showed that soil nutrient stoichiometry controlled the soil C sink, and Finn et al. ([11]) showed that soil nutrient stoichiometry controlled the transformation and retention of plant-derived organic matter. Our recent analysis model of SOC ([8]) showed that plant factors, especially plant species diversity, and soil nutrient factors were not as important as we expected for driving SOC stock. Instead, soil nutrient stoichiometry ratios contributed 58.14% of the variation in SOC stock ([8]). However, in that analysis model, the roles of soil extracellular enzymes and their stoichiometry were not examined. Soil extracellular enzymes activities (EEA) were shown to be the bottlenecks in carbon and nutrient acquisition ([28]). The stoichiometry of soil EEA could be linked to both resource availability and microbial metabolism ([38]), and could reflect the ability of enzymatic producers to utilize nutrients ([39], [46]). Therefore, soil EEA stoichiometry, could offer an improved understanding of the microbial mechanisms that drive C sequestration and decomposition ([31], [46]). In particular, both soil nutrient stoichiometry and the stoichiometry of soil C-, N- and P-acquiring enzymes are increasingly recognized as playing important roles in the dynamics of soil C ([17]). We hypothesized that soil stoichiometry, including soil nutrient stoichiometry and EEA stoichiometry could constitute an inherent link between shrub encroachment and soil C, thereby driving the dynamics of soil C. So far, however, no research has focused on this.
Further quantification of the scale of the controlling factors of SOC and SIC changes in relation to shrub encroachment could update our understanding of the encroachment process and its ecological impact on the carbon cycle. The objectives of this study were to: (1) partition the effect sizes of soil stoichiometry (nutrient ratios and EEA ratios) on SOC, SIC and STC concentrations and stocks; (2) corroborate if soil stoichiometry is a mediator in the process of shrub encroachment altering the concentrations and stocks of SOC, SIC and STC in abandoned subalpine grassland on the Yunnan-Guizhou plateau, China.
Materials and methods
Site description
The study area is located in a subalpine Eulalia pallens (Hackel) Kuntze grassland (26° 19′ 44″ N - 26° 19′ 49″ N, 106° 51′ 06″ E - 106° 51′ 09″, elevation around 1600 m a.s.l.) in Longli County, Guizhou Province on the Yunnan-Guizhou Plateau, China. The mean annual temperature is 14.7 °C, ranging from -3 °C in January to 35 °C in July. The mean annual precipitation is 1160 mm, of which nearly 85% occurs between April and October. E. pallens is distributed in Guizhou, Yunnan, Sichuan and Guangxi in China and in a small part of India ([12]). Haplic Alisols (FAO/UNESCO taxonomy, 1988) covers this area ([8]).
Experimental design, soil sampling and determination
The “space-for-time” substitution method used in this study was widely adopted for the study of successional changes in SOC and SIC ([25]) and soil stoichiometry ([17]). Analogous to a recent study ([50]), shrub encroachment succession was specially categorized as three stages (early-stage, mid-stage and late-stage) in our study. To minimize differences from non-stages sources, three plant community plots (5 × 5 m) that represented the above three stages were selected in a relatively narrow geographical range with almost same elevation (1610.2-1610.7 m a.s.l.). Our recent research concerning SES described the experimental design and sampling process in detail ([8]). Briefly, at the beginning of October 2017, we randomly selected three 1 × 1 m quadrats as three replicates in each plant community plot (5 × 5 m), clearing the leaf litter from each quadrat ([1]). Then, three cores were collected, pooled and homogenized based on a given soil depth, and large pieces of gravel and organic material were removed. Finally, a mixed soil sample as a replicate of a soil depth in a given plot was obtained. We thus obtained 27 soil samples [3 replicates × 3 soil depths (0-5, 5-10, 10-20 cm) × 3 SES]. One representative sub-sample was used for soil nutrient concentrations measurement, other sub-samples were used for soil EEA measurement. We used cutting rings (50 mm inner diameter, 50 mm height) to obtain 27 soil cores for determining soil bulk density. We used the assay methods described in Tab. S1 (Supplementary material) to determine soil bulk density (BD, g cm-3), the concentrations of SOC (SOCc, g kg-1), total nitrogen (TN, g kg-1), available nitrogen (AN, mg kg-1), total phosphorus (TP, mg kg-1), available phosphorus (AP, mg kg-1), available potassium (AK, mg kg-1), available calcium (ACa, mg kg-1) and available magnesium (AMg, mg kg-1 - [8]). SIC concentration (SICc, g kg-1) was determined by the HCl method ([23]) using a calcimeter (Calcimeter, Eijkelkamp, Netherlands). Soil sub-samples were transported under ice bags and stored at 4 °C until analysis. We used ELISA® Kits (Shanghai Enzyme-linked Biotechnology Co., Ltd., China) to assay the activities (μmol d-1 g-1 dry soil) of C-acquiring enzyme-glucosidase, N-acquiring enzyme-leucine aminopeptidase and N-acetyl glucosaminidase, and P-acquiring enzyme-acid phosphatase.
Data analyses
Soil nutrient stoichiometry was expressed as molar ratios ([48]), i.e., the ratio of soil OC and TN was expressed as OC:TN, the ratio of soil OC and TP was expressed as OC:TP, the ratio of soil TN and TP was expressed as TN:TP, the ratio of soil TC and TN was expressed as TC:TN, the ratio of soil TC and TP was expressed as TC:TP, the ratio of soil AN and AP was expressed as AN:AP, the ratio of soil AN and AK was expressed as AN:AK, the ratio of soil AN and ACa was expressed as AN:ACa, the ratio of soil AN and AMg was expressed as AN:AMg, the ratio of soil AP and AK was expressed as AP:AK, the ratio of soil AP and ACa was expressed as AP:ACa, the ratio of soil AP and AMg was expressed as AP:AMg. We used these ratios because they have been adopted in many studies ([17], [50]), and because a growing number of studies have confirmed that nutrient stoichiometry ratios constrain soil carbon dynamics ([2], [11]).
Soil EEA stoichiometry was expressed as ln (natural logarithm) ratios ([28], [46]), i.e., the ratio of the log-transformed C-acquiring enzyme activity and N-acquiring enzyme activity was expressed as lnEC:lnEN, the ratio of the log-transformed C-acquiring enzyme activity and P-acquiring enzyme activity was expressed as lnEC:lnEP, the ratio of the log-transformed N-acquiring enzyme activity and P-acquiring enzyme activity was expressed as lnEN:lnEP. We used these ratios in this study because there were stoichiometric relationships between the enzyme activities of the diverse functions responsible for C, N, and P mineralization ([46]).
STC stock (STCs), SOC stock (SOCs) and SIC stock (SICs) were calculated for each depth (0-5, 5-10, 10-20 cm) and for whole depth (0-20 cm) according to the formulas reported by Liu et al. ([25]), and expressed as kg m-2. Data were log10 transformed to fulfill normality and homogeneity of variance if required ([28], [34]). Both two-way ANOVA and one-way ANOVA were used with Duncan’s test at the threshold of α = 0.05. For two-way ANOVA, the effects of independent variables (SES and soil depth) on one dependent variable (STCs, SOCs or SICs, etc.) were tested by running the “Univariate” routine in the “General linear model” module of the package SPSS® Statistics ver. 25.0 (IBM, Armonk, NY, USA). Specially, the effect of fixed variable (SES or soil depth) on one dependent variable (STCs, SOCs or SICs, etc.) was tested by running the “one-way ANOVA test” routine in the “Compare Means” module of the SPSS Statistics package.
Redundancy analysis (RDA) was conducted to partition the portion of explained SOC, SIC or STC variation attributable to the significant soil nutrient stoichiometry and enzyme stoichiometry factors, which were picked by forward selections. The Monte Carlo permutation test with 999 runs was used to determine significance of RDA results ([8]).
Structural equation modeling (SEM) effectively distinguished specific cause and effect-linkages between observed variables ([35]), and was utilized to establish a link between shrub encroachment and soil C via soil nutrient stoichiometry ratios and enzyme stoichiometry ratios. The model was simplified to meet the T-rule ([13]), which specifies that the number of estimated parameters (this number in our study was 7 or 8) must be less than or equal to the number of known variances and covariances (this number in our study was 10). Jobson transformation was used to normalize data and minimize kurtosis before SEM. The Bollen-Stine bootstrap ([16]) with 1000 draws was used because of the small sample size. χ2/df, p value (χ2), comparative fit index (CFI), root mean square error of approximation (RMSEA) and standardized root mean square residual (SRMR) were used to test the SEM model fit. The model was good at 0 ≤ χ2/df ≤ 2, 0.05 < p ≤ 1, 0.97 ≤ Comparative Fit Index (CFI) ≤ 1, 0 ≤ Root Mean Square Error of Approximation (RMSEA) ≤ 0.05 and 0 ≤ Standardized Root Mean Square Residual (SRMR) ≤ 0.05 ([37]). Lower sample size-adjusted Bayesian Information Criterion (BIC) was utilized to judge which was the best-fitting model, with differences greater than 6 providing strong evidence that models were different. Regression model analysis was used to explore how the soil stoichiometry changes soil C.
Data transformation, RDA, SEM and Regression analysis were conducted in R version 3.4.4 (R Development Core Team, Vienna, Austria).
Results
Distribution of SOC, SIC and STC concentrations and stocks
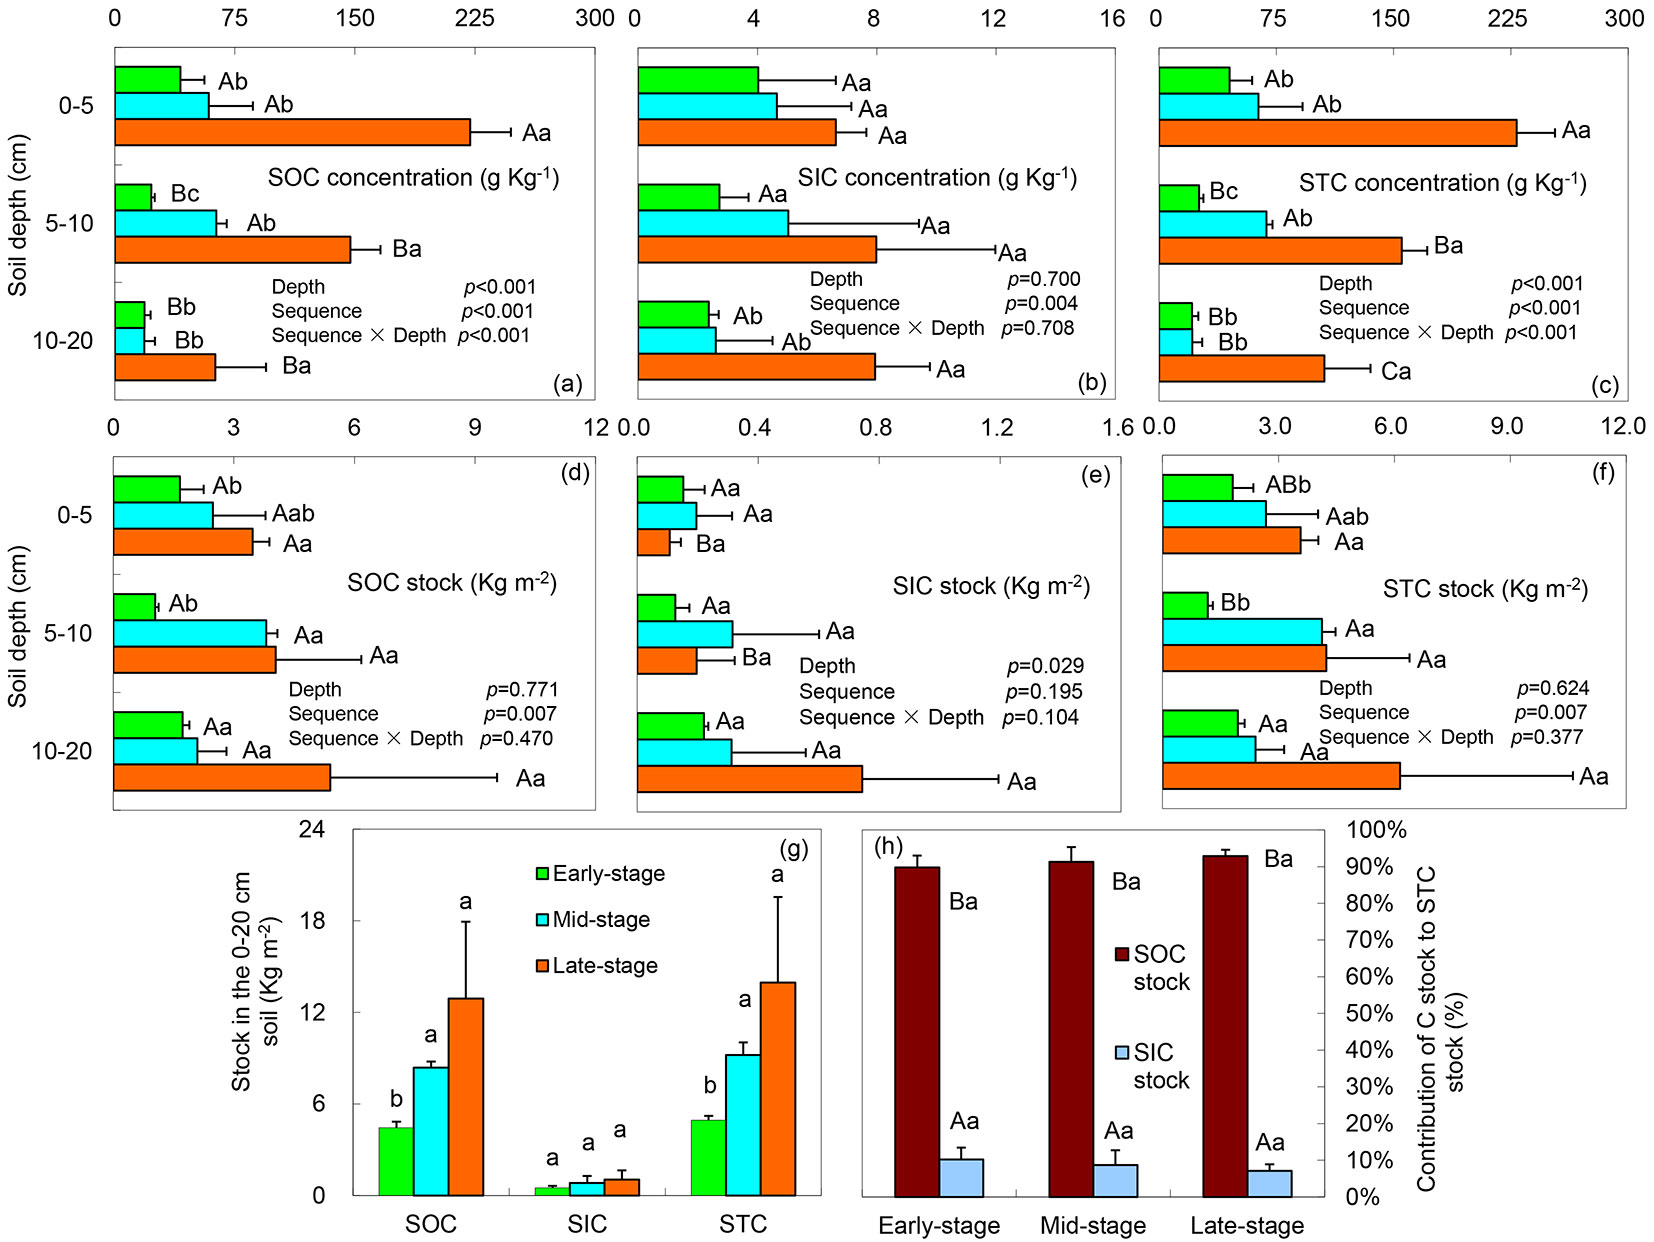
Soil stores approximately twice as much carbon as the atmosphere and fluctuations in the size of the soil carbon pool directly influence climatic conditions ([6]). Our data suggested that soil depth significantly changed the SOC concentration ([8]), STC concentration and SIC stock (ANOVA, p < 0.05) (Fig. 1a, Fig. 1c, Fig. 1e), but did not significantly change the SOC stock ([8]) and STC stock (ANOVA, p > 0.05 - Fig. 1d, Fig. 1f). Overall, the SOC concentration and STC concentration decreased with soil depth (Fig. 1a, Fig. 1c). SIC concentration decreased with soil depth only in the early-stage (Fig. 1b). Two-way ANOVA indicated that the SOC concentration ([8]) and STC concentration were significantly changed by SES, soil depth and interactions between these two (p < 0.001 - Fig. 1a-c). SOC stock ([8]) and STC stock (Fig. 1d, Fig. 1f) were significantly changed only by the SES. The SIC concentration was significantly changed by SES rather than by the soil depth (ANOVA, p < 0.01 - Fig. 1b), but the SIC stock showed the opposite (ANOVA, p < 0.05 - Fig. 1e). Overall, the SOC concentration, SIC concentration, STC concentration (Fig. 1a-c), SOC stock ([8]), and STC stock (Fig. 1d, Fig. 1f) increased with SES at each depth. The SIC stock increased only in the 10-20 cm depth (Fig. 1e). The SOC stock ([8]), SIC stock, and STC stock increased with SES across the entire depth (Fig. 1g). Although the increases in the STC stock with SES were derived from the increases in both the SOC stock and the SIC stock (Fig. 1g), the percentage contribution (Fig. 1h) showed that the SOC stock was the main C pool, the contribution of the SOC stock to the STC stock increased with SES, and the SIC stock showed an opposite trend, indicating that the change of STC stock might mainly derive from the change of SOC stock. However, the ANOVA stated that no statistical differences existed along the SES.
Fig. 1 - Distributions of SOC ([8]), SIC and STC concentrations and stocks, and contribution of SOC and SIC stocks to STC stock (mean ± standard deviation, n = 3). (a-f) Different capital letters at different depths in the same stage indicate significant differences (ANOVA), whereas (a-g) different lowercase letters at different stages of the same depth indicate significant differences (ANOVA). (h) Different capital letters in the same stage indicate significant differences (ANOVA), same lowercase letters at different stages indicate no significant differences (α = 0.05). (SOC): Soil organic carbon; (SIC): Soil inorganic carbon; (STC): Soil total carbon.
Soil nutrient stoichiometry and stoichiometry of C-, N- and P-acquiring enzymes
Soil nutrient stoichiometry ratios reflect the quality of soil nutrients and determine the microbial processes of soil carbon fate ([2]). Stoichiometry ratios of C-, N- and P-acquiring enzymes reflect the relative investment of soil microorganisms in acquiring C, N and P ([26]), and reveal stoichiometric and energetic constraints on microbial biomass growth ([44]). In this study, one-way ANOVA indicated that SES significantly changed both soil nutrient stoichiometry ([8]) and enzymes stoichiometry, except for the ratios of AP:AK and AP:AMg (p < 0.05 - Tab. 1), soil depth significantly changed the ratios of OC:TP, TN:TP, AN:AK, AN:AMg ([8]), TC:TP, lnEC:lnEN and lnEC:lnEP (p < 0.05 - Tab. 1). However, two-way ANOVA indicated that interactions between SES and soil depth had significant effects on the ratios of AN:AK ([8]), TC:TP and lnEC:lnEP (p < 0.05 - Tab. 1). The changes in these two kinds of stoichiometry ratios could have implications to soil C changes.
Tab. 1 - Results of two-way ANOVA for the effects of shrub encroachment sequence (SES) and soil depth on soil nutrient stoichiometry ([8]) and C-, N- and P-acquiring enzyme stoichiometry (mean ± standard deviation, n = 9). The number outside each bracket is the F value, the number inside each bracket is p value in ANOVA. The abbreviations are listed in the method section.
| Soil stoichiometry |
SES | Soil Depth | Interaction |
|---|---|---|---|
| OC: TN | 16.46 (0.000) | 1.71 (0.209) | 0.67 (0.619) |
| OC: TP | 7.36 (0.005) | 9.81 (0.001) | 1.43 (0.265) |
| TC: TN | 7.35 (0.005) | 0.56 (0.580) | 1.43 (0.266) |
| TC: TP | 23.45 (0.000) | 11.44 (0.001) | 3.20 (0.038) |
| TN: TP | 11.42 (0.001) | 9.82 (0.001) | 2.19 (0.111) |
| AN: AP | 4.08 (0.034) | 0.56 (0.579) | 0.33 (0.855) |
| AN: AK | 49.19 (0.000) | 12.27 (0.000) | 5.24 (0.006) |
| AN: ACa | 37.50 (0.000) | 2.51 (0.110) | 1.10 (0.386) |
| AN: AMg | 86.27 (0.000) | 10.41 (0.001) | 1.88 (0.157) |
| AP: AK | 0.58 (0.566) | 0.95 (0.404) | 1.38 (0.280) |
| AP: ACa | 4.51 (0.026) | 0.12 (0.885) | 1.12 (0.378) |
| AP: AMg | 1.52 (0.244) | 0.68 (0.517) | 0.87 (0.499) |
| lnEC: lnEN | 14.23 (0.000) | 6.67 (0.007) | 0.80 (0.541) |
| lnEC: lnEP | 72.78 (0.000) | 18.22 (0.000) | 3.38 (0.031) |
| lnEN: lnEP | 32.84 (0.000) | 2.18 (0.142) | 1.59 (0.220) |
Redundancy analysis
To understand the relative contributions of soil nutrient stoichiometry and stoichiometry of C-, N- and P-acquiring enzymes to change SOC, SIC and STC concentrations and stocks, RDA was used to quantify the effect size of soil stoichiometry ratios. Monte Carlo permutation tests showed RDA models and the first canonical axes were all highly significant (p = 0.001), indicating that all 15 stoichiometry factors (the ratios of OC:TN, OC:TP, TN:TP, TC:TN, TC:TP, AN:AP, AN:AK, AN:ACa, AN:AMg, AP:AK, AP:ACa, AP:AMg, lnEC:lnEN, lnEC: lnEP and lnEN:lnEP) were important in explaining the variation in concentrations and stocks of SOC, SIC and STC. After significant stoichiometry factors had been selected, the first canonical axes explained 95.88%, 47.27% and 95.31% of the variation in concentrations and stocks in SOC, SIC and STC, respectively. Variation partitioning (Tab. 2) showed that 39.20% of the variation in the SOC concentration and SOC stock was explained by the ratios of AN: ACa, AN:AK, AP:ACa and OC:TP, and that 14.60% of the variation in the SOC concentration and SOC stock was explained by the lnEN:lnEP ratio. We found that 32.80% of the variation in the STC concentration and STC stock was explained by the ratios of AN:AK, AN:ACa, AP:ACa and lnEN:lnEP; and 16.95% of the variation in the STC concentration and STC stock was explained by the lnEN:lnEP ratio. Up to 47.27% of the variation in SIC concentration and SIC stock was explained by the AN:AMg ratio alone.
Tab. 2 - Individual contributions of each significant soil nutrient stoichiometry and C-, N- and P-acquiring enzyme stoichiometry factors to the proportion of variation (%) explained in soil C in the three C types (n = 27). The number outside each bracket represents the portion of variation in soil C which is explained by the corresponding factor alone; the number inside each bracket is the p value; the interaction portion is the variation shared by significant factors; and the unexplained portion is the variation not attributed to significant factors. The abbreviations are listed in the method section. (VarSOC): proportion of variation explained in SOC concentration and SOC stock; (VarSiC): proportion of variation explained in SIC concentration and SIC stock; (VarSTC): proportion of variation explained in STC concentration and STC stock.
| Factors | VarSOC | VarSIC | VarSTC |
|---|---|---|---|
| OC: TP | 0.96 (0.032) | - | - |
| AN: AK | 3.41 (0.001) | - | 3.61 (0.001) |
| AN: ACa | 17.27 (0.001) | - | 26.59 (0.001) |
| AN: AMg | - | 47.27 (0.001) | - |
| AP: ACa | 2.96 (0.002) | - | 2.60 (0.001) |
| lnEN: lnEP | 14.60 (0.001) | - | 16.95 (0.001) |
| Interactions | 56.68 | - | 45.56 (0.001) |
| Unexplained | 4.12 | 52.73 | 4.69 |
Structural equation model
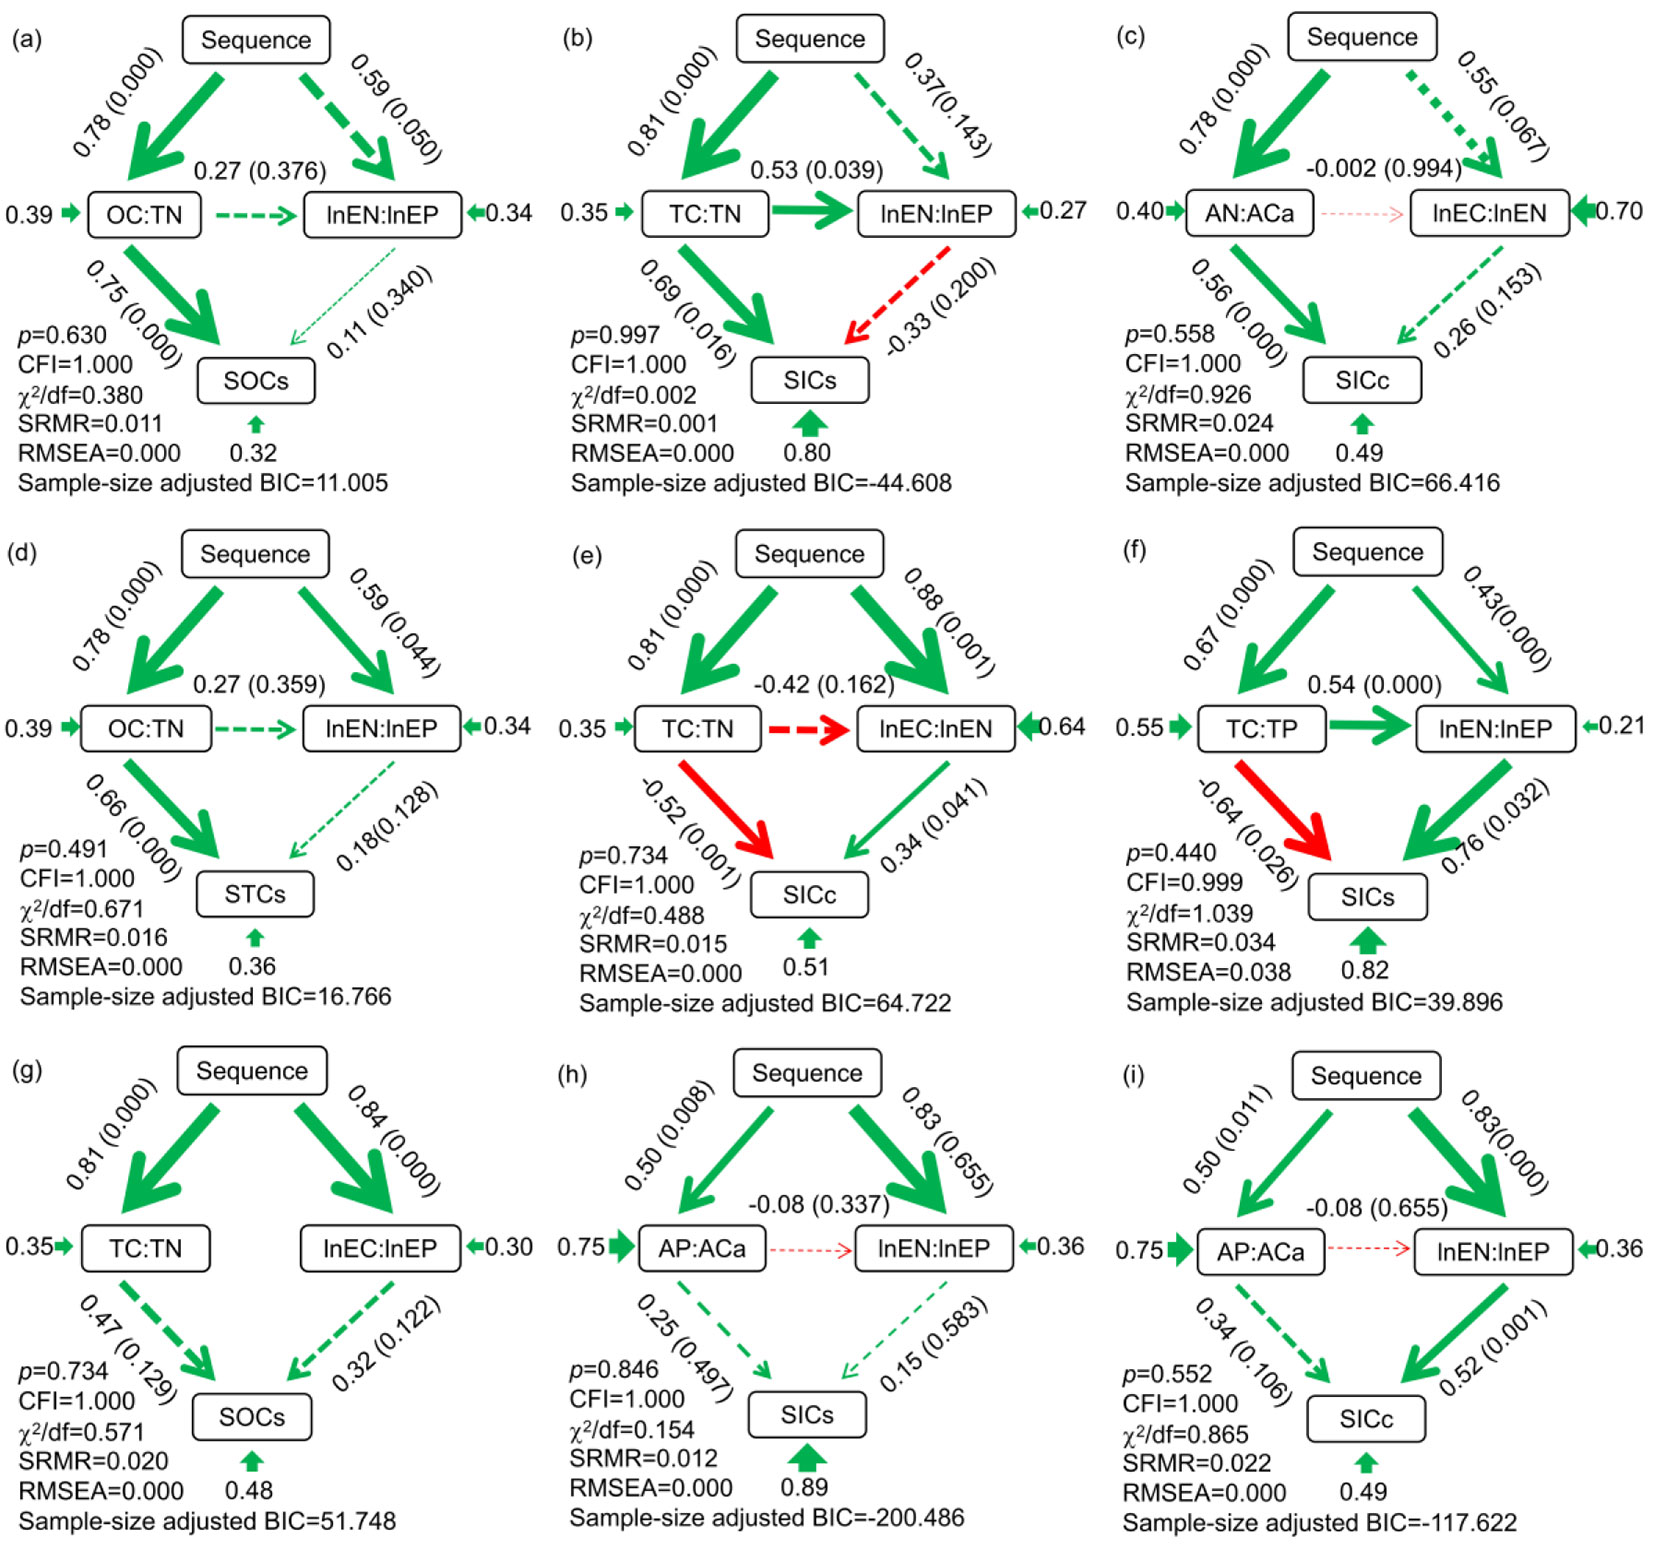
Based on our hypothesis, specific cause and effect-linkages were established. Model fit tests for 216 structural equation models showed that only 33 models could meet the criteria 0 ≤ χ2/df ≤ 2, 0.05 < p ≤ 1, 0.97 ≤ CFI ≤ 1, 0 ≤ RMSEA ≤ 0.05 and 0 ≤ SRMR ≤ 0.05 (Fig. 2 and Fig. S1 in Supplementary material), indicating the 33 models had a good fit. Well-fitted models for SOC concentration and STC concentration were not found, however, fitting models for SOC stock, STC stock, SIC concentration and SIC stock were found (Fig. 2 and Fig. S1 in Supplementary material). There were four different types of fitted model: (1) the significant pathway of soil nutrient stoichiometry (Fig. 2a-d, Fig. S1a-i). In this type of model, soil nutrient stoichiometry ratio was the only mediator that linked shrub encroachment sequence to soil carbon concentration or storage. Taking the model in Fig. 2a as an example, the OC:TN was the only mediator influenced by shrub encroachment sequence and transferred this influence to the SOC stock. (2) The significant pathway of soil C-, N- and P- acquiring enzyme stoichiometry (Fig. 2i, Fig. S1j-p). In this type of model, soil enzyme stoichiometry ratio was the only mediator that linked shrub encroachment sequence to soil carbon concentration or storage. Taking the model in Fig. 2i as an example, the lnEN:lnEP was the only mediator influenced by shrub encroachment sequence and delivered this influence to the SIC concentration. (3) The significant pathway of both soil nutrient stoichiometry and soil C-, N- and P-acquiring enzyme stoichiometry (Fig. 2e-f, Fig. S1q in Supplementary material). In this type of model, both soil nutrient stoichiometry ratio and soil enzyme stoichiometry ratio were the mediators that linked shrub encroachment sequence to soil carbon concentration or storage. But there were also differences in the effect direction and magnitude of the two mediators. Taking the model in Fig. 2e as an example, the TC:TN and the lnEC:lnEN were the mediators influenced by shrub encroachment sequence and conveyed these influence to the SIC concentration, but the TC:TN negatively and lnEC:lnEN positively affect the SIC concentration. (4) The insignificant pathway of both soil nutrient stoichiometry and soil C-, N- and P-acquiring enzyme stoichiometry (Fig. 2g-h, Fig. S1r-x in Supplementary material). In this type of model, both soil nutrient stoichiometry ratio and soil enzyme stoichiometry ratio could not link shrub encroachment sequence to soil carbon concentration or storage. The significance of these pathways indicated that there was a mediating mechanism of soil stoichiometry which facilitated the changes in soil C due to shrub encroachment.
Fig. 2 - Structural equation models showing SES effects on SOC, SIC and STC concentration and stock changes through hypothetical pathways of stoichiometry factors (n = 27). 0 ≤ c2/df ≤ 2, 0.05 < p ≤ 1, 0.97 ≤ CFI ≤ 1, 0 ≤ RMSEA ≤ 0.05 and 0 ≤ SRMR ≤ 0.05 indicate good models. Low sample size-adjusted Bayesian Information Criterion (BIC) indicates a better model. Solid lines show significant pathways (p < 0.05), dotted lines indicate non-significant pathways (p > 0.05), with line thickness representing the strength (coefficient) of the association between variables; green indicates positive coefficient (r); red indicates negative coefficient (r); and arrows indicate directionality. Alongside the arrow, the numbers outside the brackets are path coefficients; numbers inside the brackets are p-values. The numbers at the originating end of the arrow are R2 for error variables. Sequences indicate the shrub encroachment sequences from the early-stage to the late-stage. The abbreviations are listed in the method section.
Discussion
Soil stoichiometry regulates SOC, SIC and STC over shrub encroachment
Many factors, including ecological succession ([1], [9], [4], [32]), soil nutrient stoichiometry ([20], [2]) and soil EEA stoichiometry, could regulate soil C. The findings that shrub encroachment increased SOC stock (Fig. 1g - [9], [24]) and STC stock (Fig. 1g - [9]) have been widely reported, but the result that shrub encroachment increased SIC stock (Fig. 1g) was studied firstly, which could help better understand and manage the soil C pool.
A growing number of studies have concluded that soil stoichiometry exerted a substantial influence on soil C ([20], [11], [8]). Shifts in nutrient stoichiometry have been significantly associated with soil C dynamics ([15]). Our regression analysis suggested that soil nutrient stoichiometry drove SOC, SIC and STC (Fig. S2 in Supplementary material, panels 1-36). Based on the regression curve, not only we found the monotonously increasing or decreasing responses of soil C to soil nutrient stoichiometry (Fig. S2, panels 1-21), but also found the threshold responses of soil C to soil nutrient stoichiometry (Fig. S2, panels 22-36). For instance, when the OC:TN ratio < 6, the increasing OC:TN ratio increased the concentration of SIC, when the OC:TN ratio > 6, the increasing OC:TN ratio decreased the concentration of SIC (Fig.S2, panel 22); when the OC:TP ratio < 280, the increasing OC:TP ratio decreased the concentration of SOC and STC, and when the OC:TP ratio > 280, the increasing OC:TP ratio increased the concentration of SOC and STC (Fig.S2, panels 34-35). A hypothesis proposed in forest ecosystems could account for these observations ([2]). This hypothesis stated that the linkage between soil C:N stoichiometry and microbial activity controlled C sequestration belowground, and the ratio of aboveground net primary C production to gross primary C production increased with increasing soil C:N. Microbes activity (C use efficiency) controlled by stoichiometry determined whether SOC was lost to the atmosphere as carbon dioxide, or incorporated into microbial biomass, which promoted C stabilization. High C use efficiency values of microbes indicated their efficient growth, whereas low values implied relatively greater losses of C through respiration ([30]). Low soil C:N (below 17.5 on a mol basis - [8]) induced high C use efficiency of microbes, where more of the fresh C input was thus used for microbial biomass products, resulting in the net formation of new SOM (soil organic matter), and this, in turn, resulted in the increase of SOC stock with soil OC:TN (Fig. 2a, Fig. S1a-b in Supplementary material). Since the change of STC stock was mainly derived from the change of SOC stock (Fig. 1h), STC stock also increased with soil OC:TN (Fig. 2d, Fig. S1h-i). However, when soil C:N was high, microbes had a low C use efficiency and therefore they respired more of the fresh C inputs and prime SOM decomposition, which increased N availability and supported a higher allocation of gross primary C production to aboveground net primary C production. Interestingly, the general rule described by Paul ([33]) suggested that the OC:TP ratio < 516 stimulated a net mineralization and the OC:TP ratio between 516 and 775 stimulated little change in the soluble P concentrations. Our data showed the OC:TP ratio ranged from 204 to 477 in the three soil depths in the early- and mid-stages, and the OC:TP ratio of 362 in the deepest soil depth in the late-stage, stimulated net mineralization of nutrients. However, the OC:TP ratio ranged from 517 to 668 in the top two soil depths in the late-stage, stimulated little change of the soluble P concentrations. P was the limiting element in our study land ([8]). In the late-stage, this situation of OC:TP was conducive to reducing soil phosphorus loss in this high rainfall area, providing some P from deeper soil for shrubs, which reduced soil phosphorus limitation of shrubs, thereby increasing soil carbon (Fig. S2, panels 19-34). These results confirmed previous findings ([4], [8]).
Our data clearly showed that soil C-, N- and P-acquiring enzymes stoichiometry ranged from 0.9 to 1.6, and did not converge on 1, indicating that soil C-, N- and P-acquiring enzymes stoichiometry was not in homeostasis ([34]). In fact, climatic, edaphic abiotic factors and biotic factors significantly impacted soil C-, N- and P-acquiring enzymes stoichiometry ([34]). We grouped the underlying mechanisms of SES control over soil C-, N- and P-acquiring enzymes stoichiometry ratios into six pathways that can operate simultaneously, as follows: (1) Climate regulation ([44]). Based on global soils, Sinsabaugh et al. ([39]) found that the lnEC:lnEP was inversely related to mean annual precipitation and temperature, while the lnEC:lnEN increased with mean annual precipitation. However, across tropical soils, Waring et al. ([44]) suggested that lnEC:lnEP was positively associated with mean annual temperature. Conversely, across forest ecosystems along the North-South Transect in eastern China, Xu et al. ([46]) found that the lnEC:lnEN, lnEC:lnEP and lnEN:lnEP were significantly and negatively related to mean annual precipitation and temperature. These correlations between soil enzymes stoichiometry ratios and mean annual temperature and precipitation suggested climatic regulated soil enzymes stoichiometry ratios; climate might regulate the effect of SES on soil C-, N- and P-acquiring enzymes stoichiometry ratios. (2) Effects of encroaching plant traits. A recent study found that plants played a more crucial role than soil properties in determining enzymatic stoichiometry which was substantially affected by root systems ([7]). Shrub encroachment shifted plants from herbaceous and grass to shrub, and changed the root systems, including distribution ([18], [36]) and quality, thereby changing enzymatic stoichiometry. (3) Effects of soil physical properties. A recent study in the arid area of Loess Plateau, China found that soil physical properties (e.g., soil moisture, silt and clay contents) had more contribution to soil C-, N- and P-acquiring enzymes stoichiometry than the other investigated soil parameters ([7]), which suggested that the soil physical properties were the most influential factors on enzymes stoichiometry. (4) The nutrient-dependent response of soil enzyme stoichiometry. Peng & Wang ([34]) found that soil total C, N and P contents accounted for the highest percentage of variation in soil C-, N- and P-acquiring enzymes stoichiometry, indicating soil enzyme stoichiometry changes depended on the variation in nutrient availability ([19]). (5) Soil enzymatic stoichiometry ratios reflected the biogeochemical equilibrium between metabolic and element requirements (biomass elemental ratios) of microbial assemblages and the relative availability of soil nutrients ([38], [34]). Peng & Wang ([34]) found that the ratio of C-acquiring enzymes to P-acquiring enzymes and the ratio of N-acquiring enzymes to P-acquiring enzymes were positively related to soil microbial biomass C, N, and P, as well as negatively related to the ratio of soil microbial biomass C to soil microbial biomass N and the ratio of soil microbial biomass N to soil microbial biomass P. Soil enzymatic stoichiometry therefore was dependent on soil microbial biomass elemental stoichiometry. (6) Soil nutrient stoichiometry controls. Recently, Xu et al. ([46]) found the lnEC:lnEP and lnEN:lnEP were adversely affected by soil C:P and N:P ratios. Waring et al. ([44]) found that lnEC: lnEP were adversely affected by soil C:N ratio. Our SEMs showed that soil nutrient stoichiometry ratios increased soil enzymatic stoichiometry ratios (Fig. 2b, Fig. 2f, Fig.S1s and Fig.S3, panels 1-23), therefore confirming soil nutrient stoichiometry controlled enzyme stoichiometry ([34], [46]). Additionally, our models clearly showed that the increased soil TC:TP caused by shrub encroachment increased the lnEN:lnEP (Fig. 2f and Fig. S3 in Supplementary material, panel 23), and consequently increased SIC stock (Fig. 2f). This pathway has never been reported in previous studies, thus providing a new understanding of the pathway that impacts SIC.
Previous studies reported that the activities of C-, N- and P-acquiring enzymes were positively related to SOC ([5]). Soil EEA stoichiometry connected the elemental stoichiometry of microbial biomass and SOM to microbial nutrient assimilation and growth ([40]). Interestingly, similar to soil nutrient stoichiometry, soil C-, N- and P-acquiring enzymes stoichiometry increased not only the concentration and stock of SOC, but also the concentration of SIC and the concentration and stock of STC (Fig. S2, panels 37-49). In general, SOC dynamics was thought to be biological processes, while SIC dynamics reflects physical and chemical processes ([49]). However, little information was available on the relationship between soil enzyme stoichiometry and SIC. Our study showed soil C-, N- and P-acquiring enzymes stoichiometry monotonously increased SIC concentration (Fig. S2; panels 38, 41, and 46). These findings have improved our understanding of soil C-, N- and P-acquiring enzymes stoichiometry and SIC. However, the underlying mechanism remains unexplored. We speculated that the linkage between SIC and SOC could be a potential mechanism due to the transformations between SOC and SIC ([23]). SOC concentration significantly increased SIC concentration (Fig. S4 in Supplementary material), possibly supporting this hypothesis.
Soil C and SES are connected by soil stoichiometry
Stoichiometry facilitates for spanning different levels of biological organization, from cellular metabolism to ecosystem structure and nutrient cycling, and it is therefore particularly useful to establish links between different ecosystem compartments ([48]). We therefore proposed the mechanistic links. In fact, our results showed that the soil C and SES are strongly connected by mediating roles of soil stoichiometry (including soil nutrient stoichiometry ratios and enzyme stoichiometry ratios), and the mediating pattern depended on soil stoichiometry species and soil C types (concentration and stock of SOC, SIC and STC - Fig. 2). The diversity of linkage patterns revealed the complexity of the stoichiometry factors controlling SOC, SIC and STC over SES, and highlighted the importance of this work.
Previous studies have found shrub encroachment altered soil stoichiometry ([10]), and changes in soil nutrients stoichiometry were significantly related to soil C dynamics ([15]), but changes in soil EEA ratios were poorly correlated with changes in soil C pools ([28]). Our study found many details that have not been previously reported. For SOC stock, SES increased SOC stock by increasing soil nutrient stoichiometry (e.g., OC:TN - Fig. 2a). SES changed SIC concentration via: (i) the improved TC:TN ratio decreased the SIC concentration (Fig. 2e); and (ii) the elevated AN:ACa, lnEC:lnEN and lnEN:lnEP ratio increased the SIC concentration (Fig. 2c, Fig. 2e, Fig. 2i). SIC stock was changed by SES because: (i) the increased TC:TN and lnEN:lnEP ratio increased the SIC stock (Fig. 2b, Fig. 2f); and (ii) the increased TC:TP ratio decreased SIC stock (Fig. 2f). Further, both SIC concentration and SIC stock showed an increasing trend (Fig. 1b, Fig. 1g), indicating that the effect of increase exceeded the effect of decrease.
Interestingly, the effects of the same soil stoichiometry ratios on SIC differed between concentration and stock (Fig. 2b vs. Fig. 2e and Fig. 2h vs. Fig. 2i). The classic carbonate-bicarbonate reaction equation widely reported ([45], [23]) showed that the increased cations (Ca2+ and Mg2+) increased SIC ([14]), but the increased AN reduced Ca2+ and Mg2+ ([27]). Furthermore, shrub provided more Ca2+ ([49]) and Mg2+ ([43]) than grass via litter. The AN:ACa in SEM (Fig. 2c), the AN:AMg in RDA (Tab. 2) and the AN:AMg, AP:ACa, AN:ACa in the regression model (Fig. S2; panels 3, 32-33) therefore had a marked impact on SIC concentration and/ or stock. The pathways were similar where SES affected STC stock and SOC stock (Fig. 2a, Fig. 2d), possibly because of the large proportion (> 85%) of SOC stock in STC stock (Fig. 2h). In addition, unexplained variation (from 32% to 89%) in some SEMs could be contributed by the soil stoichiometry ratios included in other SEMs (Fig. 2) and the factors not covered by this study. For instance, soil bulk density ([47]) decreased SOC concentration but increased SIC concentration; soil nutrient (e.g., N, P, K) increased SOC stock ([20], [23], [24], [6]) and even SIC increased with SOC (Fig. S4 - [14]).
Collectively, our analysis provided a new insight into the SOC, SIC and STC changes caused by shrub encroachment via the pathway of soil nutrient stoichiometry and enzymes stoichiometry, further enlightened that management practices of soil nutrient stoichiometry and enzymes stoichiometry to stabilize and increase SOC and SIC would play an important role in local carbon cycles.
Contribution of significant soil stoichiometry factors to SOC, SIC and STC
Although all 15 soil stoichiometry factors were important in explaining the variation in content and stock of SOC, SIC and STC, RDA and SEM revealed that soil nutrient stoichiometry was more important than soil enzyme stoichiometry for changes in SOC and STC. In the RDA, significant soil nutrient stoichiometry clearly explained a greater proportion of the variations in SOC, SIC and STC than soil enzyme stoichiometry (Tab. 2). Also, in the SEM, the square path coefficients of soil nutrient stoichiometry were greater than those of soil enzyme stoichiometry (Fig. 2a, Fig. 2d), indicating that soil nutrient stoichiometry exerted a greater influence on SOC and STC stocks than soil enzyme stoichiometry. Three different pathway models for SIC concentration and SIC stock indicated that both soil nutrient stoichiometry and soil enzyme stoichiometry were of importance in changing SIC concentration and SIC stock (Fig. 2b,c; Fig. 2e,f; Fig. 2i), while their relative importance depended on soil stoichiometry species (Fig. 2c vs. Fig. 2e, Fig. 2b vs. Fig. 2f). In addition, the interactions explained the largest variation in SOC and STC in this study (Tab. 2). The AN:ACa explained the secondary variation in SOC and STC, and the lnEN:lnEP explained the tertiary one. However, the underlying mechanism still needs to be elucidated.
Conclusions
This study underscored the importance of soil stoichiometry in changing the content and stock of SOC, SIC and STC during the process of shrub encroachment. To our knowledge, this study is the first to show that the soil stoichiometry, including soil nutrient stoichiometry and enzyme stoichiometry, constituted an inherent link between SES and soil C. Also, this study is the first to find that the linkage pattern depended on soil stoichiometry species and soil C types. Soil nutrient stoichiometry was more important than soil enzyme stoichiometry in changing SOC and STC due to shrub encroachment, while the relative importance of these two types of soil stoichiometry in changing SIC depended on soil stoichiometry species. Soil nutrient stoichiometry had the positive or negative or threshold effects on soil C, but soil C-, N- and P-acquiring enzymes stoichiometry had the monotonously increasing effects on soil C. Our results have improved to some extent the understanding of the effects of soil stoichiometry on soil C.
Acknowledgements
This work was financially supported by the China National Natural Science Foundation (grant no. 31602005), a key project of Guizhou province Natural Science Foundation (Qiankehejichu [2018] 1419), Science and Technology Innovation Talent Team Construction project (Qiankehepingtairencai [2016] 5617), Youth fund of Guizhou Academy of Agricultural Sciences (Qiannongkeyuanqingnianjijin [2018] 12) and Guizhou Province Science and Technology Program Project (Qiankehezhicheng [2017] 2586). The Foundation took no part in study design; in the collection, analysis and interpretation of data; in the writing of the report; or in the decision to submit the article for publication. Gained funding, conceived and designed the experiments: PW. Performed the experiments: LD PW YZ SL XW YJZ YF. Analyzed the data: LD PW WZ. Wrote the draft: LD. Reviewed & edited the draft: PW LD YZ XC SL XW YJZ YF. We thank International Science Editing and Liwen Bianji, Edanz Editing for editing the English text of a draft of this manuscript. We also thank an anonymous reviewer for her/his comments which substantially improved this manuscript.
References
CrossRef | Gscholar
CrossRef | Gscholar
CrossRef | Gscholar
Gscholar
CrossRef | Gscholar
Gscholar
Authors’ Info
Authors’ Affiliation
Puchang Wang 0000-0002-2694-4056
Wen Zhang
Yu Zhang
Shige Li
Xin Wei
Xi Chen
Yujun Zhang
Guizhou Institution of Prataculture, Guizhou Academy of Agricultural Sciences, Guiyang 550006, Guizhou (China)
Fuli Yang
College of Animal Science, Guizhou University, Guiyang, Guizhou (China)
Corresponding author
Paper Info
Citation
Ding L, Wang P, Zhang W, Zhang Y, Li S, Wei X, Chen X, Zhang Y, Yang F (2020). Soil stoichiometry modulates effects of shrub encroachment on soil carbon concentration and stock in a subalpine grassland. iForest 13: 65-72. - doi: 10.3832/ifor3091-012
Academic Editor
Emilia Allevato
Paper history
Received: Mar 08, 2019
Accepted: Nov 29, 2019
First online: Feb 07, 2020
Publication Date: Feb 29, 2020
Publication Time: 2.33 months
Copyright Information
© SISEF - The Italian Society of Silviculture and Forest Ecology 2020
Open Access
This article is distributed under the terms of the Creative Commons Attribution-Non Commercial 4.0 International (https://creativecommons.org/licenses/by-nc/4.0/), which permits unrestricted use, distribution, and reproduction in any medium, provided you give appropriate credit to the original author(s) and the source, provide a link to the Creative Commons license, and indicate if changes were made.

Web Metrics
Breakdown by View Type
Article Usage
Total Article Views: 46644
(from publication date up to now)
Breakdown by View Type
HTML Page Views: 37070
Abstract Page Views: 5397
PDF Downloads: 3360
Citation/Reference Downloads: 4
XML Downloads: 813
Web Metrics
Days since publication: 2327
Overall contacts: 46644
Avg. contacts per week: 140.31
Article Citations
Article citations are based on data periodically collected from the Clarivate Web of Science web site
(last update: Mar 2025)
Total number of cites (since 2020): 10
Average cites per year: 1.67
Publication Metrics
by Dimensions ©
Articles citing this article
List of the papers citing this article based on CrossRef Cited-by.
Related Contents
iForest Similar Articles
Research Articles
Soil C:N stoichiometry controls carbon sink partitioning between above-ground tree biomass and soil organic matter in high fertility forests
vol. 8, pp. 195-206 (online: 26 August 2014)
Research Articles
The effect of clear-cut age on soil organic carbon and nitrogen indices in Scots pine (Pinus sylvestris L.) stands
vol. 18, pp. 146-153 (online: 09 June 2025)
Research Articles
Potential relationships of selected abiotic variables, chemical elements and stand characteristics with soil organic carbon in spruce and beech stands
vol. 14, pp. 320-328 (online: 09 July 2021)
Research Articles
Effects of tree species, stand age and land-use change on soil carbon and nitrogen stock rates in northwestern Turkey
vol. 9, pp. 165-170 (online: 18 June 2015)
Research Articles
Estimating changes in soil organic carbon storage due to land use changes using a modified calculation method
vol. 8, pp. 45-52 (online: 17 June 2014)
Short Communications
Shrub encroachment alters topsoil C:N:P stoichiometric ratios in a high-altitude forest cutover
vol. 11, pp. 594-599 (online: 25 September 2018)
Research Articles
Impact of deforestation on the soil physical and chemical attributes, and humic fraction of organic matter in dry environments in Brazil
vol. 15, pp. 465-475 (online: 18 November 2022)
Research Articles
Patterns of carbon allocation in a chronosequence of Caragana intermedia plantations in the Qinghai-Tibet Plateau
vol. 8, pp. 756-764 (online: 08 April 2015)
Short Communications
Variation in soil carbon stock and nutrient content in sand dunes after afforestation by Prosopis juliflora in the Khuzestan province (Iran)
vol. 10, pp. 585-589 (online: 08 May 2017)
Research Articles
Effects on soil characteristics by different management regimes with root sucker generated hybrid aspen (Populus tremula L. × P. tremuloides Michx.) on abandoned agricultural land
vol. 11, pp. 619-627 (online: 04 October 2018)
iForest Database Search
Google Scholar Search
Citing Articles
Search By Author
Search By Keywords


