Seasonal change in soil nitrogen mineralization in young Chamaecyparis obtusa stands at the upper and lower positions on a slope in central Japan
iForest - Biogeosciences and Forestry, Volume 18, Issue 4, Pages 197-201 (2025)
doi: https://doi.org/10.3832/ifor4710-018
Published: Jul 20, 2025 - Copyright © 2025 SISEF
Short Communications
Abstract
Nitrogen (N) is a critical element for tree growth in forest ecosystems. As trees absorb inorganic N, the soil N mineralization process is a key process for their development. Although the spatial pattern of soil N mineralization is expected to relate to tree growth, the difference between the upper and lower positions within a small-scale slope is unclear. Therefore, we compared annual and seasonal soil N mineralization rates in Japanese cypress (Chamaecyparis obtusa [Siebold & Zucc.] Endl.), which stands at both the upper and lower positions on a slope. We used the resin-core method to estimate in situ soil N mineralization rates. Additionally, the litter decomposition rate and inorganic N passed through the litter layer, which are primary sources for soil N mineralization, were investigated using the litter bag and resin-core methods. Our findings revealed that the annual soil N mineralization rate at the lower position was 5 times higher than that at the upper position. Moreover, seasonal variations in soil N mineralization rate tended to be higher at the lower position than at the upper position. The temporal change in input ammonium passed through the litter layer was similar to that of the nitrification rate in the soil at the lower position, except for winter. Notably, high nitrification in winter at the lower position may be related to soil frost, which can accelerate the decomposition of organic matter. Despite these differences, the litter decomposition rate was similar between the slope positions. The higher soil N mineralization rate and substrate input may result in higher tree growth at the lower position on a slope.
Keywords
Soil Nitrogen Mineralization, Field Soil Incubation, Chamaecyparis obtusa, Resin Core Method
Introduction
Nitrogen (N) and soil water are limiting factors for tree growth ([5], [3], [17]). The availability of N in the soil is considered a significant indicator of tree growth ([12]). Although the spatial pattern of soil N mineralization rate is expected to be linked to tree growth, their relationship within a small-scale slope is unclear.
In situ soil incubation methods aim to capture the effect of natural environmental fluctuations on mineralization ([4], [2], [6]). Generally, the rate of soil N mineralization varies with soil temperature, moisture, and substrate quantity and quality ([21]). Since the moisture environment drastically changes on a small scale on a slope ([19]), capturing moisture fluctuations is necessary. The resin-core method places soil between ion-exchange resins, which allow water input into the soil and output from the soil without N contamination ([2]). It can also evaluate the amount of substrates input into the soil by the upper resin.
Here, we evaluate annual and seasonal changes in soil N mineralization rate using the resin-core method at the upper and lower positions on a slope. Additionally, the litter decomposition rate and nitrogen input into the soil were evaluated.
Methods
Study site
The study was conducted at the Terasawa-yama station (Education and Research Center of Alpine Field Science, Shinshu University, Nagano prefecture, Japan). The mean annual air temperature and precipitation during 2006-2010 were 9.0 °C and 1479.4 mm, respectively ([13], [14]).
We established plots on a slope in a young Japanese cypress (Chamaecyparis obtusa, hereafter hinoki) forest (planted in 1985 - Tab. 1). The study site is located at an altitude of 1080 to 1140 m a.s.l., in the east-northeastern direction, with an average slope angle of 35°. The bedrock is weathered granite. The hinoki stands were planted at a density of 3.500 trees ha-1 and maintained at 2.600-2.900 trees ha-1 after non-commercial cutting.
Tab. 1 - Hinoki cypress growth at the upper and lower plots. Values indicate mean ± standard deviation. The p-value indicates the result of the t-test. The number of trees measured was 42 and 47 in the upper and the lower plot, respectively.
| Parameter | Upper plot | Lower plot | p-value |
|---|---|---|---|
| Height (m) | 9.3 ± 0.9 | 11.7 ± 2.8 | < 0.05 |
| Diameter of breast height (cm) | 11.7 ± 1.5 | 12.8 ± 2.0 | < 0.05 |
| D2H (m3) | 0.13 ± 0.04 | 0.20 ± 0.08 | < 0.05 |
The plot (height 8 m and width 20 m) was established at the middle and bottom of the slope (hereafter upper and lower plots, respectively). The horizontal separation between the two plots is 80 m (Fig. 1). According to the Japanese local soil classification, the soil is classified as semidried Brown forest soil (BD(d)) and moderate Brown forest soil (BD - [15]), respectively. The BD soil corresponds to Cambisols in the international classification ([11]). Litter layer was found on the upper plot but not on the lower plot. The soil in the upper plot was poorer and more acidic, with lower soil N content and pH as well as a higher C/N ratio, compared to the soil in the lower plot (Tab. 2).
Fig. 1 - Location of the plots along a small-scale slope in the Hinoki cypress study stand. The figure is based on Hosokawa et al. ([9]).

Tab. 2 - Soil chemical properties at the two plots. Values indicate the mean ± standard deviation. Data from Hosokawa et al. ([9]).
| Plot position | Depth (cm) |
pH (H2O) |
pH (KCl) |
C (gC kg-1) |
N (gN kg-1) |
C/N ratio |
|---|---|---|---|---|---|---|
| Upper plot | 0-5 | 4.68 ± 0.02 | 3.61 ± 0.02 | 48.3 | 3.3 | 14.6 |
| 20-25 | 5.05 ± 0.02 | 4.18 ± 0.03 | 40.0 | 2.6 | 15.4 | |
| Lower plot | 0-5 | 5.30 ± 0.09 | 4.05 ± 0.02 | 43.5 | 4.1 | 10.6 |
| 20-25 | 5.56 ± 0.08 | 4.42 ± 0.02 | 32.1 | 3.1 | 10.4 |
Soil environment
The soil temperature was measured at 5 and 25 cm depths using a thermometer (TR-5220®, T & D Ltd., Matsumoto, Japan). The soil water potential at depths of 20 and 35 cm was measured using a tension meter (KDC-S5, Kona System Ltd., Sapporo, Japan) in 2010.
Soil N mineralization rate
The resin core method ([2]) was used to measure soil N mineralization and the inorganic N passing through the litter layer (hereafter referred to as input N). First, a 100 cm3 polyvinyl chloride column (diameter 2.5 cm, height 5 cm) was used to collect mineral soil from three depths (0-5, 20-25, and 50-55 cm). Second, an ion exchange column was attached to the upper and lower sides of the column. Finally, the columns were buried back in the ground. The ion exchange resin was a mixture of 20 g of cation exchange resin (Amberite IR-120B, Organo, Tokyo, Japan) and anion exchange resin (Amberite IRA-410, Organo, Tokyo, Japan). The 0-5 cm resin core was buried to the same depth as the soil surface and covered with the litter layer. The resin cores measuring 20-25 cm and 50-55 cm were buried at the same depth from which they were collected. The soil incubation was conducted from 2011 to 2012. The 0-5 and 20-25 cm resin cores were used to detect seasonal change and annual soil N mineralization. The 50-55 cm resin core was used to estimate annual soil N mineralization. Each incubation had three replications.
When the incubation finished, the soils were passed through a 2 mm sieve to remove coarse detritus and gravel. The soil and the ion exchange resin were extracted by 2 M KCl and 1M KCl, respectively. The extract was frozen until the chemical analysis was completed. A flow injection analyzer was used to test ammonium and nitrate (Quatro 2HR®, BL-Tech, Osaka, Japan).
The mineralization in soil N during a given period (mg N kg-1 period-1) was calculated as follows (eqn. 1):
where Nm is the N mineralization over time, Sa is the inorganic N in the soil column at the end of the incubation, Ra is the inorganic N in the bottom resin column at the end of the incubation, and Si is the inorganic N in the soil at the start of the incubation. The soil N mineralization rate (mg N kg-1 day-1) was the ratio of soil N during a given period and its incubation days.
Litter decomposition
In November 2010, we collected fresh leaf litter at the upper and lower plots. For the litter decomposition experiment, 6 g of air-dried hinoki leaf litter was placed in a square bag (20 × 20 cm). The litter collected from the upper plot was placed on the upper plot, and the litter collected from the lower plot was placed on the lower plot. The initial carbon (C) and N contents in the leaf litter from the upper plot were significantly lower than that from the lower plot, and the C/N ratio of leaf litter from the upper plot was significantly higher than that from the lower plot (t-test - total C: 62.2 ± 0.14% and 62.6 ± 0.15%; total N: 0.52 ± 0.01% and 0.76 ± 0.01%; C/N ratio: 120 ± 1.79 and 82.4 ± 0.83, respectively). In February 2011, the litter bag was placed on the plot and collected after 79, 161, 224, 317, 444 days. The litter samples were dried for 48 hours at 75 °C, and weighed. The dry combustion method was used to determine total C and N. The ash contents of the litter were determined by measuring ignition loss at 880 °C, and the organic matter and amount of C or N were calculated as follows (eqn. 2 to eqn. 4):
where MO is the organic matter content, MT is the total litter content, MR is the residue content (including ash and dust), MC and MN are carbon and nitrogen contents, respectively, CC and CN are carbon and nitrogen concentration, respectively.
Because a significant amount of soil adhered to the litter samples from the lower plot, we calculated the organic matter content by subtracting the ash from the total weight.
Data analysis
Welch’s t-test was used to compare the annual/seasonal soil N mineralization rates and the litter decomposition rates between plots. We considered multiplicity in tests of seasonal soil N mineralization and litter decomposition using the Benjamini & Hochberg (BH) method ([1]). The significant p-value was set as < 0.05. All statistical analyses and graphics were conducted using R version v. 4.1.2 ([18]).
Results and discussion
Soil temperature at the upper plot was higher than in the lower plot (Fig. S1 in Supplementary material), and the annual mean of the soil temperature at 5 and 25 cm depths in the upper plot was 2 °C higher than in the lower plot. The temperature difference could be due to the light conditions on the slope. Indeed, the lower plot, located near the valley, is shaded by the opposing slope and is covered by a canopy of Japanese cypress trees. In contrast, the upper plot receives shade later and is primarily dominated by deciduous broadleaf trees.
The soil water potential at 20 and 35 cm depths at the upper plots was around -10 kPa (Fig. S2 in Supplementary material), except for the period July-September. The annual mean soil water potential at 20 and 35 cm depths in the upper plot was -13 and -11 kPa, respectively, whereas it was -9 and -8 kPa in the lower plot. This indicates that the lower plot retained more moisture than the upper plot. The maximum soil water potential at 20 cm depth in the upper plot was -50 kPa, while it was only -25 kPa in the lower plot, indicating that during the summer the upper plot experienced more severe soil desiccation than the lower plot.
Input NH4 tended to be higher than input NO3 (Fig. 2). Both input NH4 and NO3 at the lower plot tended to be higher than those at the upper plot, and significantly higher at some points (Tab. 3). Annual input NH4 at the lower plot was significantly higher than that at the upper plot (t-test, p < 0.05), although there is no difference in NO3 between the two slope positions (Fig. 3). The amount of Japanese cypress leaf litter that remained one year later was comparable to previous studies ([20], [16]). The N levels remaining in litter samples from both plots decreased to 79 days before increasing again (Fig. 4d), showing no significant difference between the plots at other times (Tab. 4). The litter immobilized N rather than facilitating the mineralization during the experiment (Fig. 4). As a result, litter decomposition was not associated with the input N. One year after the experiment began, there were no significant differences in the remaining organic matter and N between the upper and the lower plots (Tab. 4).
Fig. 2 - Seasonal changes in input N and soil N mineralization rate. Input NH4 and Input NO3 denote ammonium and nitrate passed through the litter layer, respectively. Vertical bars represent the standard deviation (n = 3). The date is displayed in Month/Day/Year format.
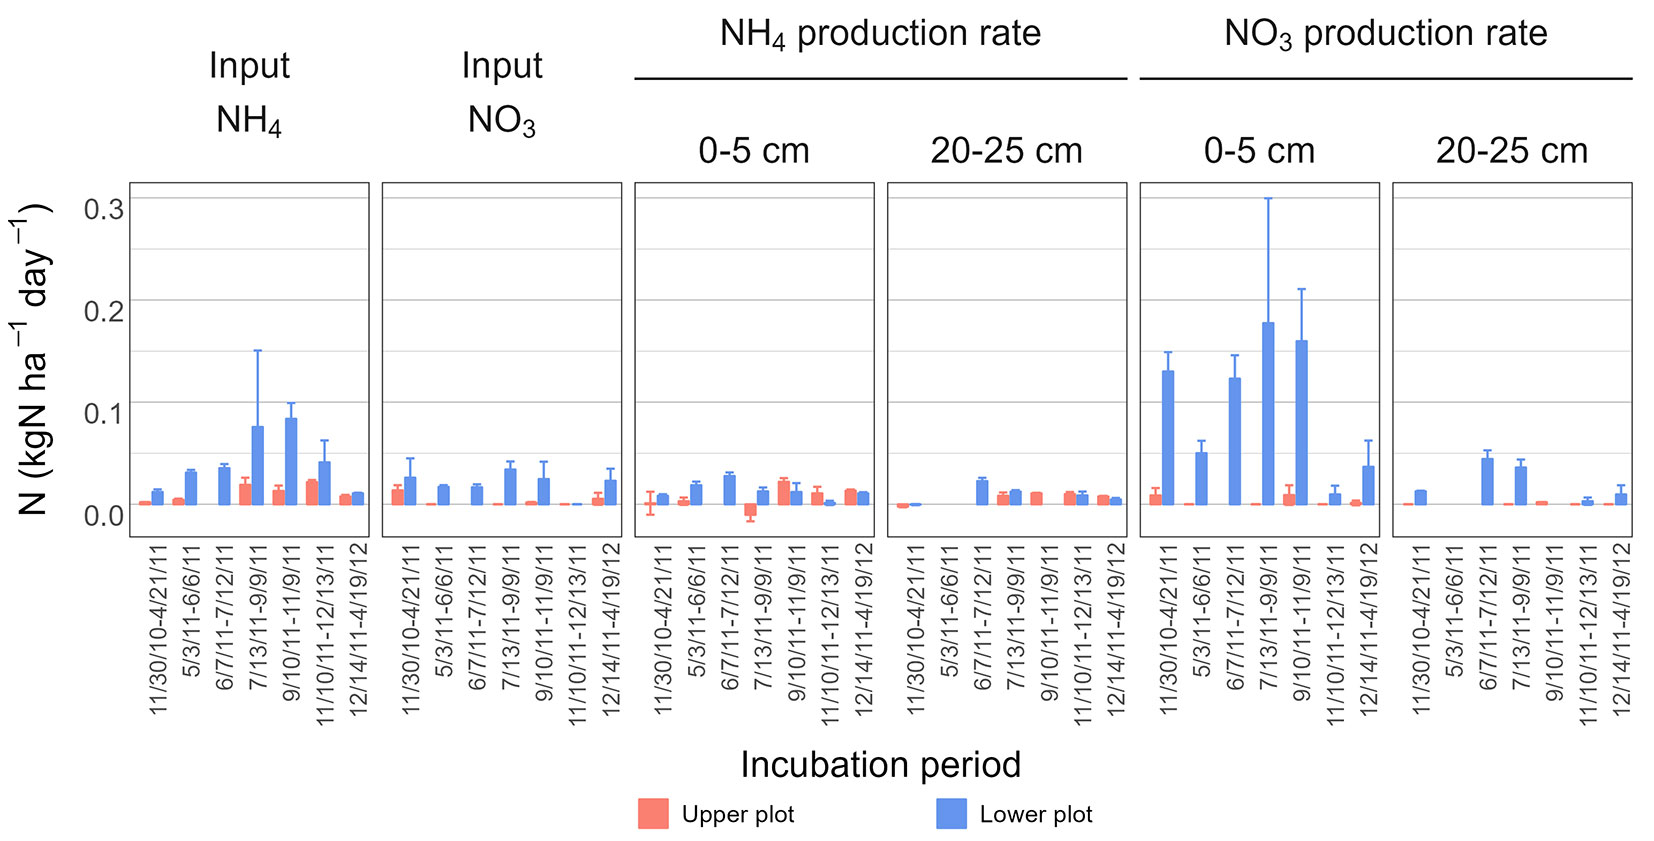
Tab. 3 - Results of the multiple t-tests of input N and soil N mineralization rates following the BH method. The date is shown in the Year/Month/Day format. Asterisks indicate a significant difference between the upper and lower plots. (NA): inorganic N not detected; (+): data not available; (++): data in the upper plot not available; (+++): data in the lower plot not available.
| Periods | Input NH4 | Input NO3 | Soil NH4 production rate | Soil NO3 production rate | ||
|---|---|---|---|---|---|---|
| 0-5 cm | 20-25 cm | 0-5 cm | 20-25 cm | |||
| 2010/11/30-2011/04/21 | * | Not significant | Not significant | * | * | * |
| 2011/05/03-2011/06/06 | * | * | * | + | * | + |
| 2011/06/07-2011/07/12 | ++ | ++ | ++ | ++ | ++ | ++ |
| 2011/07/13-2011/09/09 | Not significant | * | * | Not significant | Not significant | * |
| 2011/09/10-2011/11/09 | * | Not significant | Not significant | +++ | Not significant | +++ |
| 2011/11/10-2011/12/13 | Not significant | NA | Not significant | Not significant | Not significant | NA |
| 2011/12/14-2012/04/19 | Not significant | Not significant | Not significant | Not significant | Not significant | Not significant |
Fig. 3 - The average annual rate of input N and soil N mineralization. Input, Soil 0-5 cm, Soil 20-25 cm, and Soil 50-55 cm indicate inorganic N passed through the litter layer, and soil N mineralization at 0-5, 20-25, and 50-55 cm (n = 3-5).
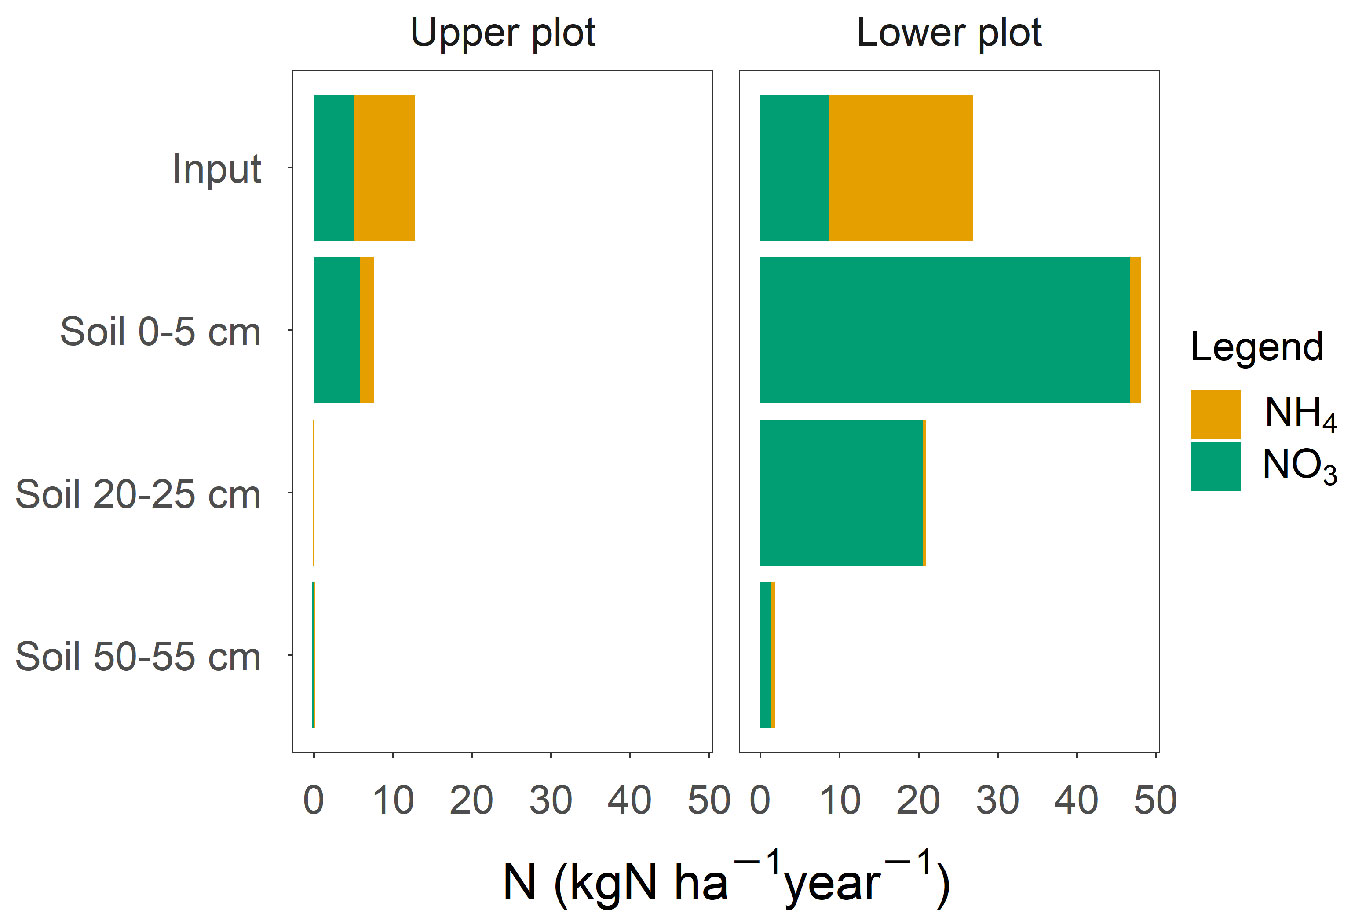
Fig. 4 - Temporal changes in the Hinoki cypress leaf litter. (a): Total weight; (b): organic matter; (c): total C; (d): total N. Vertical bar at each point represents the standard deviation (n = 3-5).
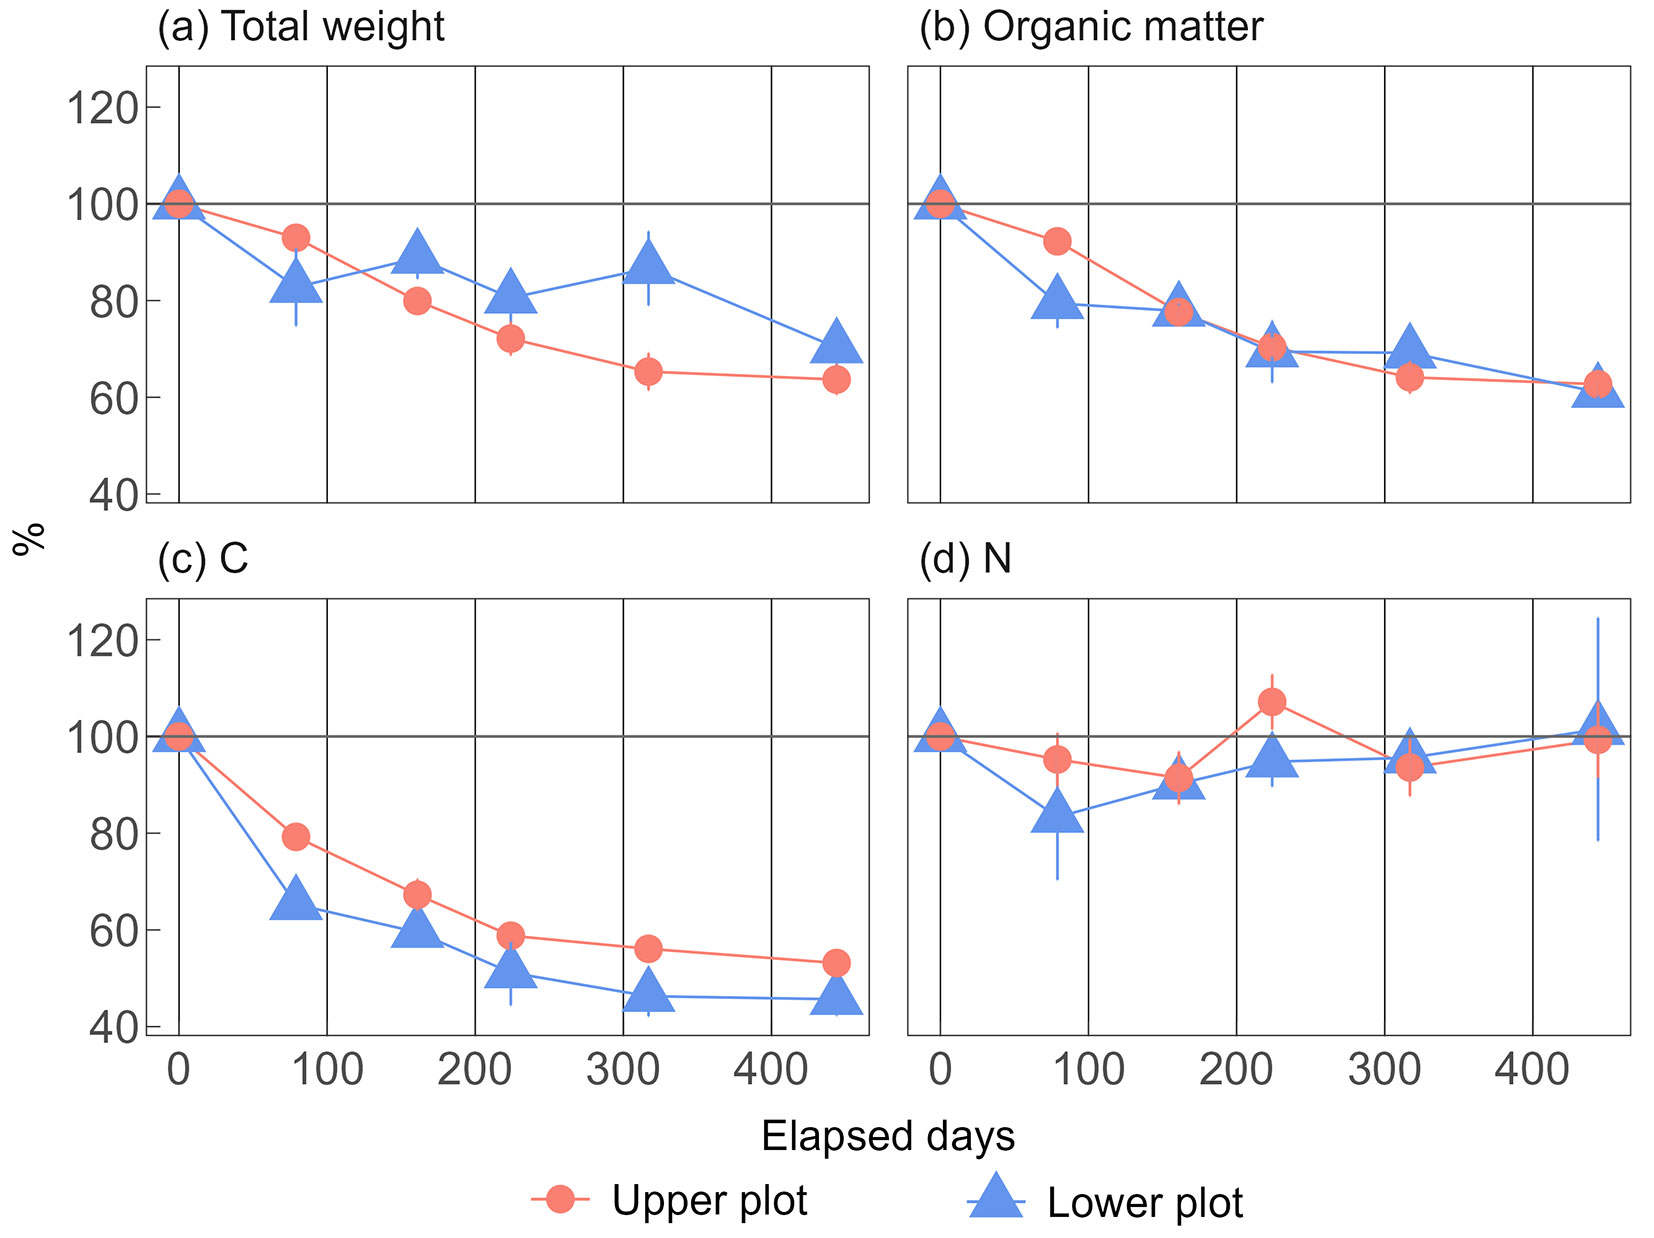
Tab. 4 - Results of the multiple t-tests of remaining total weight, organic matter, C and N, following the BH method. Asterisks indicate a significant difference between the upper and lower plots. (NA): not available.
| Elapsed days | Total weight | Organic matter | C | N |
|---|---|---|---|---|
| 0 | NA | NA | NA | NA |
| 79 | Not significant | Not significant | * | Not significant |
| 161 | * | Not significant | * | Not significant |
| 224 | Not significant | Not significant | Not significant | Not significant |
| 317 | * | Not significant | * | Not significant |
| 444 | * | Not significant | * | Not significant |
The variation in annual nitrogen mineralization in the two plots closely reflected the seasonal changes (Fig. 3). When combining input N with annual soil NH4 and NO3 production, the sum at the lower plot was significantly higher than at the upper plot (t-test, p < 0.05). Indeed, the sum of NH4 and NO3 in the lower plot was five times greater than in the upper plot.
An unexpected result was found in the annual changes in soil N mineralization rate during winter. Given the low temperatures, we anticipated a low soil N mineralization rate during winter. Contrary to our expectations, we observed a surprisingly high rate of soil N mineralization during this season. This finding is consistent with a recent report that the winter soil N mineralization accounted for 10-30% of the annual amount in Japan ([7]). High nitrification in winter at the lower position may be related to soil frost, which can accelerate the decomposition of organic matter ([10]). Further, we found that the soil N mineralization rate in the 2011-2012 winter was notably lower than that in the 2010-2011 winter. Hishi et al. ([8]) found that soil freeze-thaw had a negative impact on nitrification rates in northern Japan. The mean soil temperature during incubation in 2010-2011 and 2011-2012 was -0.55 °C and -0.72 °C, respectively, indicating that the 2011-2012 winter was colder than the previous winter. This implies that the soil frost in 2011-2012 was greater than that in 2010-2011, resulting in lower soil N mineralization in the 2011-2012 winter. This variation in soil N mineralization during winter may contribute to differences in the N cycle between the plot positions.
Conclusion
We investigated soil N mineralization at the upper and lower positions along a small-scale slope in a hinoki cypress (Chamaecyparis obtusa) stand in Japan. The soil N mineralization at the lower plot was significantly higher than that at the upper plot. Although N input into the soil at the lower plot was significantly higher than that at the upper plot, the litter decomposition rate was similar between the plots, as the litter immobilized N during the experiment. An unexpected finding was observed in the annual changes in the soil N mineralization rate during winter. The annual changes in soil frost, soil water content, and litter fall may have contributed to this annual change in soil N mineralization.
Acknowledgments
NH carried out the field survey and laboratory measurements, and wrote the manuscript. ST carried out laboratory measurements. KH and HK conceived the study and helped draft the manuscript. We appreciate Drs. Hosoo, Ono, and Oda for their assistance with soil analysis. We also appreciate the members of the Forest Environment and Ecology Laboratory at Shinshu University for their assistance. Two anonymous reviewers provided valuable comments. This study was partly supported by KAKENHI 23K13988.
Declaration of interest statement
We have no competing interests.
References
Gscholar
Gscholar
Gscholar
Gscholar
Gscholar
Gscholar
Authors’ Info
Authors’ Affiliation
Shikoku Research Center, Forestry and Forest Products Research Institute, 2-915 Asakuranishi, Kochi-shi, Kochi, 780-8077 (Japan)
Sasa Tajima
Division of Forest and Environmental Symbiosis Science, Faculty of Agriculture, Shinshu University, Nagano 399-4511 (Japan)
Education and Research Center of Alpine Field Science, Shinshu University, Nagano 399-4511 (Japan)
Department of Forest Soils, Forestry and Forest Products Research Institute, Matsunosato 1, Tsukuba, Ibaraki 305-8687 (Japan)
Corresponding author
Paper Info
Citation
Hosokawa N, Tajima S, Kobayashi H, Hirai K (2025). Seasonal change in soil nitrogen mineralization in young Chamaecyparis obtusa stands at the upper and lower positions on a slope in central Japan. iForest 18: 197-201. - doi: 10.3832/ifor4710-018
Academic Editor
Claudia Cocozza
Paper history
Received: Aug 19, 2024
Accepted: May 06, 2025
First online: Jul 20, 2025
Publication Date: Aug 31, 2025
Publication Time: 2.50 months
Copyright Information
© SISEF - The Italian Society of Silviculture and Forest Ecology 2025
Open Access
This article is distributed under the terms of the Creative Commons Attribution-Non Commercial 4.0 International (https://creativecommons.org/licenses/by-nc/4.0/), which permits unrestricted use, distribution, and reproduction in any medium, provided you give appropriate credit to the original author(s) and the source, provide a link to the Creative Commons license, and indicate if changes were made.

Web Metrics
Breakdown by View Type
Article Usage
Total Article Views: 5322
(from publication date up to now)
Breakdown by View Type
HTML Page Views: 1687
Abstract Page Views: 1768
PDF Downloads: 1708
Citation/Reference Downloads: 1
XML Downloads: 158
Web Metrics
Days since publication: 339
Overall contacts: 5322
Avg. contacts per week: 109.89
Article Citations
Article citations are based on data periodically collected from the Clarivate Web of Science web site
(last update: Mar 2025)
(No citations were found up to date. Please come back later)
Publication Metrics
by Dimensions ©
Articles citing this article
List of the papers citing this article based on CrossRef Cited-by.
Related Contents
iForest Similar Articles
Research Articles
The effect of clear-cut age on soil organic carbon and nitrogen indices in Scots pine (Pinus sylvestris L.) stands
vol. 18, pp. 146-153 (online: 09 June 2025)
Research Articles
Effects of tree species, stand age and land-use change on soil carbon and nitrogen stock rates in northwestern Turkey
vol. 9, pp. 165-170 (online: 18 June 2015)
Research Articles
Thinning effects on soil and microbial respiration in a coppice-originated Carpinus betulus L. stand in Turkey
vol. 9, pp. 783-790 (online: 29 May 2016)
Research Articles
Soil stoichiometry modulates effects of shrub encroachment on soil carbon concentration and stock in a subalpine grassland
vol. 13, pp. 65-72 (online: 07 February 2020)
Short Communications
Not all long-distance-exploration types of ectomycorrhizae are the same: differential accumulation of nitrogen and carbon in Scleroderma and Xerocomus in response to variations in soil fertility
vol. 14, pp. 48-52 (online: 18 January 2021)
Research Articles
Wood-soil interactions in soil bioengineering slope stabilization works
vol. 2, pp. 187-191 (online: 15 October 2009)
Research Articles
Response of soil bacterial communities to nitrogen and phosphorus additions in an age-sequence of subtropical forests
vol. 14, pp. 71-79 (online: 11 February 2021)
Research Articles
Seasonal dynamics of soil respiration and nitrification in three subtropical plantations in southern China
vol. 9, pp. 813-821 (online: 29 May 2016)
Research Articles
Estimating changes in soil organic carbon storage due to land use changes using a modified calculation method
vol. 8, pp. 45-52 (online: 17 June 2014)
Research Articles
Soil fauna communities and microbial activities response to litter and soil properties under degraded and restored forests of Hyrcania
vol. 14, pp. 490-498 (online: 11 November 2021)
iForest Database Search
Search By Author
Search By Keyword
Google Scholar Search
Citing Articles
Search By Author
Search By Keywords
PubMed Search
Search By Author
Search By Keyword


