
Nutrient cycling indicators in different models of successional groups and spacing for forest restoration
iForest - Biogeosciences and Forestry, Volume 19, Issue 1, Pages 61-68 (2026)
doi: https://doi.org/10.3832/ifor4468-018
Published: Feb 23, 2026 - Copyright © 2026 SISEF
Research Articles
Abstract
The increasing demand for forest restoration necessitates new strategies and assessments of nutrient returns to support functional restoration. This study aims to evaluate the production, nutrient cycling, and litter decomposition in different restoration models using both different seedling densities and varying proportions of pioneer and non-pioneer species. The experiment was established in 2012, with litter collection occurring in the sixth and seventh years; the leaf fraction was used for chemical analysis. To assess decomposition, litterbags were installed and collected monthly for six months, and climatic data were recorded during this period. The annual litter production in the sixth and seventh years was 7255 and 7953 kg ha-1, respectively. The decomposition process was unaffected by the treatments but was influenced by the microclimate, with minimum temperature showing the strongest correlation. Litter input and nutrient release (kg ha-1) varied significantly only with plant spacing, with the highest releases observed at 1 × 0.3 m spacing. The P, K, and S contents were not affected by either successional groups or plant spacing, while only calcium content varied significantly with the proportion of successional groups. Plant density was linked to higher litter and nutrient production in the system. The highest plant density was more effective at promoting short-term nutrient cycling at the beginning of the restoration process.
Keywords
Forest Nutrition, Litterfall, Plant Density, Successional Groups
Introduction
The Brazilian Government ([4]) has enacted a legal policy to restore 12 million hectares by 2030. Additionally, many institutions have committed to accelerating and expanding forest restoration efforts in Brazil ([6]). To meet these goals within such a short timeframe, large-scale restoration models must focus on rebuilding biodiversity and enhancing the resilience and self-sustainability of ecosystems ([24]). Several techniques have been used for restoration, including planting seedlings in random or linear arrangements at high density and diversity across different successional and functional groups, as well as other methods aimed at restoring the ecological functionality of forests ([29]).
Previous studies on seasonal semideciduous forests showed that some restoration models failed to restore essential ecological processes, such as nutrient cycling ([11], [30], [12]). This raises questions about the efficiency and long-term resilience of the systems and models used in restoration. Many restoration models based on functional or successional groups ([28]) have issues with soil litter cover, as indicated by ecological functionality indicators ([30], [1]). Between the ages of 35 and 60 months ([12]) and extending up to 7 years of age ([11]), the contribution to litter and nutrient cycling was insufficient to sustain the system.
The search for new models and arrangements in restoration activities is crucial not only to increase forest cover but also to maintain the ecological path of restored vegetation over time. New restoration models should enhance functionality in terms of self-sufficiency and resilience ([24]). One key gap involves the combination of species, planting arrangement, density, and seedling distribution in the field ([5]). The use of these models requires adjustments and appropriate methods for each forest management context to help restore ecological functions, particularly soil cover and the contribution of litter to the nutrient cycle ([30]).
Litter production is an environmental indicator used to assess nutrient cycling. Understanding key aspects such as leaf nutrient levels, decomposition rates, litter production, and their relationships with planting models is essential for developing new restoration strategies. This understanding supports better decision-making and provides insights into how changes in plant species composition can affect nutrient cycling ([13], [26], [34], [25]). Since successional groups influence litter and nutrient inputs, we hypothesize that plant density across successional groups will interact to affect litter uptake and nutrient content. We expect that areas with higher density and pioneer species will receive more litter input and exhibit higher nutrient content and production. In this context, we seek to address the following questions: (i) How do contributions from litter production and nutrients influence restoration models? (ii) Do plant spacing and the proportion of successional groups affect litter and nutrient production? (iii) Which model can best predict early litter and nutrient output?
Material and methods
Study area and experimental design
The study was conducted in a 526-ha area in Itu, São Paulo (23° 14′ 15.18″ S and 47° 24′ 3.29″ W). The vegetation primarily consists of the Atlantic Seasonal Semideciduous Forest ([17]), transitioning to Cerrado. The climate of the region is classified as Cwa, characterized by dry winter and hot summer, with an average annual precipitation of 1299.6 mm and an average annual temperature of 21.3 °C ([2]). The soil is a Red-Yellow Argisol with low fertility and a sandy loam texture.
For assessing the soil physical and chemical characteristics, we collected soil samples using a Dutch auger at a depth of 0-20 cm. Three individual samples were combined to create a composite sample for each treatment (n=10) in December 2019.
The experiment was set up in March 2012 using seedlings from a local nursery, and adopting a partial factorial design with three randomized blocks and ten treatments (Tab. 1). Nine treatments consisted of combinations of three planting densities and three proportions of successional groups (pioneer and non-pioneer species), with plots consisting of 70 seedlings each. A tenth treatment, considered a conventional control (T10), was not part of the factorial combination and had only a single replicate per block, resulting in a partial design.
Tab. 1 - Description of restoration models for degraded areas and treatments implemented in the study area located in Itu, São Paulo, Brazil. Planting in March 2012. (D): Dense; (SD): Semi-densified; (HD): High Dense; (C): Conventional; (PA): Plant arrangement; (SZ): Size; (P): Pioneers; (NP): Non-pioneer.
| Variables | D | SD | HD | C | ||||||
|---|---|---|---|---|---|---|---|---|---|---|
| T1 | T2 | T3 | T4 | T5 | T6 | T7 | T8 | T9 | T10 | |
| PA (m) | 1×1 | 1×1 | 1×1 | 2×1 | 2×1 | 2×1 | 1×0.3 | 1×0.3 | 1×0.3 | 3×2 |
| SZ | 88 | 88 | 88 | 176 | 176 | 176 | 25 | 25 | 25 | 528 |
| P (%) | 60 | 40 | 20 | 60 | 40 | 20 | 60 | 40 | 20 | 60 |
| NP (%) | 40 | 60 | 80 | 40 | 60 | 80 | 40 | 60 | 80 | 40 |
Seedlings of tree species native to the Atlantic Forest-Cerrado transition were used, including Croton urucurana Baill., Trema micrantha (L.) Blume, and Luehea grandiflora Mart. & Zucc. A total of 2100 individuals from 33 species were planted, distributed across the treatments (see Tab. S2 in Supplementary material).
Species were classified into successional groups (P: Pioneers; NP: Non-Pioneers) based on their ecological traits, according to the official guidelines of the São Paulo State Environmental Secretariat ([35]).
Fertilization at planting was carried out around each seedling, applying the equivalent of 8.3 g of nitrogen (N), 19 g of phosphorus (as P2O5), and 8.3 g of potassium (K) per plant. In the first year after planting, an additional fertilization of 30 g of NPK 4-14-8 was applied to each seedling. To facilitate interpretation and comparison, fertilizer amounts were also calculated per hectare, accounting for each treatment’s planting density and the replication of treatments across three blocks (Appendix 1 in Supplementary material).
To characterize the vegetation in the study area, a census was conducted twice: once in 2012, shortly after planting, and again in June 2017 (Tab. 2).
Tab. 2 - Results of the vegetation survey in 2012 and 2017 in Itu, São Paulo, Brazil. (P): pioneers; (NP): non-pioneers; (U): unidentified.
| Parameter | Year | T1 | T2 | T3 | T4 | T5 | T6 | T7 | T8 | T9 | T10 |
|---|---|---|---|---|---|---|---|---|---|---|---|
| Seedlings (un.) | 2012 | 210 | 210 | 210 | 210 | 210 | 210 | 210 | 210 | 210 | 210 |
| - | 111 | 104 | 118 | 167 | 135 | 144 | 111 | 117 | 128 | 218 | |
| Survival (%) | 2017 | 66 | 71 | 90 | 135 | 110 | 100 | 83 | 101 | 104 | 188 |
| Regenerating (%) | 2017 | 24 | 21 | 17 | 25 | 18 | 39 | 25 | 15 | 21 | 27 |
| Density (plant m-2) |
2012 | 1 | 1 | 1 | 0.5 | 0.5 | 0.5 | 3.3 | 3.3 | 3.3 | 0.2 |
| 2017 | 0.5 | 0.5 | 0.6 | 0.4 | 0.3 | 0.3 | 1.8 | 1.9 | 2 | 0.2 | |
| Successional Group (%) |
2012 | 40NP-60P | 60NP-40P | 80NP-20P | 40NP-60P | 60NP-40P | 80NP-20P | 40NP-60P | 60NP-40P | 80NP-20P | 40NP-60P |
| 2017 | 41NP-52P | 39NP-54P | 42NP-42P | 47NP-41P | 48NP-42P | 45NP-48P | 50NP-41P | 52NP-45P | 48NP-44P | 48NP-42P | |
| U 2017 | 7 | 7 | 17 | 12 | 9 | 6 | 9 | 3 | 8 | 10 |
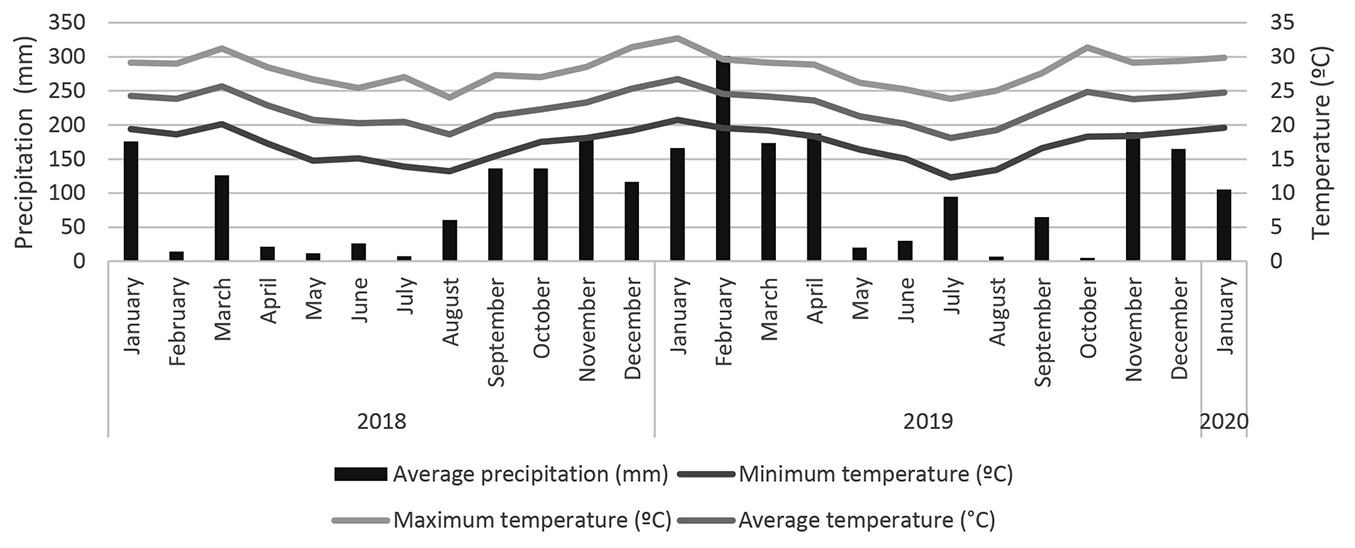
The values of precipitation, maximum, minimum, and average temperature recorded during the study period (January 2018 to January 2020), according to Ciiagro ([9]), are shown in Fig. 1.
Fig. 1 - Climate data during the months of the study period in Itu, São Paulo, Brazil.
Litter production
The litter was sampled once a month in February, March, April, June, July, September, and December 2018 (totaling 7 months), and bimonthly from February t0 December 2019 (6 months). We used conic collectors of Helanca® fabric measuring 64 cm in diameter (0.32 m2). They were arranged transversally and evenly spaced at a height of 1.20 m above the ground in each replication. The collected material was transported to the laboratory and separated into leaf, branch, and reproductive fractions. The plant material from each fraction was kept in the shade to naturally dry for about seven days, then placed in an oven at 65 °C for 24 hours and weighed afterwards ([33]). For each fraction, the mass in grams (g) was converted to kilograms (kg), and the total litter production was estimated using the following equation (eqn. 1), adapted from Lopes et al. ([19]):
where PAS is the average annual litter production (kg year-1), PS is the average monthly litter production (kg month-1), and Ac is the collecting area (m2).
Nutrient analysis
Nutrient content in the litter was analyzed every two months in each treatment (n=10) from February 2019 to December 2019, based on the leaf fraction. The nutrient contents of samples were determined using the Kjeldahl method for nitrogen (N), colorimetry for phosphorus (P), barium sulfate turbidimetry for sulfur (S), and atomic absorption spectrophotometry after nitric-perchloric digestion, as proposed by Malavolta et al. ([21]) for potassium (K), calcium (Ca), and magnesium (Mg). The results were expressed as levels of each element (g) per kg of litter (g kg-1).
The nutrient content in the litter was calculated according to the equation described by Scoriza et al. ([33] - eqn. 2):
where Ce is the production of the e-th element (kg ha-1), Te is the content of the e-th element in the litter (g kg-1), and Ts corresponds to the amount of litter produced (kg ha-1).
Litter decomposition
Early decomposition was studied using synthetic polymer litterbags measuring 20 × 20 cm with a 2 mm mesh ([33]). These litterbags were installed in July 2019, with three litterbags allocated per treatment (n = 10), per block (n = 3), per collection period (each lasting 6 months), totaling 540 units. Each litterbag was filled with a mixture of up to 10 grams of oven-dried (at 65 °C), intact, homogeneous leaves with no visible signs of decomposition, sampled from the species in each treatment. After 180 days, 90 individual litter bags were collected, dried at 60 °C until a constant mass was reached, and weighed. The change in dry mass from the initial mass at time zero (installation) was calculated, and the decomposition constant (k) was estimated following Scoriza et al. ([33] - eqn. 3):
where Xt is the mass of material remaining after t days, and X0 is the initial mass of the dry material in the litterbags. The constant k is the decomposition rate constant, calculated based on the mass-loss versus time (t, in days) relationship.
To evaluate the effects of climate on litter decomposition, we used data on temperature (°C) and precipitation (mm) for the study period ([9]).
Data analysis
The effects of planting spacing and the proportion of the successional groups on litter production, nutrient content, and decomposition were evaluated. Treatments were arranged in a factorial design with three replicates (blocks), which were treated as repetitions to capture natural variability; therefore, block effects were not included in the statistical models.
For the analysis of litter production and nutrient content, generalized linear models (GLMs) were employed, using a Gamma distribution and an identity link function, which are appropriate for continuous, positive, and asymmetric data. The response variables included the annual mean values of total litter production, its fractions (leaves, branches, reproductive parts, miscellaneous), and nutrient contents (N, P, K, Ca, Mg). The explanatory variables were planting spacing and the proportion of pioneer and non-pioneer species. Post hoc comparisons of treatment means were conducted using Tukey’s test.
Data exploration included boxplots, the Shapiro-Wilk test for residual normality, and Levene’s test for variance homogeneity, adopting a significance level of 5%.
Spearman’s correlation coefficients were calculated between climatic variables (precipitation and temperatures) and litter decomposition, considering both the collection month and the preceding month. Correlation strength was classified as low (r ≤ 0.5), moderate (0.51 < r ≤ 0.70), or high (r > 0.71).
Principal Component Analysis (PCA) was performed to explore the relationships between treatments (objects) and measured variables (descriptors), thereby reducing dimensionality and highlighting the main patterns of variability.
All statistical analyses were conducted in R ([27]), using the following packages: “car” for homogeneity tests; base R for normality tests; “RT4Bio” for GLM residual diagnostics; “multcomp” for multiple comparisons of GLM means; and “vegan” for PCA.
Results
Seven years after planting, survival was high (>70%), except for treatments T1, T2, and T6 (Tab. 2). New seedling establishment was dominated by pioneer species, except for T10, T4, and T7. On the other hand, the initial 40NP-60P (40% Non-Pioneer and 60% Pioneer species) proportion showed a reduced percentage of pioneer species in most treatments, except for the 1 × 1 m treatment (T1). Plant density was reduced, but this did not change the overall proportion of different species across the treatments, except in the conventional treatment (T10), where natural regeneration replaced the dead trees.
Litter production
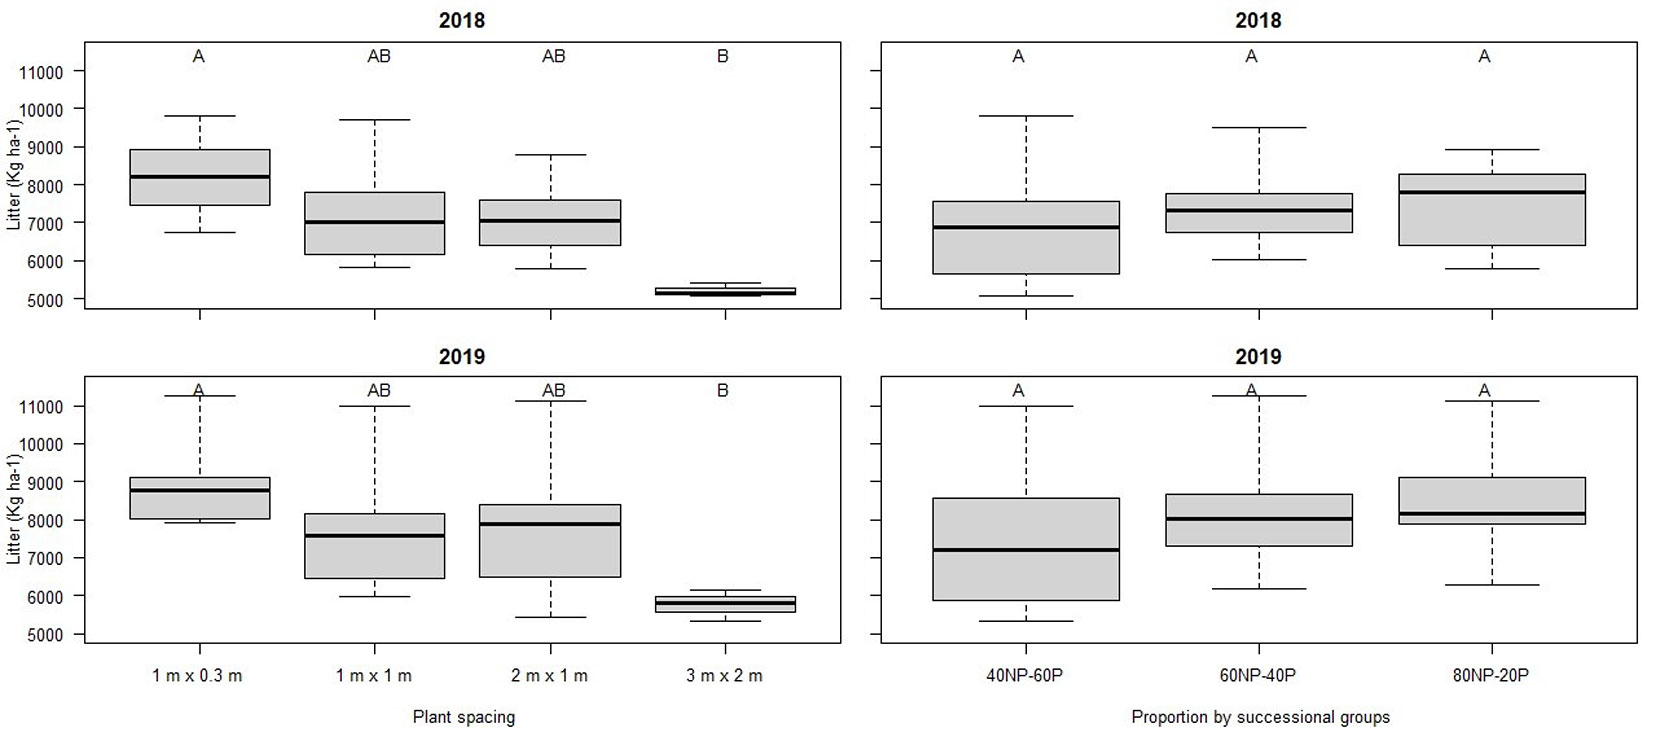
The annual litter production was 7255 kg ha-1 in 2018 (6th year since planting) and 7953 kg ha-1 in 2019 (7th year), ranging from 6217 to 9428 kg ha-1 across treatments. In both years, the litter production differed significantly (F2018= 6.71, p = 0.002; F2019= 4.00, p = 0.021) only for plant spacing (Fig. 2). In 2019, we observed an upward trend in litter production, but with a significant difference only for 3 × 2 m. Differences in litterfall across different proportions of successional groups (F2018= 0.02, p = 0.975; F2019= 0.35, p = 0.702) and their interaction with plant spacing (F2018= 1.64, p = 0.202; F2019= 1.22, p = 0.333) were not significant. However, the F < 1 for successional groups indicated greater variation between blocks than between treatments, with a large amplitude observed in 40NP-60P (40% Non-Pioneer and 60% Pioneer species). The highest litter production in 2018 and 2019 occurred at spacing 1 × 0.3 m, followed by the 1 × 1 m, 2 × 1 m, and 3 × 2 m spacings. Among the different proportions of successional groups, the highest production was recorded for the 80NP-20P treatment, followed by 60NP-40P and 60P-40NP (Tab. 3). The total litter production was more affected by the leaf fraction in 2018 (F2018= 8.38, p = 0.0005) than in 2019 (F2019= 2.82, p = 0.060), with a significant increase in the total contribution.
Fig. 2 - Box-plots of annual mean litterfall input results and Tukey’s test results (p <0.05) for spacing and successional group proportion over the years 2018 and 2019 in Itu, São Paulo, Brazil.
Tab. 3 - Average annual litter production from 2018 to 2019 and its fractions (kg ha-1 year-1) across different restoration models in the experimental area in Itu, São Paulo, Brazil. Means followed by the same letter in a column do not differ from each other (p > 0.05) after Tukey test (p < 0.05) for each year of planting and tested models. (L): leaves; (B): branches; (RM): reproductive material; (SG): successional group; (PS): plant spacing.
| Year | Model | Treatment | L | % L | B | % B | RM | % RM | Total |
|---|---|---|---|---|---|---|---|---|---|
| 2018 (6th year after planting) |
SG | 60NP-40P | 5692 A | 77 | 1088 A | 15 | 655 A | 9 | 7436 A |
| 40NP-60P | 5381 A | 77 | 1035 A | 15 | 543 A | 8 | 6958 A | ||
| 80NP-20P | 5908 A | 79 | 953 A | 13 | 607 A | 8 | 7470 A | ||
| PS | 1 m × 0.3 m | 6510 A | 79 | 1158 A | 14 | 576 A | 7 | 8244 A | |
| 1 × 1 m | 5381 BC | 75 | 1222 A | 17 | 588 A | 8 | 7191 A | ||
| 2 × 1 m | 5553 B | 79 | 826 A | 12 | 636 A | 9 | 7015 AB | ||
| 3 × 2 m | 3997 C | 77 | 649 A | 12 | 557 A | 11 | 5203 B | ||
| 2019 (7th year after planting) |
SG | 60NP-40P | 6063 A | 777 | 1586 A | 164 | 496 A | 59 | 8145 A |
| 40NP-60P | 5765 A | 806 | 1195 A | 147 | 447 A | 47 | 7407 A | ||
| 80NP-20P | 6348 A | 801 | 1524 A | 147 | 580 A | 52 | 8452 A | ||
| PS | 1 × 0.3 m | 6877 A | 799 | 1710 A | 161 | 543 A | 4 | 9131 A | |
| 1 × 1 m | 5890 A | 779 | 1338 A | 171 | 530 A | 5 | 7758 AB | ||
| 2 × 1 m | 5814 A | 808 | 1429 A | 132 | 488 A | 61 | 7732 AB | ||
| 3 × 2 m | 4759 A | 799 | 682 A | 121 | 320 A | 8 | 5761 B |
Nutrients
As with litterfall production, the different proportions of successional groups across treatments did not significantly affect nutrient contents, except for calcium, which was affected by both successional group and plant spacing. A significant increase in calcium content (F = 3.47, p = 0.047) was observed in the 40NP60P treatment (Tab. 4), while there were no significant differences in the content of other nutrients. Plant spacing significantly influenced the levels of N, Ca, and Mg. The nitrogen content was notably higher (F = 5.02, p = 0.007) at the 1 × 1 m spacing, whereas the 1 × 0.3 m spacing promoted greater absorption of Ca and Mg than other treatments.
Tab. 4 - Nutrient content (g kg-1) and production (kg ha-1) across different restoration models in the experimental area during 2019 in Itu, São Paulo, Brazil. Means followed by the same letter in the column do not differ from each other (p > 0.05), after Tukey test for each year of planting and the tested models. (SG): successional group; (PS): plant spacing.
| Parms | Model | Treatment | N | P | K | Ca | Mg | S |
|---|---|---|---|---|---|---|---|---|
| Content, g kg-1 (2019) |
SG | 60NP-40P | 16.1 A | 1.2 A | 3.9 A | 11.0 B | 2.5 A | 1.4 A |
| 40NP-60P | 16.0 A | 1.3 A | 4.3 A | 11.5 A | 2.6 A | 1.5 A | ||
| 80NP-20P | 16.0 A | 1.2 A | 4.1 A | 11.0 B | 2.5 A | 1.5 A | ||
| PS | 1 × 0.3 m | 15.6 B | 1.2 A | 4.3 A | 11.6 A | 2.8 A | 1.5 A | |
| 1 × 1 m | 17.0 A | 1.3 A | 3.8 A | 11.1 AB | 2.4 B | 1.4 A | ||
| 2 × 1 m | 15.8 B | 1.2 A | 4.0 A | 10.9 B | 2.4 B | 1.5 A | ||
| 3 × 2 m | 15.3 B | 1.2 A | 4.8 A | 11.1 AB | 2.5 AB | 1.4 A | ||
| Production, kg ha-1 (2019) |
SG | 60NP-40P | 132 A | 10.0 A | 33 A | 90.9 A | 21 A | 12.4 A |
| 40NP-60P | 118 A | 9.3 A | 32 A | 85.9 A | 20 A | 10.6 A | ||
| 80NP-20P | 135 A | 10.1 A | 36 A | 93.6 A | 21 A | 16.6 A | ||
| PS | 1 × 0.3 m | 140.3 A | 10.9 A | 44.5 A | 103.7 A | 24.5 A | 13.5 A | |
| 1 × 1 m | 132.5 AB | 10.0 A | 29.1 B | 88.6 AB | 19.0 AB | 11.6 AB | ||
| 2 × 1 m | 122.3 AB | 9.5 A | 28.6 B | 85.6 AB | 19.1 AB | 11.4 AB | ||
| 3 × 2 m | 86.4 B | 6.8 A | 26.2 B | 63.4 B | 14.2 B | 7.9 B |
Regarding production, the proportion of successional groups did not affect any nutrients. However, different plant spacing showed significant differences for nitrogen (F = 3.74, p = 0.024), calcium (F = 4.02, p = 0.018), magnesium (F = 5.06, p = 0.007), potassium (F = 7.30, p = 0.001), and sulfur (F = 3.89, p = 0.021), but not for phosphorus. The densest spacing, 1 × 0.3 m, produced the highest nutrient levels compared to the other spacings.
In terms of nutrient production among the successional groups, the 80NP-20P treatment had the highest value (312.3 kg ha-1), followed by 60NP-40P (298.4 kg ha-1), and 40NP-60P (275.8 kg ha-1). The order of nutrient production in this study was N > Ca > K > Mg > S > P. The highest nutrient production was recorded at the spacing 1 × 0.3 m (337.4 kg ha-1), followed by 1 × 1 m (290.8 kg ha-1), 2 × 1 m (276.5 kg ha-1), and 3 × 2 m (204.9 kg ha-1), aligning with the litter production results.
Litter decomposition
After 180 days, there was no significant difference in the decomposition rate (k) across plant spacings (F = 1.04, p = 0.392) or successional group (F = 0.37, p = 0.692) treatments. Similarly, no significant difference was observed for the half-life time among plant spacings (F = 1.90, p = 0.156) or successional groups (F = 0 .23, p = 0.739). However, the F<1 for successional groups indicated that there was more variation among blocks and plots than across different proportions of pioneer and non-pioneer species. The lowest k constants were found for the 60NP-40P and 2 × 1 m spacing (Tab. 5), leading to longer half-lives.
Tab. 5 - Litter decomposition constant (k) and half-life of litter (t½) in the last month of evaluation (180 days) in different restoration models in the experimental area in Itu, São Paulo, Brazil. Means followed by the same letter in a column do not differ from each other (p > 0.05), according to the Tukey test. (NP): non-pioneer species; (P): pioneer species.
| Model | Treatment | k (g g day-1) | t½ (days) |
|---|---|---|---|
| Proportion of successional groups | 60NP-40P | 0.0026 A | 280 A |
| 40NP-60P | 0.0027 A | 269 A | |
| 80NP-20P | 0.0027 A | 265 A | |
| Plant spacing | 1 × 0.3 m | 0.0028 A | 257 A |
| 2 × 1 m | 0.0024 A | 305 A | |
| 1 × 1 m | 0.0029 A | 248 A | |
| 3 × 2 m | 0.0025 A | 282 A |
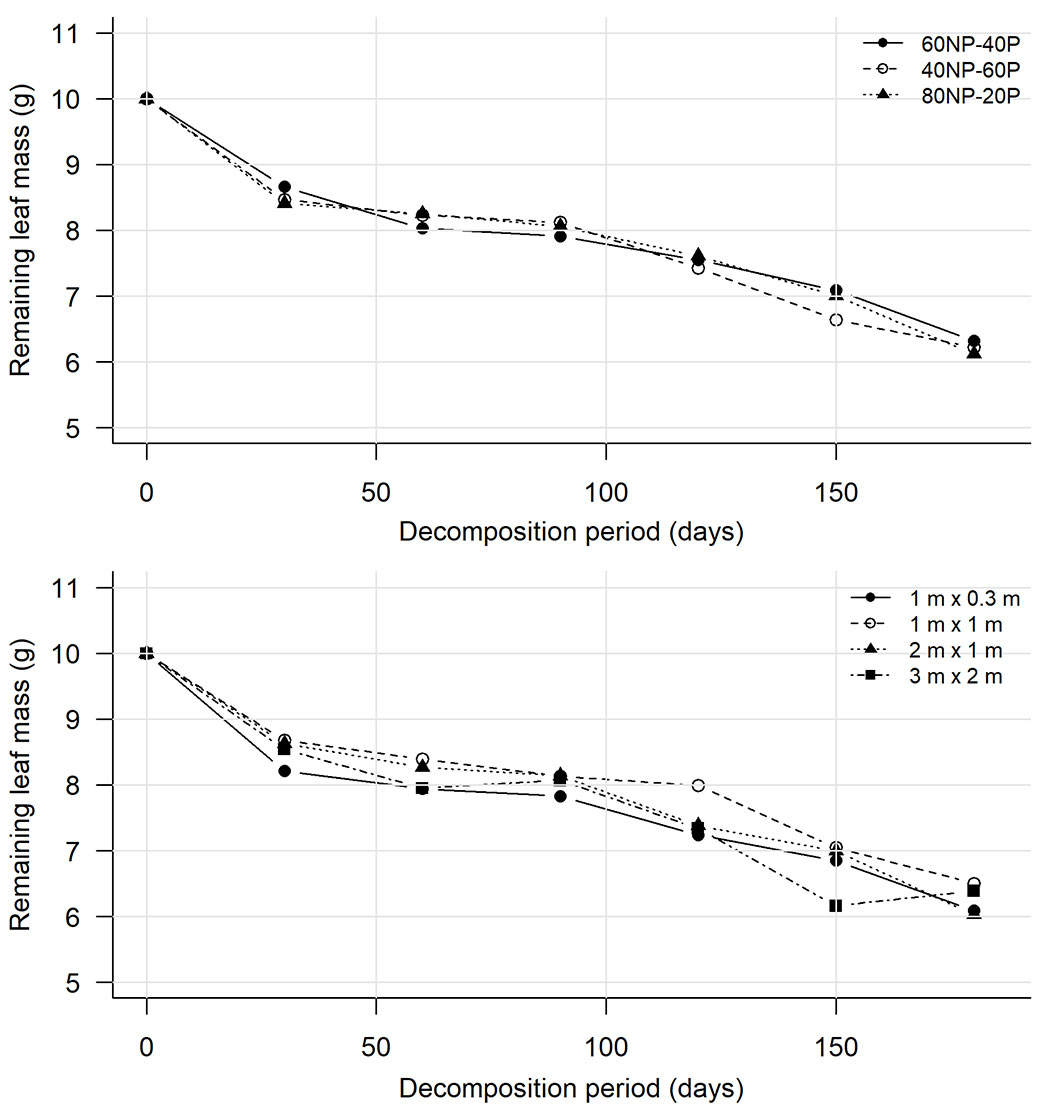
Following an exponential decay pattern with a constant decomposition rate (k), mass loss was rapid during the first 30 days (14.9%). Between 30 and 90 days, the decomposition rate decreased across treatments (2.4%), followed by a steady increase in decomposition of 5.2%, 6.3%, and 6.8% for the periods 90-120, 120-150, and 150-180 days, respectively (Fig. 3).
Fig. 3 - Leaf litter decomposition curves for each successional group (top panel) and spacing (bottom panel) in the study period in the region of Itu, São Paulo, Brazil.
Climatic conditions showed a significant negative correlation (p < 0.05) in litter decomposition between the current and previous months of collection (Tab. 6). We observed that precipitation was not correlated with litter decomposition, whereas minimum temperature had a strong influence.
Tab. 6 - Spearman correlation coefficient values for litter decomposition vs. climatic variables (precipitation, mean, maximum, and minimum temperature) for the month of collection and the previous month, during the period of litterbag removal in the experimental area in Itu, SP, Brazil.
| Variable | Current month | Previous month |
|---|---|---|
| Precipitation | -0.47 | -0.4 |
| Average temperature | -0.66 | -0.66 |
| Maximum temperature | -0.66 | -0.66 |
| Minimum temperature | -0.88 | -0.81 |
Ordination of treatments in relation to nutrient cycling
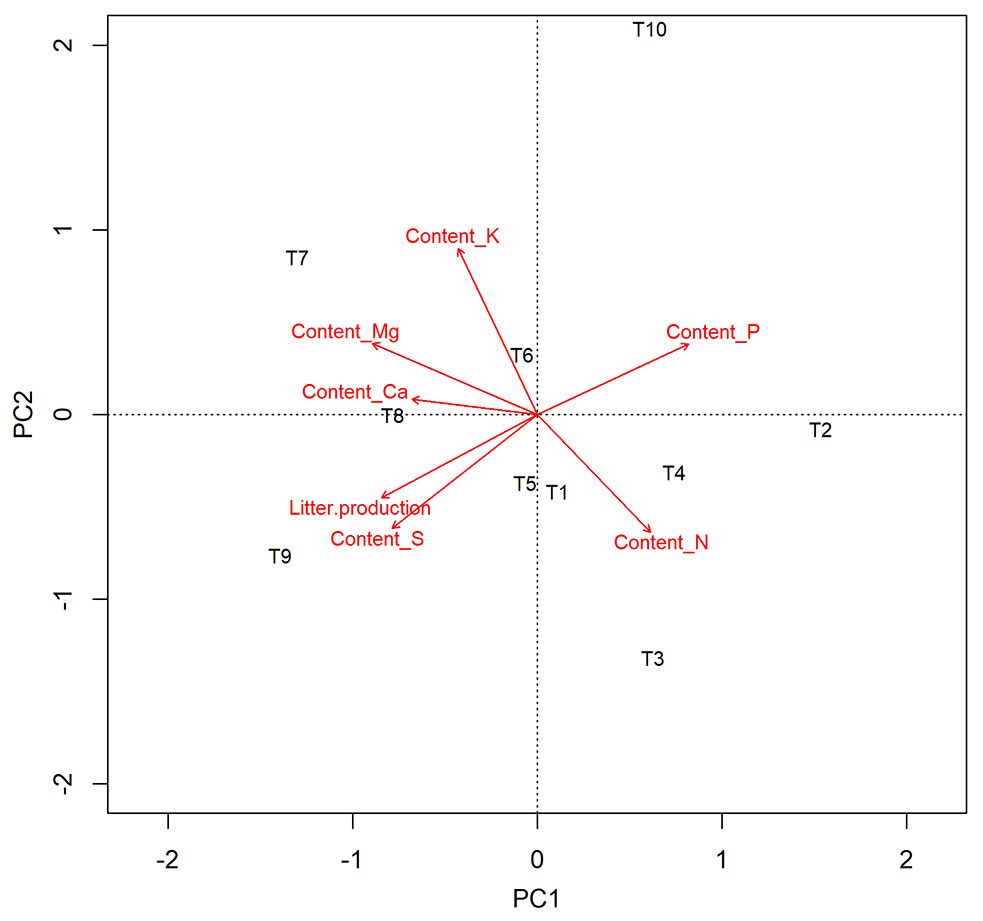
Principal component analysis (PCA) of treatments and variables explained 74% of the total data variation, with axis 1 (PC1) accounting for 48%, and axis 2 (PC2) accounting for 26% (Fig. 4). PC1 was associated with higher values of litter production, calcium, magnesium, and sulfur content. Litter production was directly related to S content and also influenced Ca and Mg contents when linked to T8 and T9, both dominated by non-pioneer species (60% and 80%) at the high-density spacing (1 × 0.3 m). Nitrogen and potassium contents were more closely associated with PC2 and the 1 × 1 m spacing, with nitrogen showing statistically significant differences (Tab. 4), and potassium content being lower for this spacing. Spacing arrangement had a greater impact on nutrient absorption, with treatment 3 × 2 m (T10) differing from the others, showing the lowest nutrient levels (see Appendix 2 in Supplementary material).
Fig. 4 - Principal Component Analysis (PCA) of treatments with different spacing and successional group proportion in the experimental area in Itu, São Paulo, Brazil. Labels of the different treatments reported in Tab. 1.
Discussion
The annual litter production in this study was within the expected range of 8500 ± 2500 kg ha-1 year-1, as previously reported for 105 locations in the Atlantic Forest ([22]). However, the lack of significant differences in litter production and nutrient content across the different proportions of ecological groups (SG) may stem from factors not analyzed, such as the floristic composition of each individual plot. The comparison of vegetation between 2012 and 2017 (Tab. 2) showed that plant mortality led to lower densities in the plots. Although the experimental design for different densities was the same, the proportions of species belonging to different successional groups changed over time. Therefore, no conclusions can be drawn on the effect of species composition on restoration functionalities, and additional investigations are needed on this topic.
As expected, higher plant density leads to more litter input. The 1 × 0.3 m plant spacing had the highest canopy closure, a condition that promotes natural pruning and leaf fall ([37]). This likely explains the increased litter production, supporting the hypothesis that a denser plantation with a closed canopy positively affects litterfall ([34]). Overall, the highest production comes from leaves, followed by branches and reproductive material. These results are similar to findings from other studies on seasonal semideciduous forests ([37], [20], [10]). Leaves are the most important component of nutrient cycling because of their higher nutrient content, faster decomposition, and larger volumes ([13]).
The association between increased nutrient production and higher litter output is consistent with the findings of Godinho et al. ([14]), which are derived from a calculation method that multiplies nutrient content by litter amount ([5]). The relationship between the smallest plant spacing and the greatest nutrient supply is also supported by Villa et al. ([37]). On the other hand, the conventional model with 3 × 2 m spacing had the lowest rates of litter and nutrient inputs, raising concerns for restoration projects that adopt this spacing, which is often mandated by public policies. ([12]).
The calcium content was the only element significantly affected by plant spacing and successional groups (Tab. 4). Elevated calcium levels in vegetation are crucial for promoting plant growth. Calcium is crucial for various processes, including cell wall development, enzyme activation, and key physiological functions such as root growth, nutrient absorption, and photosynthesis. Additionally, calcium’s role extends to balancing other essential nutrients, like potassium and magnesium. Beyond these functions, calcium is vital for strengthening plant defense mechanisms, making it essential for plant productivity, especially in nutrient-poor soils ([3], [23]).
In the present study, calcium was directly associated with Mg in T8 (1 × 0.3 m, 60NP-40P - Fig. 2), and it was significantly higher in the 40NP-60P treatment (Tab. 4). The Ca and Mg levels were significant at 1 × 0.3 m spacing and Ca only at 1 × 1 m spacing (Tab. 4). On the other hand, Mg showed reduced content in the 2 ×1 m and 1 × 1 m spacings, which can be attributed to the rapid oxidation of chlorophyll, occurring when leaves are in senescence and begin to decompose in the soil ([14]). However, calcium and magnesium levels were similar in the most (1 × 0.3 m) and least dense spacings (3 × 2 m). This may be due to an interaction with species composition rather than a density effect alone.
The above result emphasizes the complexity of distinguishing the effect of various ecological groups of species used for restoration on litterfall and nutrient content. Hobbie ([16]) reports mixed results, suggesting that the relationship between species traits and nutrient cycling deserves further attention, while Neves et al. ([25]) noted that few studies evaluated the contributions of different functional groups. Therefore, future studies should evaluate functional groups, species dominance, and the leaf chemistry of key species used in restoration activities.
In the 1 × 1 m treatment, nitrogen content was higher due to its high mobility within the plant. Also, it is likely linked to the dominance of certain species, mainly those belonging to the Fabaceae family ([25]). These species are known to form symbiotic associations with atmospheric N2-fixing bacteria ([32]). In contrast, phosphorus was the nutrient with the lowest content in the litter, possibly due to the soil’s low fertility.
Our results showed that smaller plant spacing leads to faster recovery of nutrient functions. This should be considered when planning restoration strategies because, depending on the goal, desired restoration speed, and available budget, seedling density affects not only nutrient production but also planting costs.
Although plant spacing influenced litter production and nutrient content, it did not affect decomposition rate. There was a temporal effect on the proportions of successional groups over time and spacing. The decomposition rate varied exponentially over time, consistent with findings from other studies ([15], [34], [18]). Between 30 and 90 days, decomposition decreased, likely due to lower precipitation during these months, which can reduce microbial activity in soil and litter ([15]). The increased precipitation during the last three months of evaluation (Fig. 1) may have accelerated the decomposition (Tab. 6). Higher precipitation, combined with increased temperature and soil moisture, promotes microbial activity, thereby increasing litter decomposition ([31]).
The increased rainfall in the final three months of the evaluation period likely contributed to a higher decomposition rate (Fig. 1, Fig. 3). Climatic conditions in the same sampling month were more closely linked to mass loss than those of previous months, indicating an immediate effect of temperature on decomposition (Tab. 6). The lowest temperatures showed the strongest correlation with decomposition, with temperatures rising continuously from July 2019 (winter) to January 2020 (summer), during which mass decreased (Tab. 6). Additionally, studies in seasonal semideciduous forests have indicated a non-immediate effect of precipitation ([26], [18]), thus we believe that microclimatic temperature has a significant impact on the litter decomposition rate.
Ordering of treatments in relation to nutrient cycling return
The spacing of the plantation strongly affected nutrient inputs and system outputs, showing rapid recovery of soil function early in forest succession. The 3 × 2 m treatment supports observations of low litter input, and it is recommended with adaptive management to promote ground cover and litter input restoration ([30], [11], [12]).
The effect of diversity in species or successional groups on soil forest restoration is unlikely to exceed that of more productive species, which are capable of generating significant short-term impacts. However, in the long term, the complementarity effect of various species can either match or surpass that of productive species ([7]). The faster functional processes can be restored, the greater the benefits for restoration and the emergence of new species. Nonetheless, low nutrient availability can hinder this process ([8], [36]).
Conclusions
The models studied for species mixture and spacing in plantations designed to restore semideciduous forests demonstrated significant differences in litter production, content, and nutrient levels. The varying initial proportions of successional groups (pioneer and non-pioneer species) in the plantations did not significantly affect nutrient cycling in the soil, with the exception of calcium content. In contrast, the spacing of the plantation had a notable impact on the contribution of litter and nutrients to the ecosystem. Therefore, selecting the most suitable spacing and model for restoration activities can effectively promote the rapid recovery of these functions during the early stages of forest succession, regardless of the proportions of successional groups used.
Acknowledgements
Project Idea (PI), Funding (F), Database (D), Processing (P), Analysis (A), Writing (W), Review (R), and All (AL).
Lucas Florêncio Mariano (AL), Glória Fabiani Leão da Costa (D, W, R), Fernando Boggiani (D), Francisca Alcivania de Melo Silva (A, R), José Mauro Santana da Silva (PI, F, A, R), Fátima Conceição Márquez Piña-Rodrigues (A, W, R, PI, F).
We acknowledge the Universidade Federal de São Carlos (UFSCar) in Sorocaba (SP, Brazil) and the Universidade Estadual Paulista “Julio de Mesquita Filho” (UNESP) in Registro (SP, Brazil) for the use of their laboratories, and the SOS Mata Atlntica Experiment Center in Itu (São Paulo State, Brazil) for providing the experimental area.
References
CrossRef | Gscholar
CrossRef | Gscholar
CrossRef | Gscholar
Gscholar
CrossRef | Gscholar
CrossRef | Gscholar
Gscholar
Gscholar
Gscholar
Gscholar
CrossRef | Gscholar
CrossRef | Gscholar
CrossRef | Gscholar
CrossRef | Gscholar
CrossRef | Gscholar
Authors’ Info
Authors’ Affiliation
Francisca Alcivnia de Melo Silva 0000-0001-8664-0532
São Paulo State University - Unesp, São Paulo, SP (Brazil)
Fernando Santos Boggiani 0000-0003-4559-9996
José Mauro Santana da Silva 0000-0003-0662-4132
Fátima Conceição Márquez Piña-Rodrigues 0000-0001-8713-448x
Federal University of São Carlos - UFSCar, São Carlos, SP (Brazil)
Corresponding author
Paper Info
Citation
Mariano LF, da Costa GFL, Boggiani FS, de Melo Silva FA, da Silva JMS, Piña-Rodrigues FCM (2026). Nutrient cycling indicators in different models of successional groups and spacing for forest restoration. iForest 19: 61-68. - doi: 10.3832/ifor4468-018
Academic Editor
Michele Carbognani
Paper history
Received: Sep 11, 2023
Accepted: Aug 28, 2025
First online: Feb 23, 2026
Publication Date: Feb 28, 2026
Publication Time: 5.97 months
Copyright Information
© SISEF - The Italian Society of Silviculture and Forest Ecology 2026
Open Access
This article is distributed under the terms of the Creative Commons Attribution-Non Commercial 4.0 International (https://creativecommons.org/licenses/by-nc/4.0/), which permits unrestricted use, distribution, and reproduction in any medium, provided you give appropriate credit to the original author(s) and the source, provide a link to the Creative Commons license, and indicate if changes were made.

Web Metrics
Breakdown by View Type
Article Usage
Total Article Views: 2052
(from publication date up to now)
Breakdown by View Type
HTML Page Views: 473
Abstract Page Views: 837
PDF Downloads: 639
Citation/Reference Downloads: 0
XML Downloads: 103
Web Metrics
Days since publication: 139
Overall contacts: 2052
Avg. contacts per week: 103.34
Article Citations
Article citations are based on data periodically collected from the Clarivate Web of Science web site
(last update: Mar 2025)
(No citations were found up to date. Please come back later)
Publication Metrics
by Dimensions ©
Articles citing this article
List of the papers citing this article based on CrossRef Cited-by.
Related Contents
iForest Similar Articles
Research Articles
Assessing the relative role of climate on litterfall in Mediterranean cork oak forests
vol. 11, pp. 786-793 (online: 14 December 2018)
Research Articles
Effect of restoration methods on natural regeneration in the Brazilian Atlantic Forest
vol. 18, pp. 23-29 (online: 15 February 2025)
Research Articles
Post-fire recovery of the plant community in Pinus brutia forests: active vs. indirect restoration techniques after salvage logging
vol. 11, pp. 635-642 (online: 04 October 2018)
Research Articles
Successional leaf traits of monsoon evergreen broad-leaved forest, Southwest China
vol. 10, pp. 391-396 (online: 16 March 2017)
Review Papers
The role of spatial criteria in enhancing forest restoration actions: a systematic review
vol. 19, pp. 157-167 (online: 11 May 2026)
Research Articles
The potential of the marula tree, Sclerocarya birrea, (A. Rich.) Horchst subspecies litterfall in enhancing soil fertility and carbon storage in drylands
vol. 18, pp. 366-374 (online: 07 December 2025)
Research Articles
The effect of calcium on the growth of native species in a tropical forest hotspot
vol. 11, pp. 221-226 (online: 01 March 2018)
Research Articles
Woody species recruitment under monospecific plantations of pioneer trees - facilitation or inhibition?
vol. 5, pp. 1-5 (online: 06 February 2012)
Research Articles
Can the dynamics of forest restoration reduce landscape fragmentation in the Atlantic forest?
vol. 18, pp. 61-68 (online: 04 April 2025)
Research Articles
Long-term changes in surface-active beetle communities in a post-fire successional gradient in Pinus brutia forests
vol. 10, pp. 376-382 (online: 16 March 2017)
iForest Database Search
Search By Author
Search By Keyword
Google Scholar Search
Citing Articles
Search By Author
Search By Keywords
PubMed Search
Search By Author
Search By Keyword


