Can the dynamics of forest restoration reduce landscape fragmentation in the Atlantic forest?
iForest - Biogeosciences and Forestry, Volume 18, Issue 2, Pages 61-68 (2025)
doi: https://doi.org/10.3832/ifor4639-018
Published: Apr 04, 2025 - Copyright © 2025 SISEF
Research Articles
Abstract
This study examines the landscape changes in two forest restoration areas: one adjacent to remaining forest fragments (AA) and the other non-adjacent (ANA), located in the municipality of Cabo de Santo Agostinho, Pernambuco, Brazil. The areas have been previously used for sugarcane cultivation and have undergone restoration interventions involving planting over 30 native species. The satellite images used were from 2011, 2015, and 2019, allowing for the analysis of changes in vegetation cover and landscape fragmentation. The results indicate that both areas experienced an increase in vegetation cover over time, as evidenced by the normalized difference vegetation index (NDVI). However, adjacent to forest fragments, the AA area exhibited greater ecological connectivity and less fragmentation, resulting in a large forest fragment from 2015 onwards. On the other hand, the non-adjacent ANA area showed slower progress but managed to form a large fragment by 2019, thanks to the presence of planted species such as Mimosa caesalpiniifolia. Moreover, the analysis of fragmentation metrics revealed a reduction in the division index in both areas, which was more pronounced in AA. The supervised classification of the images indicated changes in the restoration areas and their surroundings, with the expansion of classes such as Forest and Exposed. The results highlight the importance of functional connectivity between forest fragments, especially in areas adjacent to remaining fragments, which can accelerate the restoration process and reduce fragmentation. Active restoration, through planting high-density native species, proved effective in rehabilitating forest cover. This study suggests that forest restoration in anthropized areas can mitigate fragmentation, with effects observable in less than a decade, particularly when connecting existing fragments. These findings underscore the importance of implementing restoration strategies that foster connectivity between forest fragments and of continuously monitoring fragmentation metrics to evaluate the efficacy of restoration actions.
Keywords
Active Restoration, Landscape Metrics, Native Tree Plantation, Restoration Assessment, Restoration Monitoring, Tropical Restoration
Introduction
Forest fragmentation is primarily driven by urbanization and agricultural expansion. In most landscapes, the sustainable threshold for forest fragmentation has already been exceeded, resulting in reduced connectivity ([29]). Conservation areas are increasingly surrounded by intensively modified environments and, in the long term, appear condemned to function as isolated natural ecosystems ([23]).
In fragmented landscapes, human activities most impact the edges of natural vegetation fragments ([38]). Paula et al. ([27]) claim that there is less biomass and higher mortality in fragmented regions where forest edges are near urban areas. Bergès et al. ([4]) studied the influence of roads and surfacing materials on forests and found that surfacing materials significantly affected the diversity and composition of plants, with greater dissimilarity in plant composition near roads paved with gravel compared to those with exposed soil.
Landscape connectivity is crucial for many ecological processes, including dispersal, gene flow, and demographic rescue ([24]). Forest succession often begins at the edges of patches adjacent to established forests ([39]). In general, seed dispersal decreases with distance ([26]).
Spontaneous regeneration in the Atlantic Forest has been observed to occur up to 180 meters from the oldest fragments ([34]). In a study on the relationship between species composition, richness, and abundance of native trees in both the understory and the stand, Ritter et al. ([36]) found that only a small portion of seeds are dispersed beyond 300 meters from remnants of native Atlantic Forest. These results suggest that most regeneration of fragmented forests occurs in the immediate surroundings.
Increasing functional connectivity between remnants can favor forest-dependent species by enhancing the mobility of individuals in dynamic landscapes ([3]). For these reasons, restoration efforts should prioritize connecting forest fragments ([12]).
However, restoration strategies are still being tested ([25], [41]). Mixed plantations are a promising option for ecological restoration. According to Lortie et al. ([20]), human development and restoration often proceed simultaneously and are spatially adjacent. As a consequence, restoring forests should focus on active rather than passive restoration strategies. This active approach facilitates species recruitment by rapidly reestablishing canopy cover through high-density plantations of native tree species ([37]).
Restoration can help establish connections among forest remnants, and therefore it is essential to understand the changes in the surrounding landscape determined by restoration activities. Indeed, it is clear that the surroundings influence and are influenced by mixed plantations. This underscores the importance of continuously quantifying fragmentation beyond the area of interest to assess the condition of the forest and adopt measures to reduce fragmentation ([44]).
Landscape metrics are valuable criteria for assessing forest structure and its suitability to provide various forest functions ([45]). The landscape surface can be parameterized to reflect how its characteristics could influence organism movement ([28]). Additionally, vegetation indices can assist in interpreting landscape changes. For example, the NDVI, which correlates with vegetation cover and biomass, can be used to monitor the effectiveness and spatial trends of restoration processes ([31]).
By analyzing the structural parameters of the landscape, crucial ecological information can be inferred regarding the relationship between the local landscape and ecological restoration plantations. This study aimed to analyze changes in the local landscape caused by two areas undergoing restoration that differ primarily in their surroundings. One restoration area connects the remaining forest fragments, while an anthropized environment characterizes the surroundings of the other area. This study hypothesizes that restoration plantations connecting forest remnants may reduce fragmentation within less than a decade.
Material and methods
Study area
The study was conducted in two forest restoration areas (ANA: non-adjacent to any forest fragment; AA: adjacent to forest fragments), both previously used for sugarcane cultivation, located in the municipality of Cabo de Santo Agostinho, Pernambuco, Brazil (Fig. 1).
Fig. 1 - Location of the two restoration areas (ANA: non-adjacent to forest fragments, and AA: adjacent to forest fragments) in Cabo de Santo Agostinho, Pernambuco, Brazil.
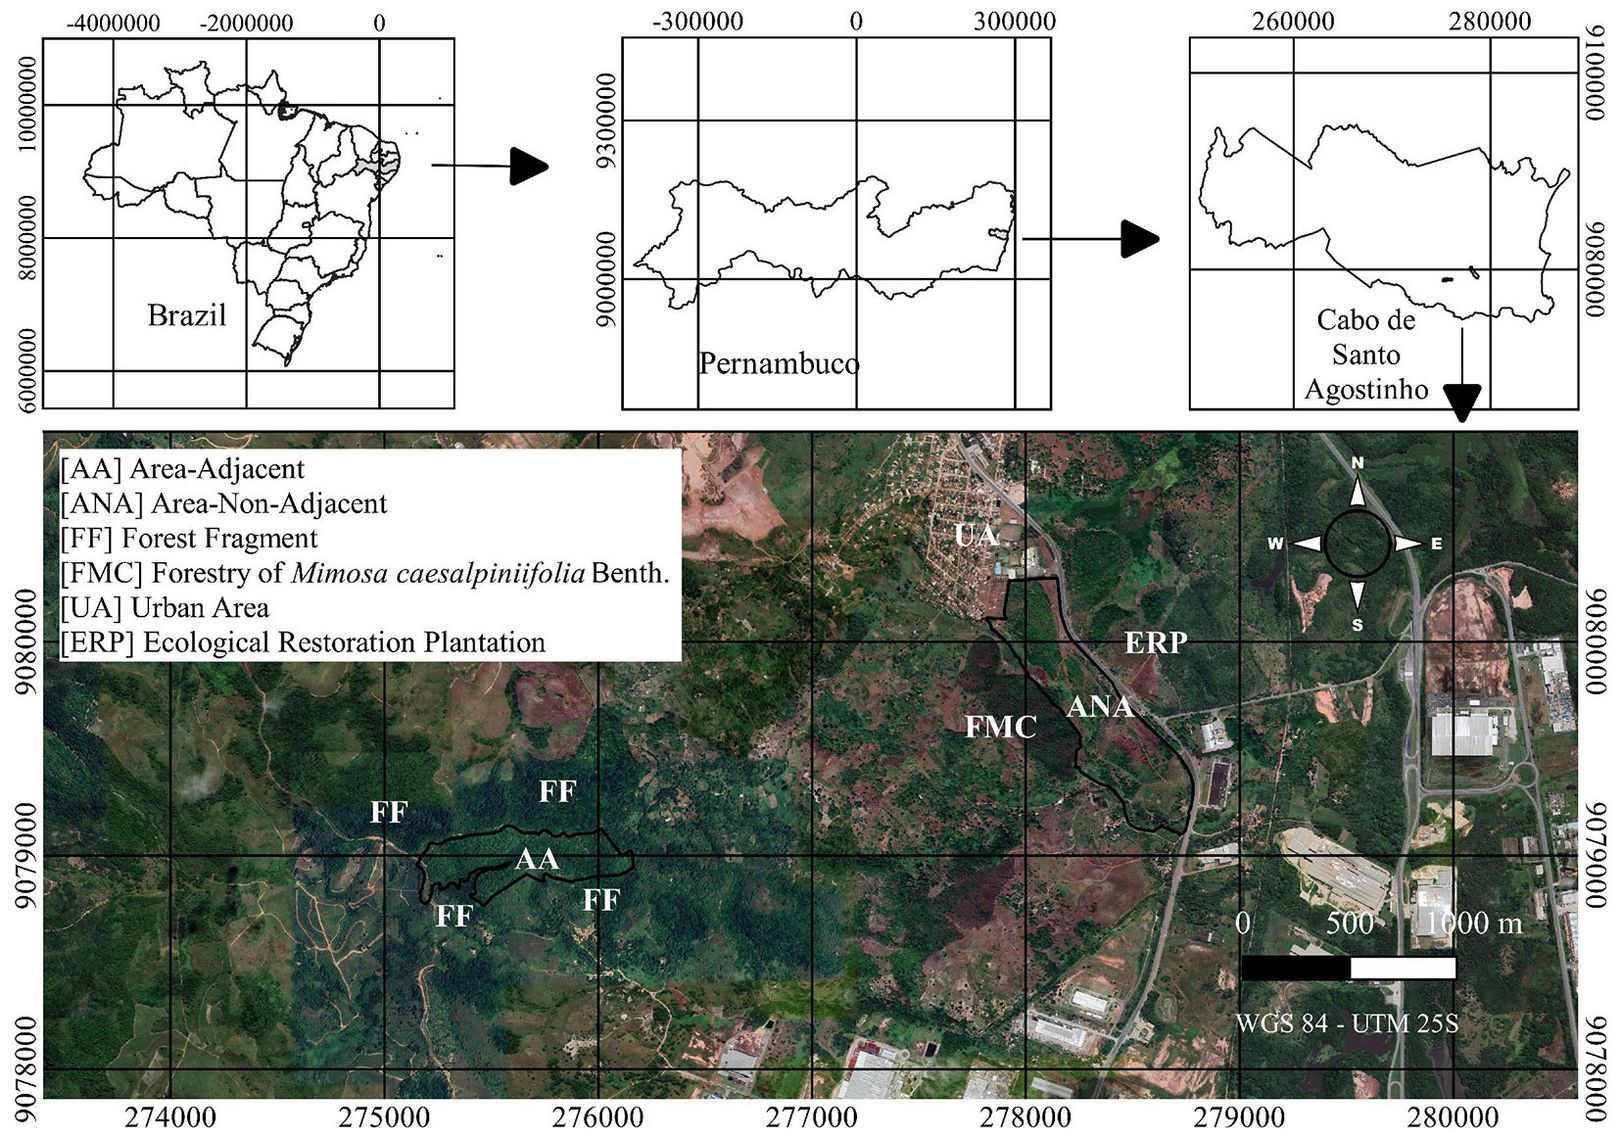
According to the Köppen-Geiger classification, the climate was classified as A, with an average annual temperature of 25.5 °C and an average annual rainfall of 1726 mm ([1]). The original vegetation was classified as Dense Ombrophilous Forest ([15]). The soil in the AA and ANA areas was classified as yellow oxide ([16]).
Restoration in both areas (ANA and AA) involved planting over 30 native species, using pioneer, early, and late secondary species. The planting was carried out in January 2012, with a spacing of 3 × 2 m. All access roads were fenced, and firebreaks surrounded the areas. Irrigation was provided as needed, along with adequate fertilization, regular cleaning, and ant control until January 2017.
These areas were selected due to their similar history of land use (both had been cultivated with sugarcane for decades) and similar climate. Moreover, restoration activities were implemented simultaneously and with the same maintenance practices. However, while both areas were used for sugarcane cultivation, no information was available on the intensity of land exploitation in the two areas. Different management practices may have been applied between AA and ANA, potentially altering soil properties. According to Van Der Putten et al. ([42]), soil properties are critical to plant growth. Additionally, increased agricultural mechanization can lead to soil compaction issues ([2]). Therefore, as soil was considered a limiting factor in this study, no soil parameters were analyzed to support the interpretation.
Data collection and analysis
We used satellite images from the RapidEye orbital platform, scene 2535205, dated March 12, 2011 and August 9, 2015, acquired from the GeoCatalog of the Brazilian Ministry of the Environment. Additionally, an image dated October 9, 2019 was also considered. Thus, one image was taken one month before planting (2011), another almost four years after (2015), and another nearly eight years after planting (2019). Some information about the RapidEye System Mission Characteristics is presented in Tab. 1([30]).
Tab. 1 - RapidEye system mission characteristics.
| Characteristic | Information |
|---|---|
| Number of Satellites | 5 |
| Orbit Altitude | 630 km in Sun-synchronous orbit |
| Sensor Type | Multi-spectral push broom imager |
| Spectral Bands | Capable of capturing all the following spectral bands |
| Band Name | Spectral Range (nm) |
| Blue | 440 - 510 |
| Green | 520 - 590 |
| Red | 630 - 685 |
| Red Edge | 690 - 730 |
| NIR | 760 - 850 |
| Ground Sampling Distance (nadir) | 6.5 m |
| Pixel size (orthrectified) | 5 m |
| Camera Dynamic Range | 12 bit |
The formula used to convert digital numbers (DN) to top-of-atmosphere reflectance (TOA) radiance was ([30] - eqn. 1):
where i is the number of the spectral band, REF is the reflectance value, DN is the digital number, 0.01 is the radiometric scale factor, Dsun is the Earth-Sun distance on the day of acquisition in astronomical units, EAI is the exo-atmospheric irradiance, SZ is the solar zenith angle in degrees (i.e., 90° minus sun elevation).
The atmospheric correction to convert TOA to bottom-of-atmosphere reflectance (BOA) was achieved using the 6S (Second Simulation of Satellite Signal in the Solar Spectrum) algorithm ([43]). The 6S algorithm generates lookup tables for the MODIS (Moderate Resolution Imaging Spectroradiometer) atmospheric correction algorithm ([18]). The 6S code was tested against a Monte Carlo code, Coulson’s tabulated values, and in scalar mode against the scalar code SHARM. All test cases demonstrated good agreement between 6S and the other codes, with the overall relative error not exceeding 0.8% ([19]). The parameters used are presented in Tab. 2, employing the package “i.atcorr” in QGIS with GRASS ver. 3.10 ([32]).
Tab. 2 - 6S parameters used for atmospheric correction of the RapidEye images.
| Parameters | 2011 | 2015 | 2019 |
|---|---|---|---|
| Geometrical Conditions | 13 | 13 | 13 |
| Month/Day, hh.ddd | 12/3, 11.547222 | 9/8, 10.250556 | 9/10, 12.115278 |
| Longitude | 35.18445 | 35.07037 | 35.025095 |
| Latitude | -8.35371 | -8.35371 | -8.322015 |
| Atmospheric model | Tropical | Tropical | Tropical |
| Aerosols model | Continental | Continental | Continental |
| Visibility | 0 | 0 | 0 |
| Mean Target Elevation | -0.07 | -0.07 | -0.07 |
| Sensor Height | -1000 | -1000 | -1000 |
| Band | 88-92 | 88-92 | 88-92 |
It is worth noting that the 2011 image was captured in December, while the 2015 and 2019 images were taken in September. This reduces the reliability of comparisons between the most recent images and the 2011 image. Regarding landscape classification and analysis, a buffer of 1 km was established to avoid overlapping, as the areas are about 2 km apart. Using this buffer, the ANA landscape covers 682.02 ha, and the AA landscape covers 571.77 ha.
The NDVI was calculated using the QGIS 3.10 raster calculator ([32]). Additionally, 10.000 pixels were randomly selected in each area to test for differences by analysis of variance and Tukey’s test (α = 0.05). The argument “paired = TRUE” was used in the TukeyHSD function ([33]), which is appropriate for dependent samples.
The surroundings of the restoration areas were classified by land use/cover as follows: (i) Forest - tree formations; (ii) Farming - areas with annual crops at various stages of development, land being prepared for planting, early-stage crops, and pastures; (iii) Exposed Soil - areas without vegetation cover; (iv) Water - rivers, streams, ponds, and dams; (v) Urban Area - rural constructions and urban areas, as described in the Technical Manual on Land Use ([14]).
Pixel-based classification approaches are widely used in land use/land cover (LULC) mapping to generate LULC maps from medium spatial resolution satellite images using only the spectral information from individual pixels ([40]). The images were submitted to Maximum Likelihood supervised classification using R5G4B3 for digital image processing and spectral recognition of the classes. Overall accuracy and reliability were estimated using the Kappa coefficient, with assistance from QGIS ver. 3.10 and the Semi-Automatic Classification Plugin ([32]). The Kappa coefficient reflects the accuracy and reliability of the classification by comparing the results to reference data ([9]). The number of training samples, overall accuracy, and Kappa values are presented in Tab. 3.
Tab. 3 - The number of training samples, the overall accuracy, and the Kappa hat classification of AA and ANA in 2011, 2015, and 2019.
| Parameter | AA | ANA | ||||
|---|---|---|---|---|---|---|
| 2011 | 2015 | 2019 | 2011 | 2015 | 2019 | |
| No. training samples | 18 | 18 | 20 | 26 | 23 | 23 |
| Overall accuracy (%) | 80.58 | 78.16 | 78.18 | 69.35 | 70.74 | 67.07 |
| Kappa hat classification | 0.72 | 0.69 | 0.68 | 0.63 | 0.64 | 0.59 |
Using QGIS ver. 3.10 software and the Landscape Ecology Statistics-LecoS add-on, we calculated metrics for the Forest, Farming, Exposed Soil, Urban Areas, and Water classes ([32]). The Forest class was further subdivided into size categories according to Juvanhol et al. ([17]), as follows: “very small” fragments (<5 ha), “small” (5-10 ha), “medium” (10-100 ha), and “large” (>100 ha). For each size category, the following metrics were analyzed: area (total area, proportion, and mean patch area), core area (-10 m), edge (edge length), heterogeneity (number of patches), shape (fractal dimension index and mean patch shape ratio), proximity (adjacencies), and fragmentation (splitting index).
Results
The NDVI showed a high variation in color intensity across the intervals, indicating that both landscapes experienced increased vegetation coverage (Fig. 2).
Fig. 2 - The NDVI of two ecological restoration plantations on March 12, 2011 (one month before planting, left panel), August 9, 2015 (almost four years after planting, middle panel), and October 9, 2019 (nearly eight years after planting, right panel). ANA is non-adjacent to native fragments, and AA is adjacent to native fragments in Cabo de Santo Agostinho, PE, Brazil.
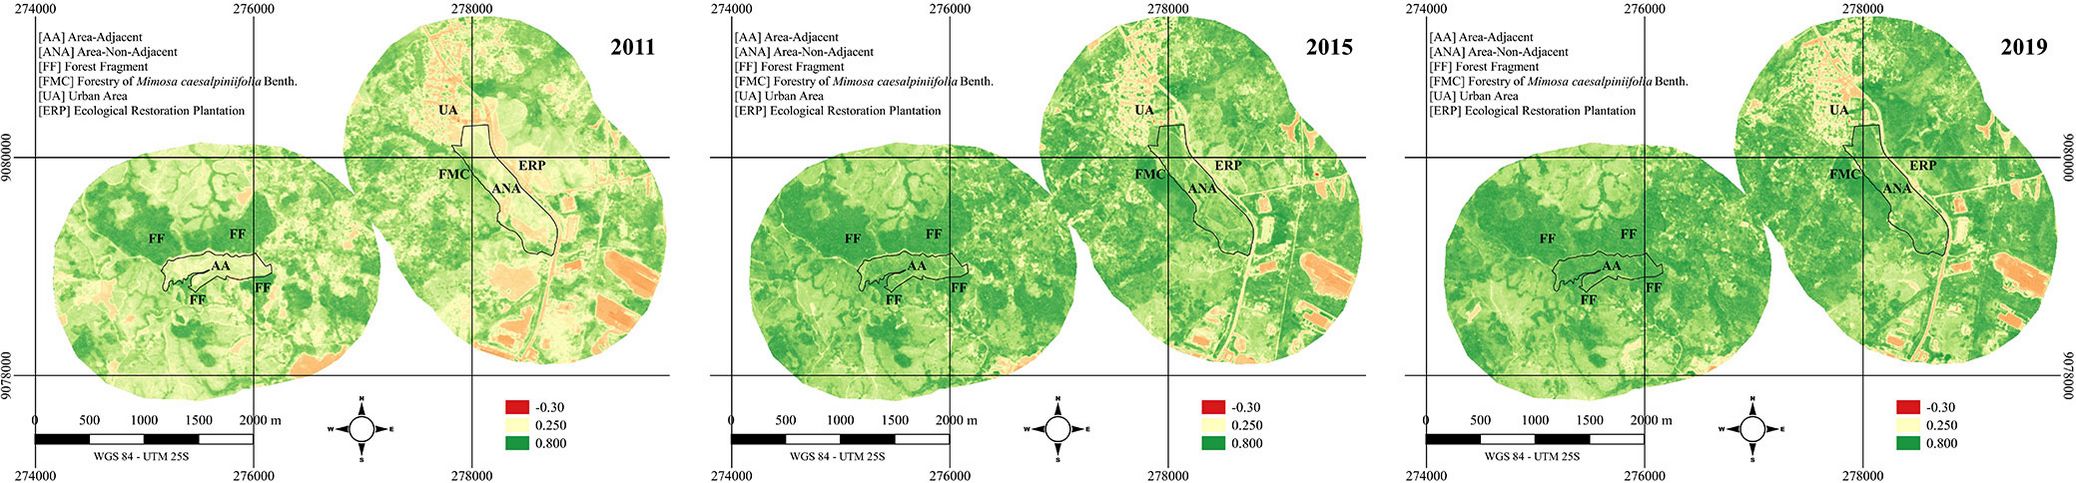
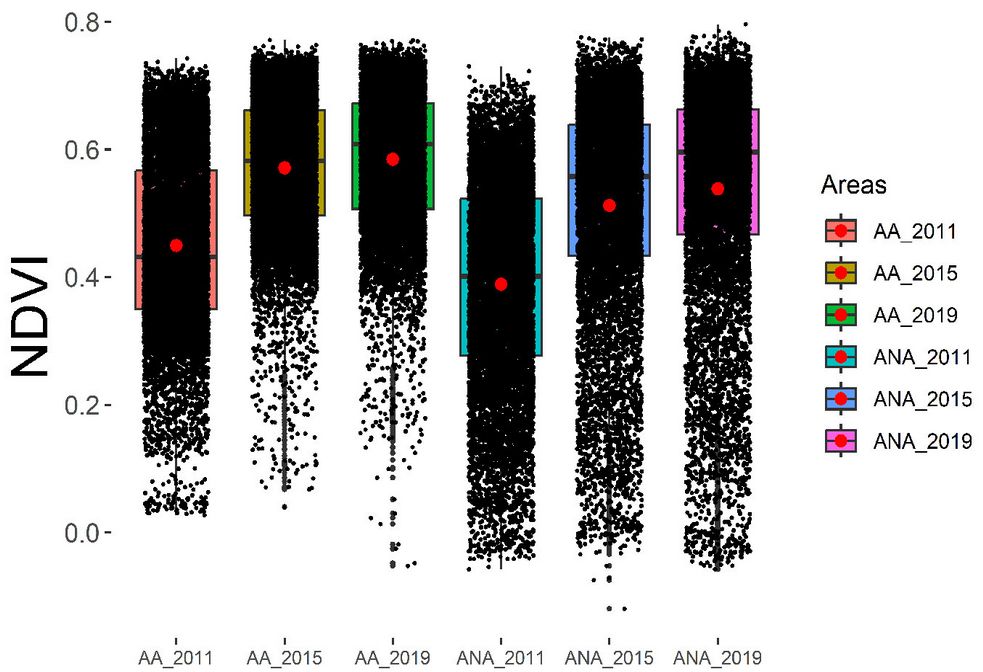
In Fig. 3, significant differences between areas and years support the interpretations of Fig. 2. It is also noted that AA in 2019 presented values closer to 1, with a smaller amplitude and a higher median, indicating healthier vegetation.
Fig. 3 - Comparison of averages of 10.000 randomly selected pixels for each restoration area across three time points (2011, 2015, and 2019) between ANA (non-adjacent to forest fragments) and AA (adjacent to forest fragments).
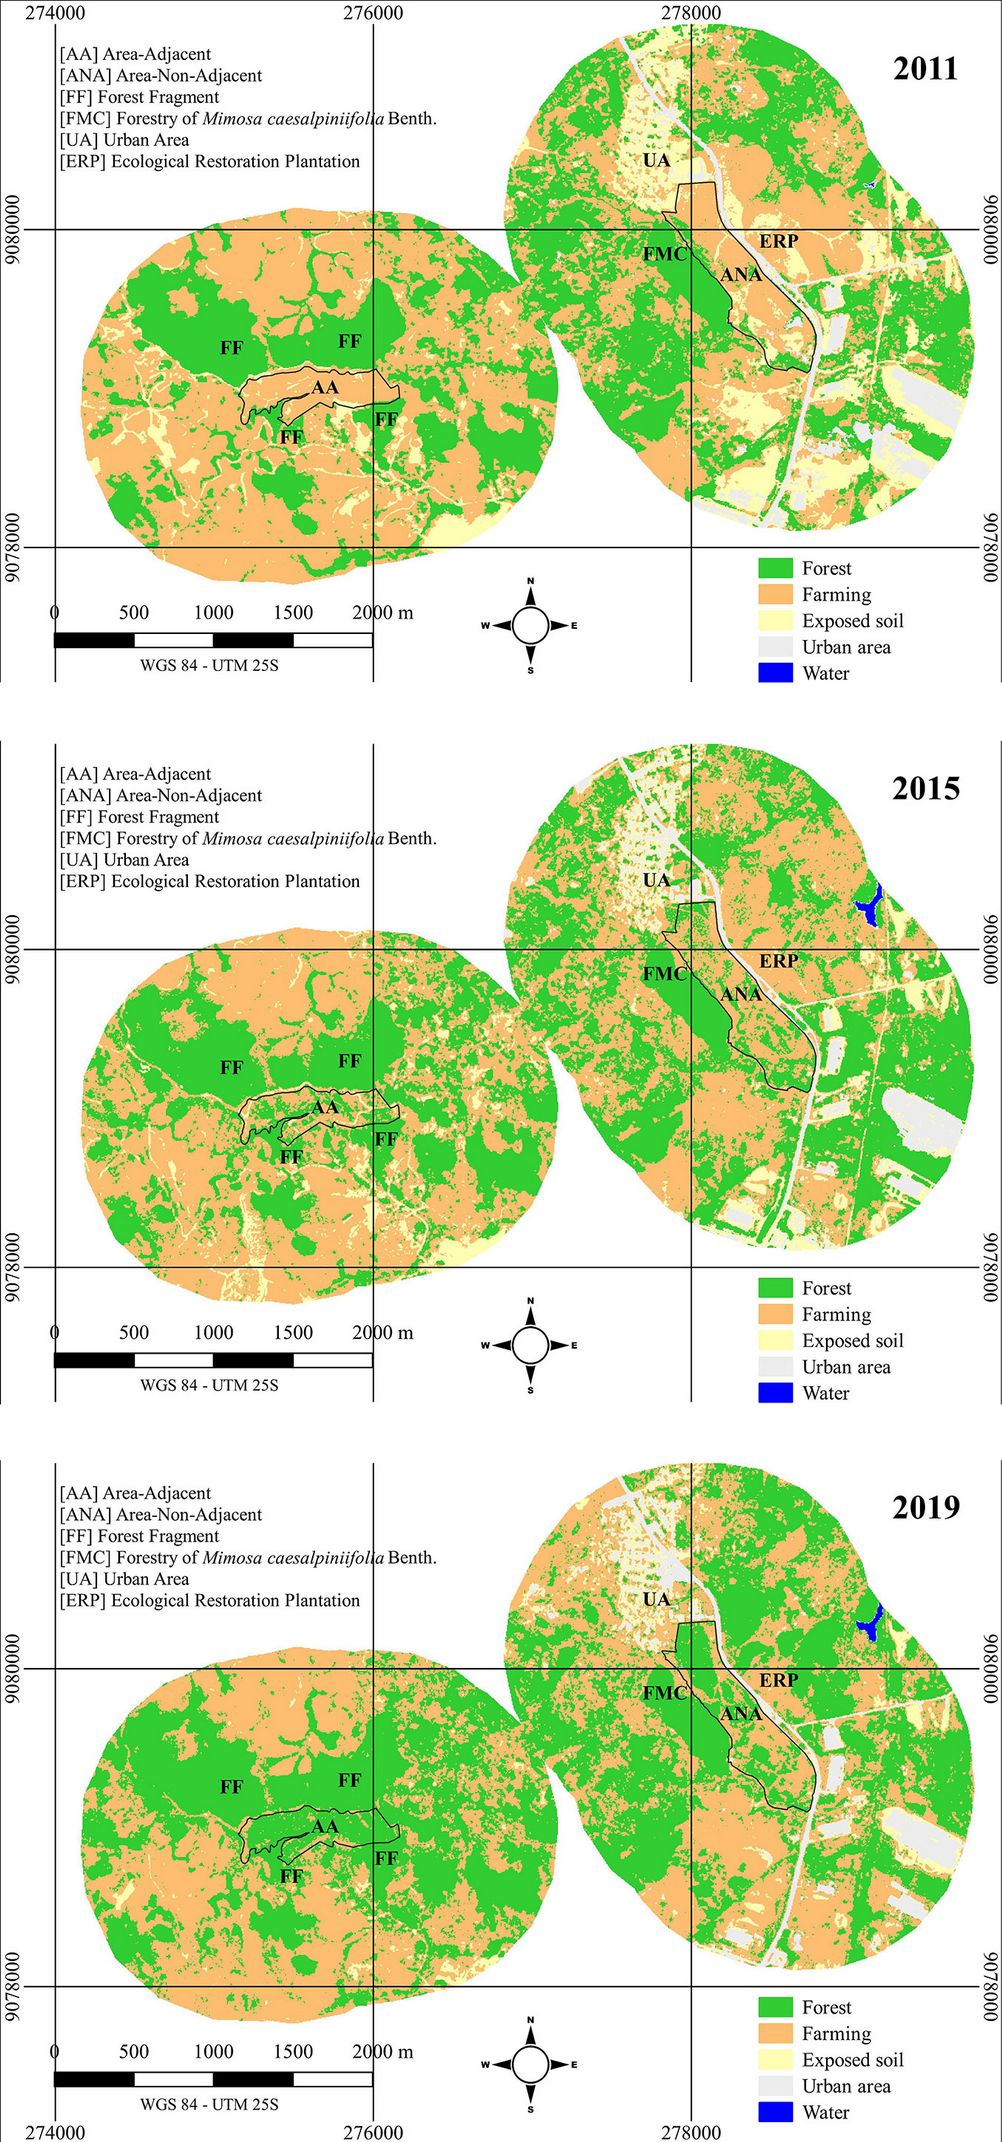
Regarding classification, the classes present in both landscapes are Forest, Farming, and Exposed Soil, while Urban Area and Water are only found in ANA (Fig. 4). The development of tree species in both AA and ANA over time is remarkable, and it is evident that not only the restoration areas but also their surroundings have changed.
Fig. 4 - Maximum likelihood supervised classification of the surrounding landscape of two ecological restoration plantations on March 12, 2011 (one month before planting, top panel), August 9, 2015 (almost four years after planting, middle), and October 9, 2019 (nearly eight years after planting, bottom). ANA is non-adjacent to native fragments, and AA is adjacent to native fragments in Cabo de Santo Agostinho, PE, Brazil.
Despite the quality of the Kappa index shown in Tab. 4, it is important to consider that both landscapes contain sites planted with exotic tree species, such as Mangifera indica L., Syzygium cumini L., Elaeis guianensis Jacq., Artocarpus heterophyllus Lam., and Syzygium jambos (L.) Auston, among others.
Tab. 4 - Kappa and landscape metrics for the classes in the surrounding landscape of two ecological restoration plantations on 12/03/2011 (one month before planting), 09/08/2015 (almost four years after planting), and 09/10/2019 (nearly eight years after planting). ANA is non-adjacent to native fragments, and AA is adjacent to native fragments in Cabo de Santo Agostinho, PE, Brazil. (EL): edge length; (NP): number of patches; (ADJ): like adjacencies; (SI): splitting index; (FDI): fractal dimension index; (MPSR): mean patch shape ratio.
| Area-Year | Class | Kappa | Area (ha) | Perc(%) | EL (km) | NP | ADJ | SI | FDI | MPSR |
|---|---|---|---|---|---|---|---|---|---|---|
| ANA-2011 | Forest | 1.00 | 258.2 | 37.8 | 231.7 | 871 | 0.798 | 34 | 1.070 | 2.74 |
| Farming | 0.88 | 265.9 | 39.0 | 305.6 | 1332 | 0.749 | 49 | 1.083 | 1.38 | |
| ExposedSoil | 0.97 | 113.0 | 16.6 | 147.8 | 751 | 0.719 | 417 | 1.075 | 0.91 | |
| UrbanArea | 1.00 | 45.1 | 6.6 | 61.7 | 484 | 0.708 | 1,156 | 1.066 | 0.72 | |
| Water | 1.00 | 0.1 | 0.9 | 0.2 | 3 | 0.352 | 1,970,526 | 1.117 | 0.57 | |
| ANA-2015 | Forest | 0.99 | 285.4 | 41.8 | 293.4 | 1435 | 0.772 | 48 | 1.076 | 2.78 |
| Farming | 0.98 | 294.4 | 43.1 | 353.4 | 1372 | 0.739 | 17 | 1.079 | 1.46 | |
| ExposedSoil | 0.83 | 54.5 | 8.0 | 144.8 | 1211 | 0.501 | 6,463 | 1.086 | 1.01 | |
| UrbanArea | 0.99 | 46.6 | 6.8 | 95.6 | 1054 | 0.592 | 1,773 | 1.069 | 0.80 | |
| Water | 1.00 | 1.5 | 0.2 | 1.1 | 1 | 0.830 | 209,021 | 1.171 | 0.07 | |
| ANA-2019 | Forest | 1.00 | 298.5 | 43.7 | 271.7 | 1413 | 0.796 | 23 | 1.068 | 3.01 |
| Farming | 0.79 | 299.3 | 43.9 | 351.3 | 1045 | 0.744 | 45 | 1.085 | 1.36 | |
| ExposedSoil | 0.90 | 35.2 | 5.2 | 107.0 | 1201 | 0.450 | 12,295 | 1.079 | 1.05 | |
| UrbanArea | 0.99 | 48.0 | 7.0 | 69.6 | 528 | 0.693 | 1.049 | 1.073 | 0.69 | |
| Water | 1.00 | 1.3 | 0.2 | 1.0 | 2 | 0.830 | 285,253 | 1.076 | 0.44 | |
| AA-2011 | Forest | 1.00 | 186.7 | 32.6 | 117.9 | 518 | 0.854 | 105 | 1.079 | 2.27 |
| Farming | 1.00 | 346.8 | 60.7 | 176.6 | 190 | 0.880 | 3 | 1.068 | 1.36 | |
| ExposedSoil | 0.99 | 38.3 | 6.7 | 65.4 | 479 | 0.648 | 3,624 | 1.091 | 0.85 | |
| AA-2015 | Forest | 0.99 | 224.1 | 39.2 | 187.0 | 875 | 0.811 | 23 | 1.077 | 2.67 |
| Farming | 0.91 | 312.6 | 54.7 | 257.8 | 485 | 0.813 | 7 | 1.071 | 1.49 | |
| ExposedSoil | 1.00 | 35.3 | 6.2 | 76.8 | 799 | 0.572 | 6,424 | 1.072 | 0.93 | |
| AA-2019 | Forest | 1.00 | 277.8 | 48.6 | 199.5 | 849 | 0.835 | 6 | 1.068 | 2.82 |
| Farming | 0.91 | 285.8 | 50.0 | 218.8 | 597 | 0.825 | 11 | 1.068 | 1.46 | |
| ExposedSoil | 0.92 | 8.2 | 1.4 | 18.2 | 219 | 0.565 | 63,044 | 1.067 | 0.88 |
It is noteworthy that the M. caesalpiniifolia forest present in ANA was included in the Forest class, considering that it is abandoned and currently hosts early successional species such as Cecropia sp., Tapirira guianenses Aubl., and Miconia sp., functioning as an ecological corridor and improving the classification accuracy. Despite this, its core was not considered in the metric calculations as it does not contribute significantly to this parameter.
Overall, the AA landscape showed an increase of 91.1 ha in forest cover, with the planting area of 21.2 ha only. On the other hand, ANA showed an increase of 40.37 ha, but when accounting for other restoration areas in the surroundings, there was approximately 95 ha of forest cover. These areas experienced a slower restoration; however, there was apparent fragmentation to the north of ANA between 2011 and 2015 and to the east between 2015 and 2019, reducing part of the forest cover in the surrounding areas. Nevertheless, the splitting index shows a general reduction in fragmentation in both landscapes, with AA experiencing a more pronounced reduction.
In Fig. 5a, both landscapes initially contained “very small”, “small”, and “medium” fragments. However, Fig. 5b and Fig. 5c show that since 2015, AA has formed a “large” fragment. In contrast, with the only contribution of the M. caesalpiniifolia forestry, ANA managed to aggregate fragments and form a “large” fragment by 2019.
Fig. 5 - Forest size classes of two ecological restoration plantations on March 12, 2011 (one month before planting, top panel), on August 9, 2015 (almost four years after planting: middle panel), and October 9, 2019 (nearly eight years after planting, bottom panel). ANA is non-adjacent to any native fragments, and AA is adjacent to native fragments, located in Cabo de Santo Agostinho, PE (Brazil).
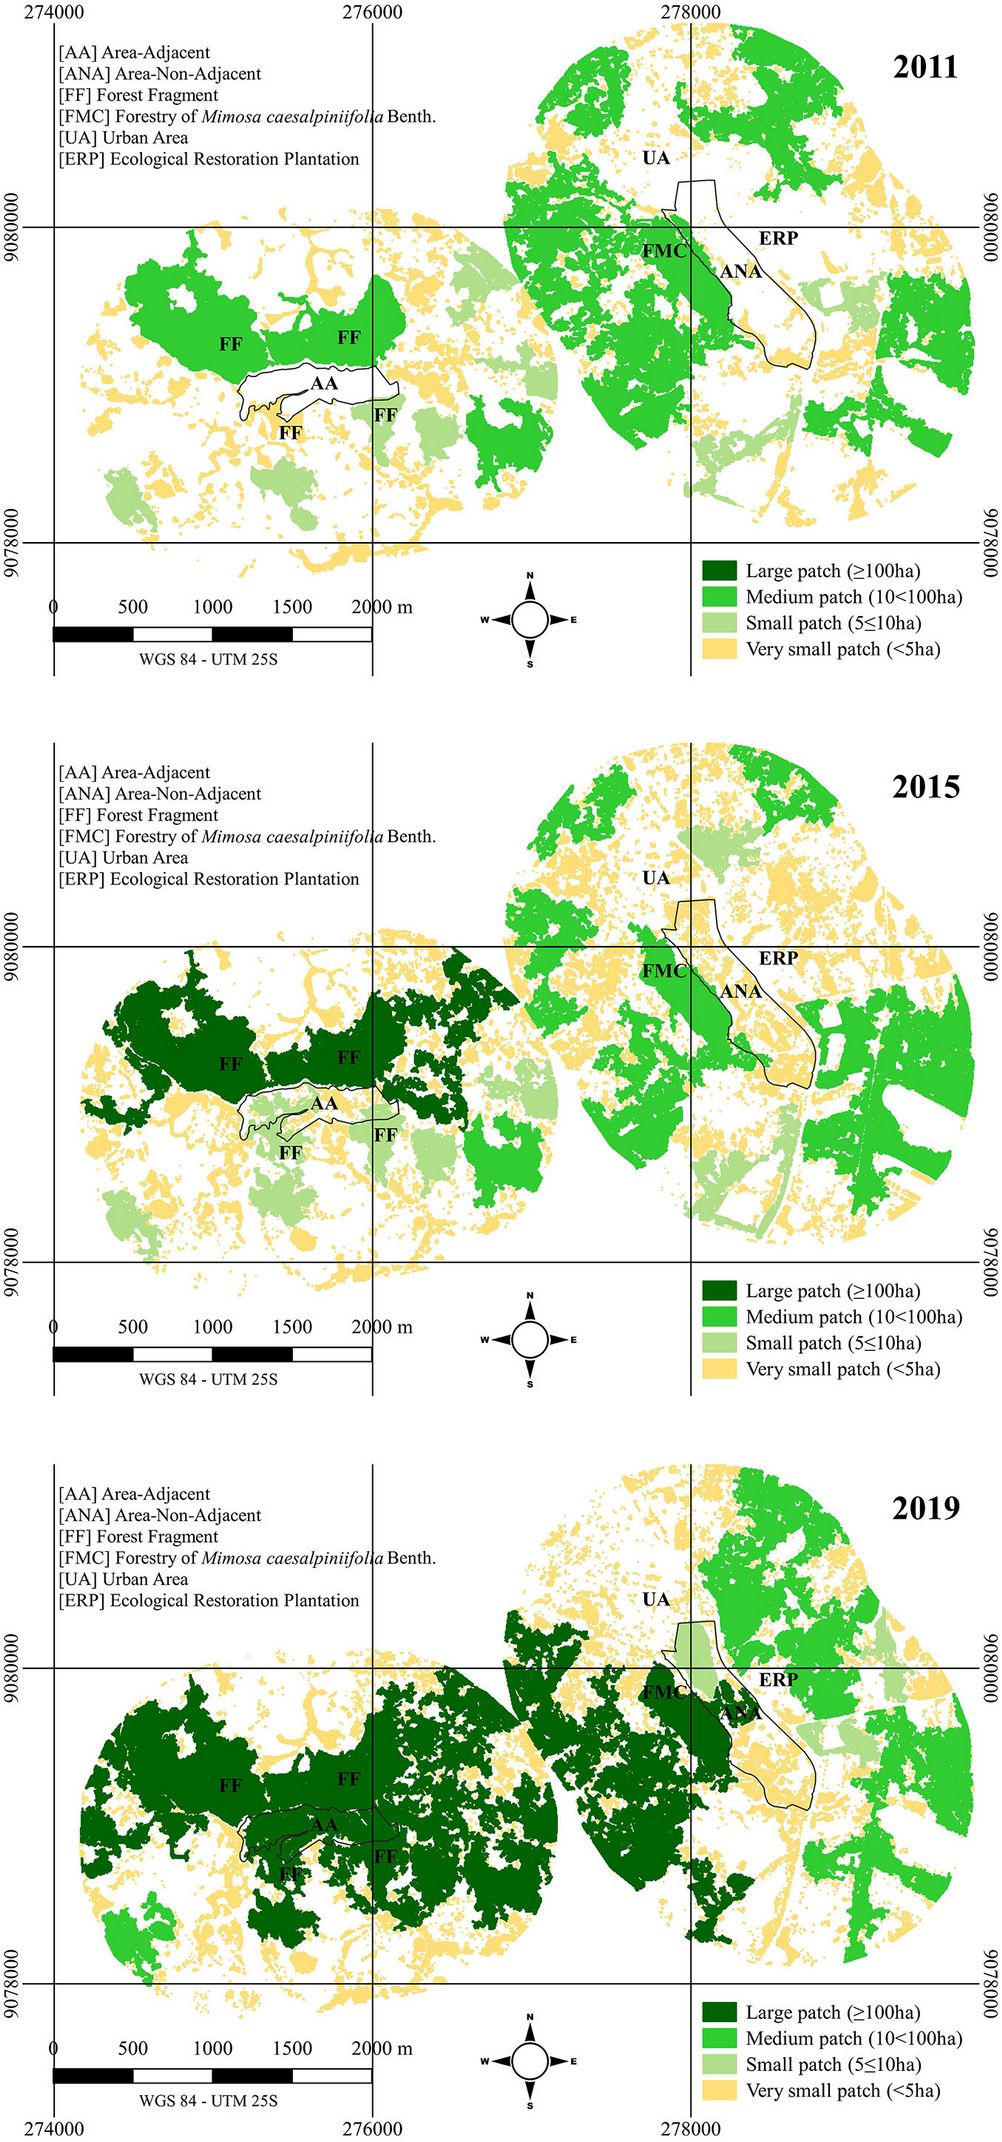
Fig. 5also highlights the importance of adjacent fragments, as AA was able to merge the four adjacent fragments and others nearby. It is worth noting that after silvicultural maintenance in these areas ceased, some of the exposed soil roads providing access to AA have not been maintained, which could potentially reduce vehicle flow.
Comparing 2011 to 2019 (Tab. 5), it is evident that both areas are progressing toward forming a more ecologically stable landscape. However, AA displays higher growth rates and uniformity indicators, with a larger area and less fragmentation, particularly in the larger forest size classes (medium and large).
Tab. 5 - Landscape metrics for forest size classes in the surrounding landscape of two ecological restoration plantations on 12/03/2011 (one month before planting), 09/08/2015 (almost four years after planting), and 09/10/2019 (almost eight years after planting). ANA is non-adjacent to any native fragments, and AA is adjacent to native fragments in Cabo de Santo Agostinho, PE (Brazil). (EL): edge length; (NP): number of patches; (MPA): mean patch area; (Core): -10 m; (ADJ): like adjacencies; (SI): splitting index; (FDI): fractal dimension index.
| Area/Year | Class | Area (ha) | Perc (%) | EL (km) | NP | MPA (ha) | Core (ha) | ADJ | SI | FDI |
|---|---|---|---|---|---|---|---|---|---|---|
| ANA2011 | VerySmall | 48.5 | 18.8 | 95.7 | 863 | 0.06 | 7.54 | 0.604 | 43 | 1.068 |
| Small | 16.3 | 6.3 | 14.6 | 2 | 8.15 | 5.30 | 0.799 | 2 | 1.327 | |
| Medium | 193.4 | 74.9 | 121.4 | 6 | 32.24 | 83.37 | 0.855 | 5 | 1.346 | |
| ANA2015 | VerySmall | 93.6 | 32.8 | 177.6 | 1427 | 0.07 | 13.88 | 0.617 | 60 | 1.075 |
| Small | 22.8 | 8.0 | 17.8 | 3 | 7.61 | 10.80 | 0.822 | 3 | 1.301 | |
| Medium | 168.9 | 59.2 | 98.0 | 5 | 33.79 | 74.88 | 0.865 | 3 | 1.347 | |
| ANA2019 | VerySmall | 58.6 | 15.9 | 131.2 | 1407 | 0.04 | 7.48 | 0.563 | 63 | 1.065 |
| Small | 19.0 | 5.3 | 12.4 | 3 | 6.32 | 9.65 | 0.849 | 3 | 1.256 | |
| Medium | 118.1 | 45.0 | 68.3 | 2 | 59.03 | 64.38 | 0.865 | 2 | 1.363 | |
| Large | 102.9 | 33.8 | 59.8 | 1 | 102.87 | 41.69 | 0.865 | 1 | 1.389 | |
| AA2011 | VerySmall | 61.0 | 32.7 | 79.8 | 509 | 0.12 | 16.05 | 0.719 | 38 | 1.075 |
| Small | 41.9 | 22.4 | 19.2 | 6 | 6.98 | 26.07 | 0.892 | 6 | 1.192 | |
| Medium | 83.8 | 44.9 | 18.9 | 3 | 27.94 | 68.49 | 0.945 | 3 | 1.180 | |
| AA2015 | VerySmall | 58.8 | 26.3 | 107.9 | 867 | 0.07 | 9.61 | 0.627 | 49 | 1.075 |
| Small | 47.9 | 21.4 | 30.4 | 6 | 7.99 | 24.89 | 0.853 | 6 | 1.257 | |
| Medium | 16.7 | 7.4 | 5.4 | 1 | 16.68 | 12.29 | 0.922 | 1 | 1.200 | |
| Large | 100.7 | 44.9 | 43.3 | 1 | 100.65 | 66.94 | 0.898 | 1 | 1.344 | |
| AA2019 | VerySmall | 47.3 | 17.0 | 91.9 | 847 | 0.06 | 7.99 | 0.609 | 42 | 1.066 |
| Medium | 10.8 | 3.9 | 6.1 | 1 | 10.81 | 6.15 | 0.868 | 1 | 1.265 | |
| Large | 219.8 | 79.1 | 101.5 | 1 | 219.76 | 140.45 | 0.891 | 1 | 1.389 |
Discussion
Although the use of NDVI has limitations, such as its inability to differentiate successional stages or specific types of vegetation ([13]), this study demonstrated that it is an effective tool for monitoring vegetation development over time in restoration areas and in the landscape as a whole. This result is in line with similar studies in tropical biomes, such as that conducted by Chazdon & Guariguata ([8]), which proved the usefulness of NDVI in tracking vegetation cover growth in restored areas. In the Atlantic Forest context, vegetation indices have been widely applied to assess the success of ecological restoration initiatives, especially in fragmented landscapes.
A more detailed analysis of the NDVI data also reveals essential patterns in the effectiveness of the applied restoration techniques. By correlating variations in vegetation indices over the years with specific landscape fragmentation metrics, it was possible to identify a continuous improvement in the ecosystem’s health in the restoration areas. Similar studies in the Atlantic Forest ([10], [21]) suggest that the increase in NDVI is directly related to biomass growth and the establishment of secondary forests, reinforcing the applicability of this index for long-term monitoring in restored landscapes.
The forest classification showed the fragments are becoming more connected, with an apparent link between AA and ANA in 2019. This indicates a trend toward gap closure, which favors forest-dependent species by increasing the mobility of individuals between fragments ([11]), improving parameters of richness, diversity, and structure ([22]), supporting ecological processes such as dispersal and gene flow ([24]), and enhancing functionality by forming larger systems rather than isolated units ([28]).
The original restoration plantations seem to have reached a stage where they significantly affect changes in the landscape. Therefore, it would be highly relevant to study floristic, diversity, and structural changes in the ecological restoration areas and the surrounding regions. Cai et al. ([7]) highlighted that although restoration efforts are often localized, their impact on the surrounding community can be profound.
Analyzing the spatial distribution of all Atlantic Forest remnants in Brazil, Ribeiro et al. ([35]) observed that 83.4% of the remaining fragments are smaller than 50 ha (204.469 fragments). Given the average size of these fragments, it is possible to anticipate that strategic ecological restoration plantations can significantly increase forest areas in less than a decade. Since fragmentation reduces core areas ([44]), it is evident that AA had a more efficient development, with a 44-ha increase in the core area over eight years, compared to ANA (only 27 ha).
The comparison between AA and ANA areas shows significant differences in fragmentation and connectivity, directly impacting the success of restoration initiatives. Despite its smaller restoration area, AA showed a proportionally more significant increase in its core area. This more efficient development can be attributed to AA’s strategic location, which facilitates the reconnection between nearby forest fragments, creating ecological corridors that enhance biological diversity and the resilience of the restored landscape ([6]). On the other hand, ANA still faces challenges due to its greater initial fragmentation, requiring a longer period for connectivity between fragments to be restored.
The fragmentation metrics used, such as the fractal shape index and the number of fragments, provide important information about the dynamics of landscape connectivity. The high fractal shape index in restored areas indicates greater complexity in the shape of the fragments, which can influence the landscape’s functional connectivity. According to Diniz et al. ([10]), the complexity in the shape of the fragments may favor species colonization and improve ecological resilience. Additionally, the reduction in the number of fragments reflects a trend toward the unification of previously isolated areas, which may favor species’ mobility and optimize essential ecological processes such as seed dispersal and gene flow.
Moreover, the impact of ecological restoration plantations on the surrounding landscape must be considered. Cai et al. ([7]) emphasized that, although restoration efforts are often localized, their effect on the surrounding community can be significant, influencing fragmentation dynamics and vegetation structure.
According to Luz et al. ([21]), prior land uses and covers and the landscape configuration are crucial in restoration projects, as these significantly impact the entire process, especially seed dispersal ([21]) and site natural regeneration ([5]). In this sense, the floristic and structural analysis should not be limited to the restoration areas but should also include the surrounding regions, which can be positively impacted by the expansion of restored forest fragments.
It is important to contextualize the study in light of recent studies on ecological restoration and habitat fragmentation in the Atlantic Forest and other tropical biomes. Ribeiro et al. ([35]) observed that most of the remaining fragments in the Atlantic Forest are smaller than 50 ha. This highlights the importance of ecological restoration strategies to increase the size and connectivity of these areas. In a more recent study, Luz et al. ([21]) showed how increased connectivity in fragmented landscapes can promote the recovery of essential ecosystem services, such as climate regulation and biodiversity maintenance.
Finally, the results of this study also have practical implications for public policies and conservation strategies. The connectivity observed between forest fragments in the AA and ANA areas, evidenced by the reduction in fragmentation and the increase in the core area, suggests that ecological restoration can play a key role in biodiversity maintenance and improving ecosystem services. Policies such as the National Plan for Native Vegetation Recovery (PLANAVEG) and initiatives like the Atlantic Forest Restoration Pact have focused on increasing connectivity between fragments, and the findings of this study corroborate the feasibility of such initiatives. The formation of ecological corridors can facilitate gene flow between isolated populations ([10]), favoring species dependent on continuous forest habitats ([24]).
Conclusions
From an ecological perspective, the working hypothesis of this study has been confirmed. After eight years since restoration plantation, local fragmentation has been reduced by aggregating patches and forming larger fragments.
The key findings include: (i) the local landscape both influences and is influenced by restoration plantations; (ii) smaller, strategically located restoration plantations can contribute more than larger, isolated ones; (iii) the area adjacent to fragments exhibited more uniform development and a denser canopy; (iv) the “Farming” and “Exposed Soil” classes showed potential for conversion to forest areas.
Acknowledgments
This study was partly financed by the Coordination for the Improvement of Higher Education in Brazil. Personnel - Brazil (Coordenação de Aperfeiçoamento de Pessoal de Nível Superior - CAPES) - Finance Code 001. The authors thank the Complexo Industrial Portuário Governador Eraldo Gueiros (SUAPE) for allowing this research.
References
CrossRef | Gscholar
CrossRef | Gscholar
Gscholar
Authors’ Info
Authors’ Affiliation
Ana Lícia Patriota Feliciano 0000-0001-8423-141X
Luiz Carlos Marangon 0000-0002-8637-2125
Marília Isabelle Oliveira Da Silva 0000-0002-5506-8884
Emanuel Araújo Silva
Rural Federal University of Pernambuco, Dom Manuel de Medeiros Street, Dois Irmãos, 52171-900, Recife, PE (Brazil)
Arliston Pereira Leite 0000-0003-1981-2319
Federal University of Campina Grande, Paraíba, Brazil Avenue Universitária, s/n - Santa Cecilia, 58708-110, Patos, PB (Brazil)
Corresponding author
Paper Info
Citation
Pimentel DJO, Feliciano ALP, Marangon LC, Pessoa MMDL, Da Silva MIO, Leite AP, Silva EA (2025). Can the dynamics of forest restoration reduce landscape fragmentation in the Atlantic forest?. iForest 18: 61-68. - doi: 10.3832/ifor4639-018
Academic Editor
Luigi Saulino
Paper history
Received: May 15, 2024
Accepted: Jan 24, 2025
First online: Apr 04, 2025
Publication Date: Apr 30, 2025
Publication Time: 2.33 months
Copyright Information
© SISEF - The Italian Society of Silviculture and Forest Ecology 2025
Open Access
This article is distributed under the terms of the Creative Commons Attribution-Non Commercial 4.0 International (https://creativecommons.org/licenses/by-nc/4.0/), which permits unrestricted use, distribution, and reproduction in any medium, provided you give appropriate credit to the original author(s) and the source, provide a link to the Creative Commons license, and indicate if changes were made.

Web Metrics
Breakdown by View Type
Article Usage
Total Article Views: 10747
(from publication date up to now)
Breakdown by View Type
HTML Page Views: 4058
Abstract Page Views: 3899
PDF Downloads: 2485
Citation/Reference Downloads: 6
XML Downloads: 299
Web Metrics
Days since publication: 484
Overall contacts: 10747
Avg. contacts per week: 155.43
Article Citations
Article citations are based on data periodically collected from the Clarivate Web of Science web site
(last update: Jul 2026)
Total number of cites (since 2025): 1
Average cites per year: 0.50
Publication Metrics
by Dimensions ©
Articles citing this article
List of the papers citing this article based on CrossRef Cited-by.
Related Contents
iForest Similar Articles
Review Papers
The role of spatial criteria in enhancing forest restoration actions: a systematic review
vol. 19, pp. 157-167 (online: 11 May 2026)
Research Articles
Effect of restoration methods on natural regeneration in the Brazilian Atlantic Forest
vol. 18, pp. 23-29 (online: 15 February 2025)
Research Articles
Post-fire recovery of the plant community in Pinus brutia forests: active vs. indirect restoration techniques after salvage logging
vol. 11, pp. 635-642 (online: 04 October 2018)
Research Articles
Tropical seedling performance under drought: a functional trait approach for species selection in restoration
vol. 19, pp. 9-17 (online: 10 January 2026)
Review Papers
Shaping the multifunctional tree: the use of Salicaceae in environmental restoration
vol. 6, pp. 37-47 (online: 21 January 2013)
Research Articles
Nutrient cycling indicators in different models of successional groups and spacing for forest restoration
vol. 19, pp. 61-68 (online: 23 February 2026)
Research Articles
Three prescribed fire regimes on the restoration of flooded savannah grasslands under encroachment of Vochysia divergens Pohl, Pantanal, Brazil
vol. 17, pp. 165-171 (online: 17 June 2024)
Research Articles
Approaches to classifying and restoring degraded tropical forests for the anticipated REDD+ climate change mitigation mechanism
vol. 4, pp. 1-6 (online: 27 January 2011)
Research Articles
The effect of calcium on the growth of native species in a tropical forest hotspot
vol. 11, pp. 221-226 (online: 01 March 2018)
Research Articles
Outplanting performance of three provenances of Quillaja saponaria Mol. established in a Mediterranean drought-prone site and grown in different container size
vol. 13, pp. 33-40 (online: 21 January 2020)
iForest Database Search
Google Scholar Search
Citing Articles
Search By Author
Search By Keywords


