Comparison of wood stack volume determination between manual, photo-optical, iPad-LiDAR and handheld-LiDAR based measurement methods
iForest - Biogeosciences and Forestry, Volume 16, Issue 4, Pages 243-252 (2023)
doi: https://doi.org/10.3832/ifor4153-016
Published: Aug 23, 2023 - Copyright © 2023 SISEF
Research Articles
Abstract
The measurement of roadside wood stacks in the forest still plays an important role in many forestry operations. Traditional manual measuring methods can be laborious, inaccurate and error-prone. Therefore, the issue is whether 2.5D or 3D optical remote sensing measuring methods provide more precise or detailed results and advantages in further data processing. This study examined and partly developed nine different manual, photo-optical, iPad®-LiDAR and handheld laser scanner-LiDAR-based wood stack measurement methods. Forty-seven wood stacks, ranging from 8.9 to 209.3 m3 (totalling approximately 2700 m3), were measured and compared using these nine methods. All the methods give volume estimations, and none can be seen to give the real or true wood stack gross volume. Surprisingly, the results varied significantly within and between the individual methods, with up to a 9% mean relative deviation. The relative deviation is strongly dependent on the size of the wood stack. The 3D measurement methods using iPad® RGB and LiDAR recorded lower timber volumes than the other methods, in contrast to the method based on samples taken with handheld laser scanner-LiDAR, which overestimated the volume. Generally, optical- and laser-based surveying techniques could be more widely applied in measuring wood stacks in the future. However, such automatic wood stack gross volume determination approaches still face some challenges, regarding accuracy in the case of the 2.5D methods and the lack of automatisation in the case of 3D methods. Consequently, further research is required in the near future.
Keywords
iPad LiDAR, Wood Stack Volume, 3D Volume, Photo-optical Measurement, Personal Laser Scanner, SLAM, RVR
Introduction
Intermediate storage, legal transfer of ownership and related log measurements are all important aspects of the timber harvesting and transportation process. Precise knowledge of harvested and saleable volumes is essential for an agreement between forest owners and wood buyers, as well as to the planning of logistics. This is especially true in the case of industrial wood used for engineered wood products or the pulp and paper industry, with relatively low requirements regarding quality grading, which are thus sold in stacks to facilitate the measurement process ([31]). In the case of higher-value timber assortments, such as sawn timber, where the wood is measured with a high-precision scanner in the sawmill ([25]), the measurement of the wood stacks in the forest still plays an important role. Wood stock measurement in the forest might still be essential for companies for documentation and verification purposes, as a sales measure, and for logistic distribution purposes ([24], [4]). In addition, the efficient and accurate measurement of wood stacks is of economic importance; timber sales are still the main source of income of most forestry companies.
Traditionally, in Germany, timber measurement at the roadside is carried out via time-consuming, ground-based manual procedures, according to the wood measurement guidelines outlined in the framework agreement for roundwood trade in Germany, which is known in German by its acronym RVR ([38]). Due to developments in sensor and camera technology, as well as optical image recognition and segregation technologies, progress is being made in developing optical-based wood stack measurement applications for utilisation in the forestry sector. This includes cameras mounted on forest machines or cars ([32], [24], [11]) and applications for portable devices such as smartphones ([20], [24], [29], [22], [14]). Both are used to assess the volumes of wood stacks, where the estimation is based on the stack’s front surface area, which is calculated from photos taken with portable devices. An average log length must then be included in the volume calculation, and hence this approach is mainly suited to cut-to-length type operations. The gross wood stack volume (timber solid volume and air spaces between logs) can then be estimated by multiplying the calculated front surface area by the logs’ length and the stack’s depth. Previous studies comparing gross stack volumes using both the photo-optical- and the manual section-based methods showed high correspondence rates between the results ([5], [8], [7]). It further could be shown that the deviation of the manually measured stack volumes from the optically derived volumes is especially dependent on the assortment of the wood (high-quality stem wood for utilisation in sawmilling industry versus low-quality industrial wood for utilisation in board industry). In addition, the influences of stacking quality and weather conditions (e.g., snow) are assumed to affect the measurement results. However, for small stacks and stacks of low quality, the deviations between the stack volume determinations increased significantly ([4]).
Although applications for wood stack volume assessments are becoming more popular, they are as yet not widely used in Central Europe. Photo-optical measurement methods in particular have gained increasing attention, and several apps are available on the market, e.g., TIMBETER, iFOVEA and LogStackPro. Currently, only two methods have been assessed for conformity by the relevant institute in Germany (PTB, Physikalisch-Technische Bundesanstalt/National Metrology Institute of Germany). This fulfils the legal requirements related to official billing processes in Germany ([4], [22]). Photo-optical timber measurement systems are based on image processing technologies that often use machine learning and artificial intelligence, especially for the accurate detection of the log’s front surface ([6], [44]). As little is known regarding the practical implementation of these technologies and devices in daily work, forest companies often still use the traditional manual section-based method. In this method, several heights and other parameters of wood stacks must be measured manually. This is time-consuming when applied to large wood stacks, and its reproducibility is limited. Compared to the manual section-based method, the advantages of photo-optical systems include their timesaving potential, and the documentation of the measurements derived from wood stack high-resolution images ([23], [34], [42]). Moreover, digital timber measurement methods can be integrated into the wood supply chain by automatically transferring measuring results and other information, such as the geolocation of the wood stacks. The benefits of this integration are the possibility of displaying the wood stacks on a map, increased transparency for both log buyers and sellers, increased efficiency, and a reduction in illegal logging operations ([42], [44]).
The present photo-optical wood stack measurement methods used in business processes are based on the measuring of the front surface. For larger wood stacks, several images have to be taken manually or in an automated image series, equalised, and stitched together ([12], [19], [26], [14]). Some methods additionally light the stacks for night photography ([32]). The front surface area is usually recognised automatically and can be corrected manually, or timber log detection and segmentation can be done via pictures ([18], [21], [26], [37]). These are 2D methods wherein the depth information (log or sale length) is added manually to calculate the volume.
True 3D measurements of wood stacks can be derived from different overlapping RGB pictures (e.g., drone mapping), LiDAR-based measurements (e.g., use of GeoSLAM ZEB HORIZON®), or a combination of both (e.g., using an iPad Pro®). Long-range, high-speed personal laser scanners (PLS) with simultaneous localisation and mapping (SLAM) technology (GeoSLAM ZEB HORIZON - [15]), as well as customer smartphone-based LiDAR sensors such as the iPad®, are able to estimate wood stack gross volumes based on point clouds or 3D mesh triangles. Stack volume estimation using true 3D methods measures all sides of the wood stacks, and the definition of the bottom is used as a volume boundary. Due to the lack of algorithms developed to conduct this estimation, this process currently represents an important challenge to be overcome.
Scale referencing of the recorded pictures is still a challenge when using RGB camera-based optical methods. There are several solutions to this problem. One possibility is using a stereo camera system, with a known distance between the cameras. Based on the difference between the photos taken and the determined depth information, a reference scale and the picture size can be calibrated ([25], [22]). Mono camera methods use a manual reference scale, installing a reference bar or measuring the length of the wood stack ([14], [33]). Single or combined LiDAR systems can provide these reference scales. Therefore, such laser-based remote sensing methods can remedy this situation, and they provide efficient and accurate methods for measuring wood stacks.
The aim of this study was (i) to analyse the suitability of photo-optical- and laser-based remote measurement methods in terms of the capability to provide reliable mesurement results, and (ii) to better understand deviations in wood stack gross volume measurements between different measurement systems.
Materials and methods
Area of study and collection data
The measurements took place during two days (November 2021) in the area of “Tharandter Wald” in Saxony, Germany. The measurement methods were largely applied to the same wood stacks as found in the forests, which is essential when analysing the performance of such measurement methods ([21]). All stacks were mainly composed of Norway spruce logs (Picea abies L.). A few piles of wood contained isolated pine (Pinus sylvestris L.) or larch (Larix decidua Mill.) logs. Each measurement system was operated by the same skilled user throughout the whole study to minimise human influence.
Two different assortments were studied: LAS (logs of fixed lengths), which refers to high-quality timber dedicated to the sawmilling industry with assortment lengths between 3 and 6 meters, and industrial wood, i.e., wood of lower quality (in terms of diameter and qualitative attributes), which is used in engineered wood products or pulp production, with assortment lengths between 2 and 3 m.
In the study, around 2.654 m3 of stacked roundwood was measured across 47 wood stacks, using nine different methods. The measured gross stack volumes ranged from 8.89 to 209.3 m3, with an average of 56.5 m3. The distribution of the wood stack volume was: <10 m3 (2 stacks); 10-20 m3 (7 stacks); 20-30 m3 (8 stacks); 30-40 m3 (4 stacks); 40-50 m3 (5 stacks); 50-60 m3 (2 stacks); 60-70 m3 (7 stacks); 70-100 m3 (6 stacks); 100-200 m3 (5 stacks); >200 m3 (1 stacks).
Wood stack measurement methods
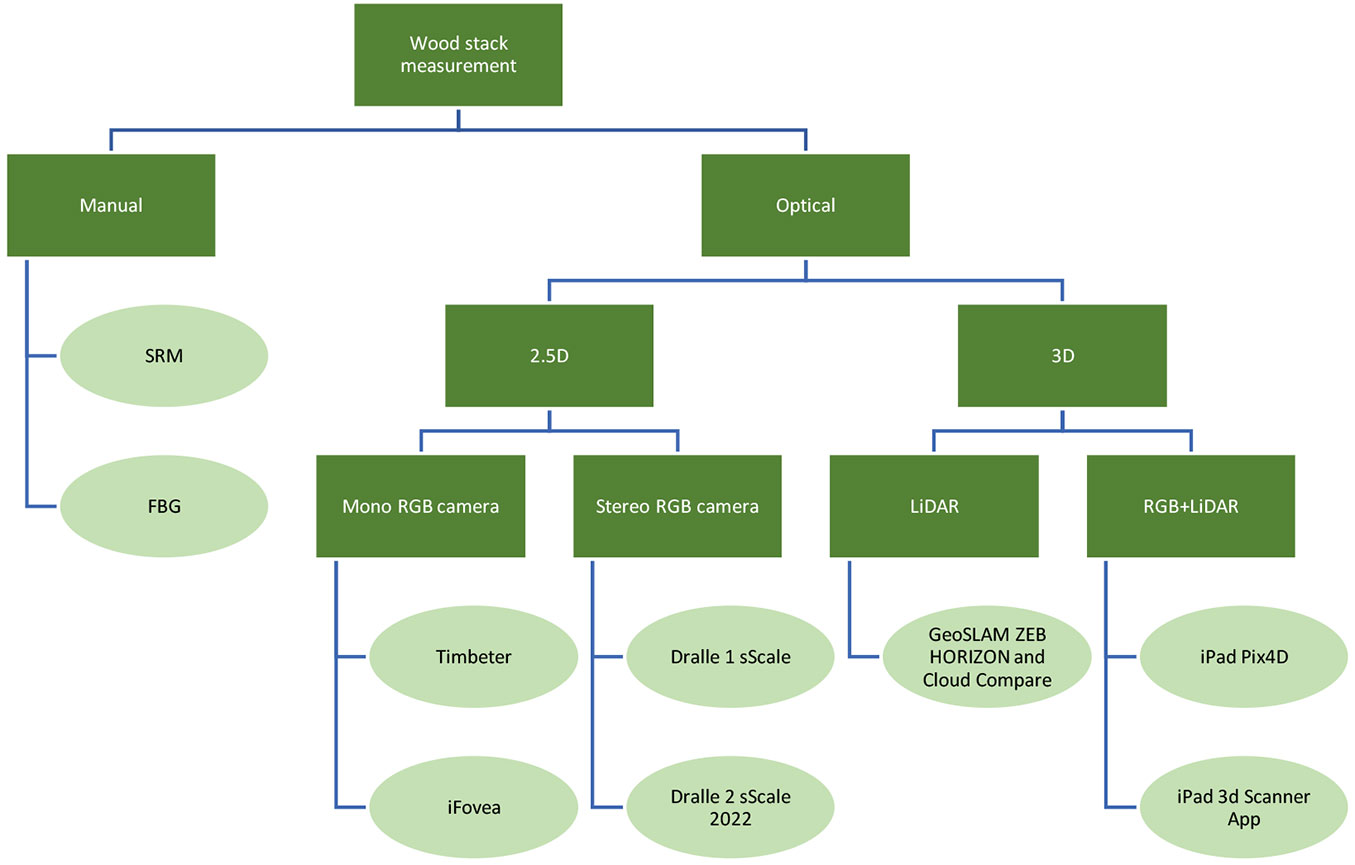
The wood stacks were measured using nine different new and traditional measurement methods. Fig. 1 shows the measurement concepts and methods. Two of them (SRM: Sektionsraummaß - manual section-based method; FBG: Forstbetriebsgemeinschaft - Forest Owner Association) are manual section-based methods that adhere to the wood measurement guidelines of the German RVR ([38]). Seven optical measurement methods have been included. Of these, four are based on the wood stack’s front surface measurement (2.5D): (i) iFovea™ app (SDP Digitale Produkte GmbH, Waiblingen, Germany - ⇒ https://www.fovea.eu/); (ii) Timbeter® app (Timbeter, Tallinn, Estonia - ⇒ https://timbeter.com/); (iii) sScale™ (Dralle A/S, Hoersholm, Denmark - ⇒ https://www.dralle.dk/sscale), version in use at the time; (iv) sScale, version that was launched in 2022. While three are based on three-dimensional measurement (3D) with the determination of the stack’s volume: (i) GeoSLAM ZEB HORIZON™ (GeoSLAM Ltd., Nottingham, UK - ⇒ https://geoslam.com/), using the open source software Cloud Compare ([17]); (ii) iPad Pro™ ([1]), using the app PIX4Dcatch™ (Pix4D S.A., Prilly, Switzerland - ⇒ https://www.pix4d.com/product/pix4dcatch/); (iii) iPad Pro™ (using the 3D Scanner App™ - ⇒ https://apps.apple.com/it/app/3d-scanner-app/id1419913995).
Fig. 1 - Analysed wood stack volume measurement concepts and methods.
Manual section-based method
Wood stacks are commonly measured using the manual section-based method according to the German wood measurement guidelines ([38]). The manual section-based method determines the timber volume in (stacked) cubic meters over the bark (m³ o.b.) of industrial and energy wood stacks. In our study, each of the fixed-length wood stacks was divided into equal-length sections according to the RVR. The section length depends on the total wood stack length and increases with increasing stack length. The last section of the stack is generally shorter than one full section and is therefore measured separately. The section heights are measured with a calibrated measuring rod in the middle of each section, and the mean height is calculated. The gross stack volume can be calculated by multiplying the mean height, the length and the depth of the stack (i.e., the assortments length). The same is done separately for the last (shorter) section of the stack, and the final total is the sum of all the sections.
In this study, ten wood stacks were measured by the relevant forestry contractor beforehand. The measurements were made using the mentioned manual section-based measurement method (SRM) without the consideration of the scientific measuring campaign of any contractor.
The measurements and analyses recorded by the relevant forestry contractor are abbreviated as “FBG”, and the measurements carried out by scientists are abbreviated as “SRM”. Both were taken according to the method outlined in the RVR.
Mono RGB camera-based measurement
Photo-optical wood stack measurement systems based on mono RGB cameras have been developed for use with standard portable devices, such as smartphones and tablets. For the estimation of gross stack volumes, two widespread in-app measurement systems have been used in this study: iFOVEA and Timbeter. In both, the system stitches the photos of the stack’s front area, taken by the user, into one picture. The means of taking the images are similar in both systems. It is noteworthy that the mobile device (smartphone or tablet) must be held parallel to the stack; a constant distance from the stack must be maintained, and the photos must be taken with an image overlap of 60%.
During recording, the applications indicate whether the mobile device should be held parallel or whether the overlapping of the photos is sufficient. Moreover, several parameters must be included in the recording, particularly a spatial reference length. In the case of Timbeter, an object with a determined dimension must be placed on the stack side as a measurement reference, while iFOVEA uses the manually measured stack length. The gross stack volume is then calculated based on the stack’s front area and the timber assortment’s length, which is entered manually in the app.
Both apps automatically detect contours and/or single stems (Fig. 2). However, Berendt et al. ([4]) pointed out that the postprocessing of the automatically detected contour is generally necessary. Therefore, the contour is edited manually after picture stitching to better fit the natural stack contour. When using the contour function in iFovea, there is no additional single stem detection, so conclusions on the average diameter cannot be drawn.
Fig. 2 - Example of wood stack recorded with a mono camera photo-optical system (Timbeter).
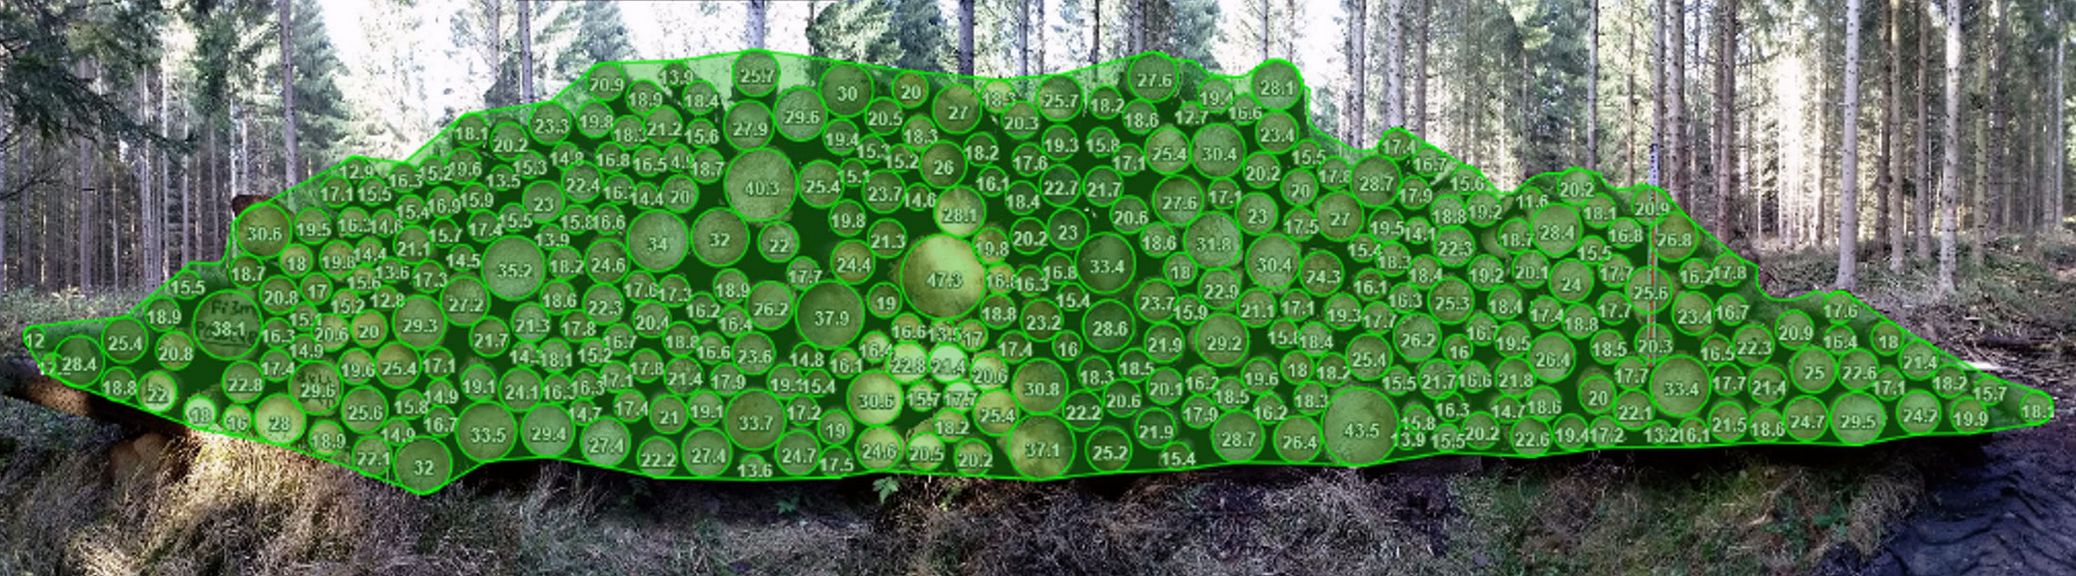
It must be pointed out that while Timbeter directly estimates the solid wood content and the conversion factor (known in the app as the density factor), the app iFovea directly estimates the gross volume. Therefore, the gross stack volume must be deduced from the results provided by the Timbeter app by dividing the solid wood content by the density factor.
The measurements and analyses performed via the iFOVEA app are abbreviated as “FV”, and those recorded with the Timbeter app are abbreviated as “TB”.
Stereo RGB-camera based measurement
The sScale measurement method of Dralle A/S is based on stereo camera technology with a known distance between the cameras (Fig. 3). The camera system is generally mounted on the car top and connected with the onboard computer for all analyses, and the Dralle server is used for wood stack management (Fig. 3).
Fig. 3 - Dralle sScale™ system mounted on a car in front of a wood stack with a stereo camera and three LED light panels in between for operation at nighttime (upper part). Stitched images and edge detection of a wood stack measured with sScale (lower part).
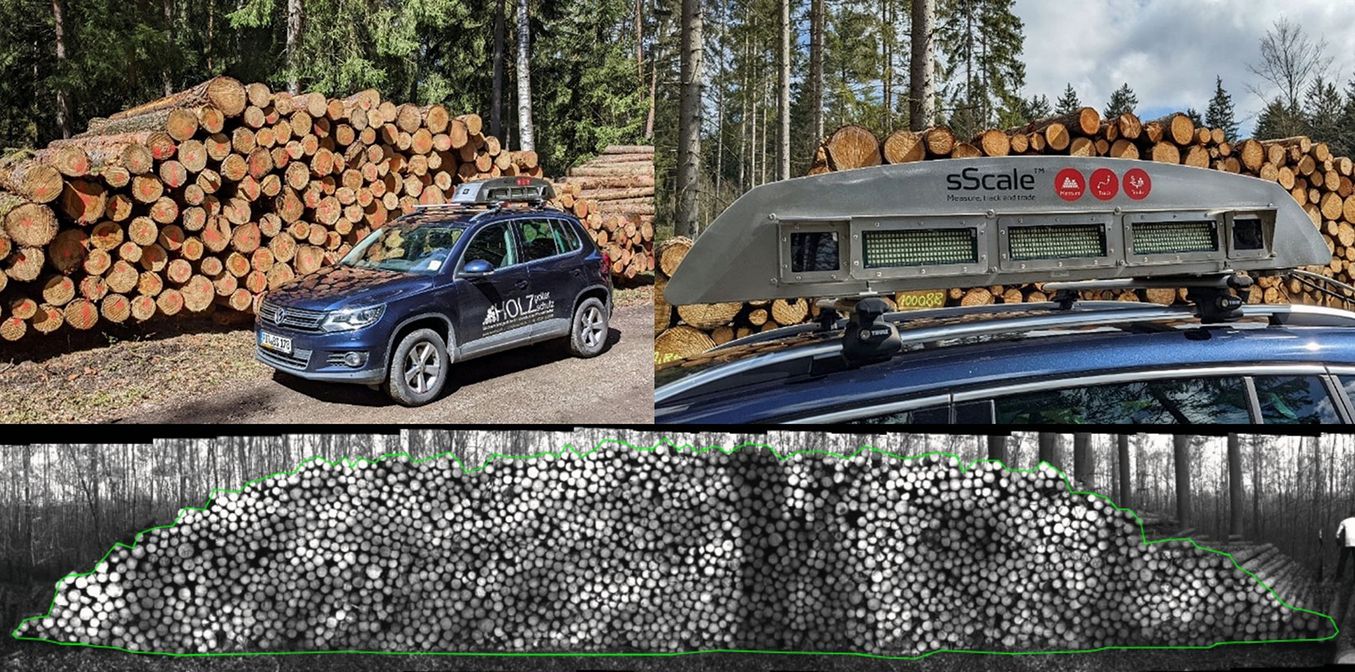
When driving along the wood stack, 11 pictures per second are taken to provide a calibrated measurement of the wood stack’s front surface area (Fig. 3). Under all conditions, the precision is indicated with a maximum calibration error of ± 3% relative to the front surface of the wood stack (according to MessEG and MessEV in Germany by PTB Braunschweig). A traverse line surrounding the wood stack is automatically proposed by the software and can be adjusted by the user if needed. Multiplying the front surface area by the length of the logs results in the gross volume. The sScale system is well integrated into an IT system, allowing wood stack management by different forest owners, as well as logistical planning for log transport.
In this study, two versions of the Dralle A/S sScale system were applied: the current one (Dralle 1) and an updated version (Dralle 2). The updated version (Dralle 2) includes hardware updates for the cameras and computer processors, and the algorithms used for the automated detection of the wood stack front’s surface area have been improved. The two procedures were here operated by two different drivers.
Mobile LiDAR-based measurement
A GeoSLAM ZEB HORIZON personal mobile laser scanner was used to scan the wood stacks. In order to scan the whole stack, including the upper side, this device was mounted on a carbon pole extendable up to 5 m. This scanner uses Light Detection and Ranging (LiDAR) technology. The accuracy of this device is very high (1 and 3 cm), and a range of approx. 100 m can be covered ([15]). In total, 300.000 points are taken per second in the single return mode to create the resulting point cloud. The scanning process starts with IMU (Inertial Measurement Unit) initialisation at a location close to the wood stack, which optimises the required scanning time. Next, the stack is scanned by walking around it with GeoSLAM ZEB HORIZON, and the process finishes at approximately the same geographic point as where it began.
After scanning, the files are converted into a point cloud using the software GeoSLAM HUB v. 6.1 and analysed using the software Cloud Compare (v. 2.12 - [17]). This analysis process consists of segmenting the wood stack and the surrounding terrain and removing the noise (Fig. 4). Next, the stack is manually segmented using the segmentation tool in Cloud Compare, excluding the surrounding area. Since the bottom side of the stack cannot be scanned, it must be projected or built in the following way. Firstly, the tool “CSF filter” (47) is used to extract the ground points of the remaining area. Next, the “rasterise” tool is used to rasterise the point cloud to a 2.5D grid. In doing so, the empty cells are filled with interpolated ground based on the stack’s surrounding area. These filled cells correspond to the bottom side of the stack. After the manual segmentation of the projected bottom side of the stack, the gross stack volume is estimated with the tool “Volume 2.5D”, incorporating the projected bottom side of the stack as the ground and the segmented point cloud of the wood stack.
Fig. 4 - LiDAR-taken wood stack and segmented surrounding area.
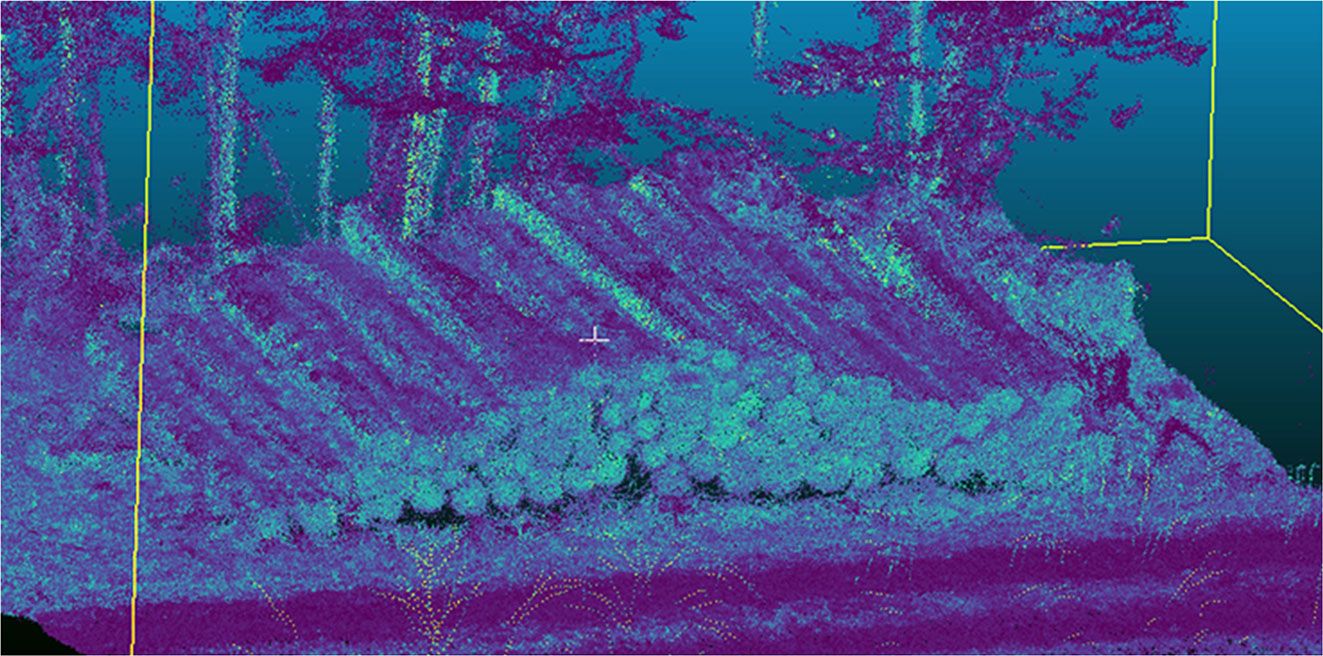
The measurements and analyses recorded with the GeoSLAM are abbreviated as “GS” henceforth.
Optical RGB and LiDAR-based measurement using iPad
Additional measurements were carried out with an RGB image and LiDAR combination, using consumer hardware. The wood stacks were scanned with a tablet with integrated RGB cameras and LiDAR scanners; these were installed on an iPad Pro™ 2nd generation with 11″ display and operating system iPadOS15. The primary camera has 12.19 MP (3840 × 2160 pixels), a wide-angle lens with a 1.8 aperture, and a dual optical zoom ([16]). The ultra-wide-angle lens camera has a 10 MP resolution with a 2.4 aperture and an angle of view of 125° ([1], [39], [45], [43]). A LiDAR scanner with a range of 5 meters was also installed on the iPad as a unique feature. Fig. 5 shows the iPad Pro and the location of the LiDAR sensors.
Fig. 5 - iPad Pro™ 2nd generation with 11″ display: (a) front display with a scanned and processed wood stack in the used 3D Scanner App; (b) back with the locations of different sensors; (c) detailed location information of the sensors.
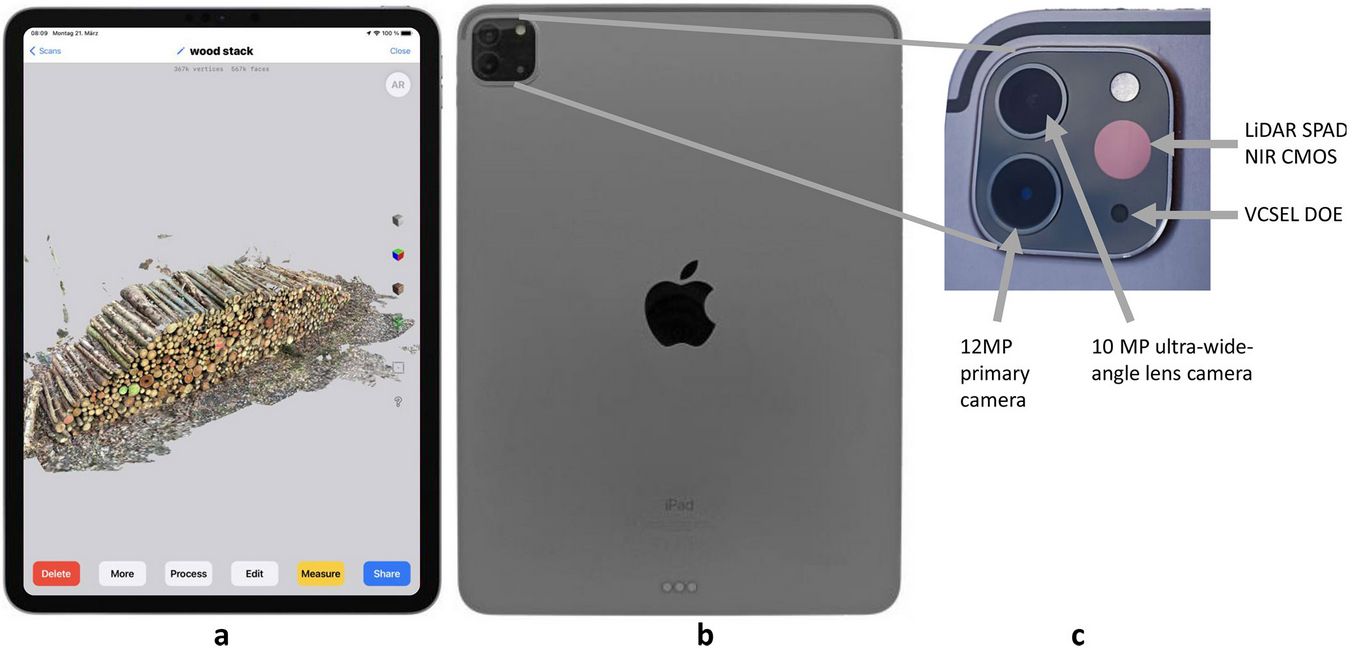
The iPad LiDAR sensor emits an array of 24 × 24 infrared points, subdivided into a 3 × 3 grid with 8 × 8 diffraction points each. This makes a total of 576 points ([28], [45]). It was found ([46]) that using LiDAR on the iPad Pro as a scanning technique was not applicable when scanning small objects, such as a Lego brick. When measuring wooden piles, the limit is not the size of the measured objects, but the measuring range, which is 5 m. However, the iPad LiDAR sensor has previously been successfully used for forestry measurements ([16]).
The iPad was mounted on a 1.7 m-long selfie stick. Therefore, the iPad camera reaches a maximum height of approximately 4.2 m at the end of an outstretched arm. Each wood stack was surrounded once with the iPad for each experimental method. The images were taken in a vertical wave motion so that the surface of the entire wooden pile could be captured. The iPad was rotated slightly along the stick’s axis to give views in different directions (Fig. 6a). In addition, the camera’s position was determined based on the GNSS position and IMU sensors. The LiDAR data, the RGB photos and the orientation were captured twice with two different apps (Pix4Dcatch, 3D Scanner App). Both apps capture and analyse in different ways. Therefore, these apps offer two different methods and have been considered separately.
Fig. 6 - Wood stack no. WS4, captured by iPad-Pix4Dcapture (LiDAR +RGB) based on 178 RGB pictures and 178 dept measurements’ data. (a) Textured point cloud with camera positions and orientations (blue pyramids); (b) plotted 3D textured mesh and Pix4Dcloud postprocessing measurement. The red translucent area represents the ground and the lower boundary of the volume measurement.
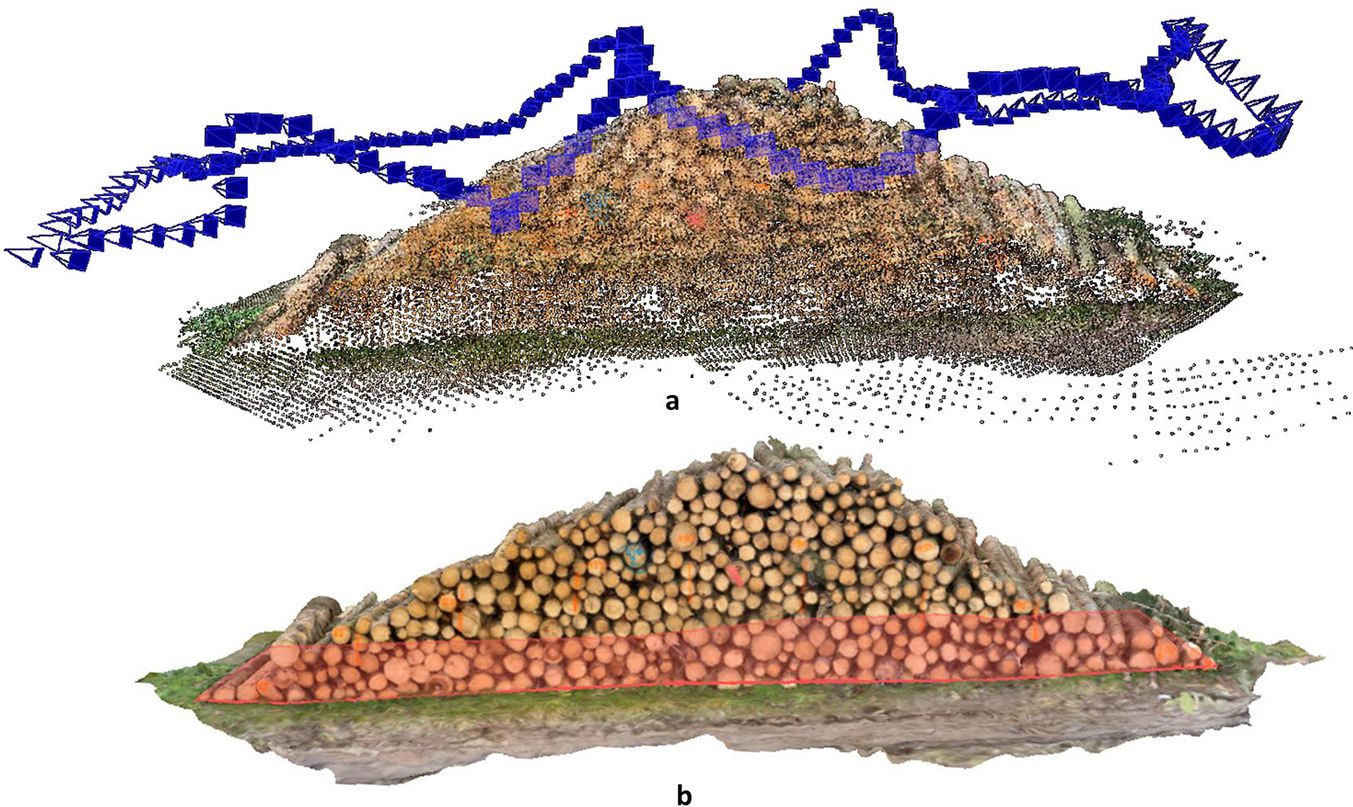
(a) PIX4Dcatch: during the measurement process, the “PIX4Dcatch” app ([35]) on the iPad Pro was used to automatically capture RGB images and additional information via the integrated LiDAR scanner. The image trigger method was set to 90% image overlap, with autofocus and the skipping of low-quality images. The recorded data were uploaded to the Pix4Dcloud and automatically processed. Based on the RGB images, LiDAR, camera positions and orientation data, a point cloud and a textured mesh grid were calculated. After the manual definition of the 3D ground surface area, the overall volume of the wood stack could be calculated by the program ([36]).
Fig. 6b shows a plotted 3D textured mesh as an example of the iPad-Pix4Dcapture (LiDAR + RGB) and Pix4Dcloud postprocessing measurement of wood stack no. WS4. The red translucent area represents the ground and the lower boundary of the volume measurement. Wood stock no. WS4 was measured using 178 RGB images and 178 depth measurements with a size of 258.59 MB. The GNSS horizontal positioning accuracy was 3.05 m, and the vertical accuracy was 4.85 m.
(b) 3D Scanner App: the 3D Scanner App by Laan Labs ([27]) incorporates a LiDAR scanner, enabling the user to scan models quickly and then process them with the app. The application offers a very fine resolution (0.5 mm). It has a built-in distance measurement tool, yet it lacks the capacity for volume measurement. For this reason, models have to be exported or uploaded to an online platform, access to which facilitates volume measurement. The program used was Blender ver. 2.93.6 and the volume was calculated with the Blender AddOn “3D-Print Toolbox” established by Campbell Barton using the remesh option “Smooth” with values of octree depth 8-10 at a 99% scale ([30]).
The measurements and analyses recorded with the Pix4Dcatch app are abbreviated as “P4D”, and those of the 3D Scanner App are abbreviated as “D3”.
Data analysis
The recorded experimental data of all nine methods were calculated and entered manually into a spreadsheet. A plausibility check and outlier analyses were then carried out. If necessary, the values were corrected or recalculated. The data were imported into the statistical package R, and the statistical tests, analyses and graphs were created. Additionally, data transformation was performed to enable pairwise comparison with and without consideration of the direction. Statistical analysis was performed using a paired t-test between the one-sided simultaneous measurements of the two methods, with a confidence level of 0.95.
For the analysis, the arithmetic means of relative deviations of pairwise combinations of different wood stack measurement methods in both directions were calculated using the following equation (eqn. 1):
where AMean refers to the arithmetic mean of relative deviations of pairwise combinations of different wood stack measurement methods; vM1i is the individual volume of measurement method 1; vM2i is the individual volume of measurement method 2; n is the number of pairwise combinations.
Results
The gross stack volumes of the 47 wood stacks obtained with the different measuring systems are displayed in Tab. S1 (Supplementary material). Not every wood stack was measured with each of the nine methods due to the temporal constraints of the study, the removal of logs between measurements, and measurement errors. During the manual data transfer process and the subsequent plausibility check and outlier analysis, a few errors were found, some of which could be traced and corrected. This resulted in 323 measurements, of which 290 were included in the analysis. In detail, these were Timbeter (41), iPad-Pix4Dcatch (33), iPad-3D Scanner App (42), FBG (10), iFovea (41), GeoSLAM (30), SRM (41), Dralle 1 (32), and Dralle 2 (20). The total measured volume was about 2654 m3 (depending on the measurement method).
The results (p-values) of the t-test applied to a pairwise combination of the same wood stack are shown in Tab. 1. Each combination’s number, including wood stacks, varies between 0 and 41 (the right part of Tab. 1). In total, 847 comparisons between measurements of the same wood stack are available, resulting in 36 combinations of measurement methods. Of these 36 combinations, 7 show a statistically significant difference at a 5% error probability (the left part of Tab. 1).
Tab. 1 - The number of pairwise combinations (upper right part of the table) and the p-value (t-test, lower left part of the table) between the different measuring methods. (*, **): statistically significant differences.
| n | iPad 3dScan |
Dralle 1 | Dralle 2 | FBG | Fovea | Geo- SLAM |
iPad Pix4D |
SRM | Timbeter | Sum |
|---|---|---|---|---|---|---|---|---|---|---|
| p-value | ||||||||||
| iPad 3dScan | - | 28 | 19 | 10 | 38 | 26 | 31 | 38 | 38 | 228 |
| Dralle 1 | <0.01** | - | 16 | 9 | 30 | 26 | 23 | 30 | 30 | 192 |
| Dralle 2 | <0.01** | 0.01* | - | 0 | 20 | 18 | 20 | 20 | 20 | 133 |
| FBG | 0.67ns | 0.36 ns | - | - | 10 | 5 | 5 | 10 | 10 | 59 |
| Fovea | 0.01* | 0.02* | 0.23 ns | 0.23 ns | - | 28 | 30 | 40 | 40 | 236 |
| GeoSLAM | 0.01* | 0.62 ns | 0.28 ns | 0.32 ns | 0.37 ns | - | 22 | 28 | 28 | 181 |
| iPad Pix4D | 0.84 ns | 0.09 ns | 0.21 ns | 0.53 ns | 0.18 ns | 0.16 ns | - | 30 | 30 | 191 |
| SRM | 0.16 ns | <0.01** | 0.24 ns | 0.64 ns | 0.20 ns | 0.20 ns | 0.25 ns | - | 41 | 237 |
| Timbeter | 0.72 ns | 0.03 ns | 0.54 ns | 0.47 ns | 0.08 ns | 0.20 ns | 0.82 ns | 0.20 ns | - | 237 |
Tab. 2 presents the arithmetic means of relative deviations of pairwise combinations of different wood stack measurement methods in both calculation directions. A positive number means that the measurement method in the column (left) is greater on average than the one in the row (above) in each direct comparison. The minimum (-7.03%) and the maximum (9.15%) mean relative deviations between the two measurement methods were observed between GeoSLAM and FBG.
Tab. 2 - Arithmetic means of relative deviations and timber volume of pairwise combinations of different wood stack measurement methods.
| Type | - | iPad 3DScan |
Dralle 1 | Dralle 2 | FBG | Fovea | Geo-slam | iPad Pix4D |
SRM | Timbeter |
|---|---|---|---|---|---|---|---|---|---|---|
| Percent (%) | iPad 3dScan | - | 7.3 | 6.1 | -0.9 | 5.4 | 5.8 | 1.8 | 5.0 | 2.6 |
| Dralle 1 | -6.1 | - | -2.5 | -5.4 | -2.7 | 0.1 | -4.3 | -2.9 | -4.0 | |
| Dralle 2 | -5.2 | 2.7 | - | - | 0.7 | 2.1 | -3.0 | -1.2 | 0.0 | |
| FBG | 1.7 | 6.9 | - | - | 5.9 | -7.0 | 4.5 | 6.0 | -0.3 | |
| Fovea | -4.3 | 3.2 | -0.2 | -4.1 | - | 2.1 | -3.3 | 0.1 | -3.2 | |
| Geoslam | -4.7 | 1.1 | -1.1 | 9.1 | -0.2 | - | -1.6 | -1.2 | -2.2 | |
| iPad Pix4D | -1.1 | 4.9 | 3.7 | -3.2 | 4.3 | 2.8 | - | 3.1 | 2.6 | |
| SRM | -3.9 | 3.2 | 1.4 | -3.9 | 0.4 | 2.4 | -2.6 | - | -2.8 | |
| Timbeter | 0.2 | 5.1 | 2.6 | 2.5 | 5.9 | 4.9 | -0.7 | 5.5 | - | |
| Sum of timber (m³) | iPad 3dScan | - | 1.892 | 1.273 | 458 | 2.274 | 1.635 | 1.797 | 2.272 | 2.272 |
| Dralle 1 | 1.993 | - | 1.244 | 444 | 2.078 | 1.767 | 1.663 | 2.078 | 2.078 | |
| Dralle 2 | 1.337 | 1.220 | - | - | 1.380 | 1.151 | 1.380 | 1.380 | 1.380 | |
| FBG | 452 | 428 | - | - | 452 | 290 | 132 | 452 | 452 | |
| Fovea | 2.362 | 2.038 | 1.398 | 462 | - | 1.778 | 1.892 | 2.435 | 2.435 | |
| Geoslam | 1.726 | 1.786 | 1.184 | 269 | 1.814 | - | 1.477 | 1.814 | 1.814 | |
| iPad Pix4D | 1.804 | 1.586 | 1.322 | 136 | 1.819 | 1.430 | - | 1.818 | 1.818 | |
| SRM | 2.316 | 2.023 | 1.361 | 463 | 2.397 | 1.767 | 1.863 | - | 2.409 | |
| Timbeter | 2.250 | 1.980 | 1.352 | 427 | 2.332 | 1.748 | 1.826 | 2.345 | - |
The relative differences between the various methods also depend on the size of the wood stack. However, the actual gross wood stack volume cannot be given, as all methods only estimate the gross stack volume. Considering the potential failures of the manual section-based measurement (SRM), Fig. 7 shows the different measurement methods as plots, using the SRM as a reference. Every coloured point represents a comparison to the manual section-based measurement for every wood stack.
Fig. 7 - Different wood stack measuring methods in pairwise relation to the manual section-based measurement method (a) 0-50 m3 (b) 50-200 m3 (D3: iPad 3d Scanner App; SRM: section-based measurement; P4D: iPad Pix4D; GS: GeoSLAM; TB: Timbeter; FV: Fovea; FBG: self-measurement by forest owner; DR1: Dralle 1; DR2: Dralle 2; n=273).
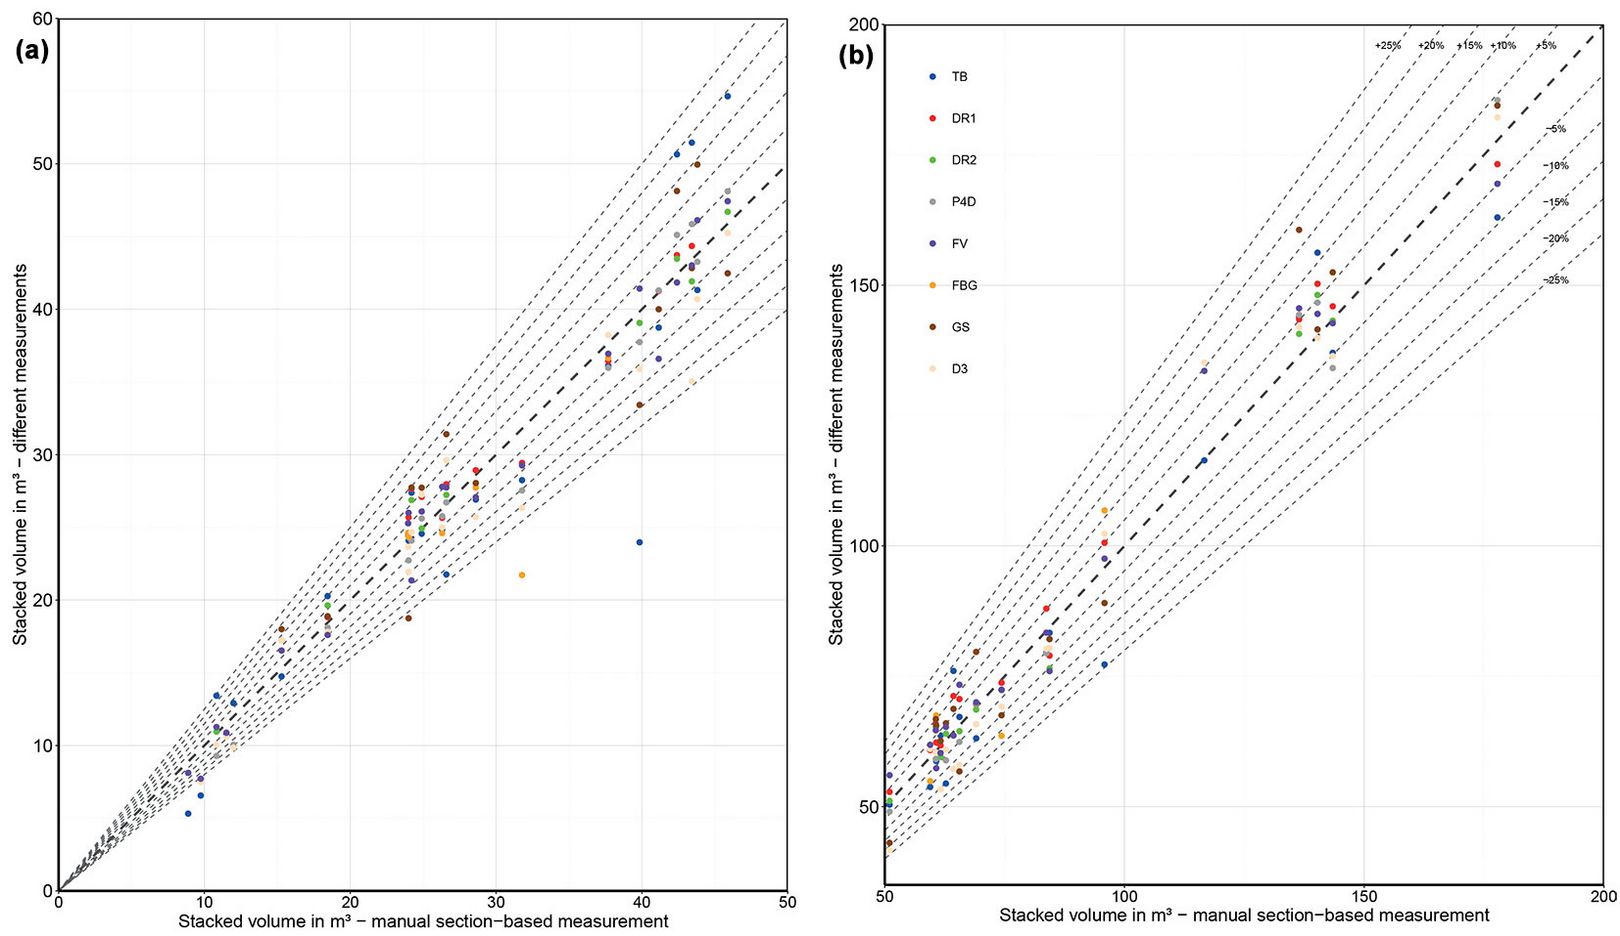
Assuming SRM is an accurate estimate, all values should be located on the dark grey diagonal line (0% deviation). In addition, the relative deviation decreases as the stacked volume of the wood stock increases. For wood stacks with a gross stacked volume o.b. ≤ 50 m3, a substantial relative variation in the measured values can be observed. Outliers above 25% deviations only occur up to approximately 40 m3 o.b. It can be seen that there are significant differences between the individual methods. Still, there is no clear trend between the existing methods. FBG and SRM, both of which used nearly the same manual section-based method, show large deviations.
Fig. 8 illustrates a pairwise relative comparison of the different measurement methods as boxplots. These show a relative pairwise relation to the measurement values on the x-axis and are thus direction-dependent. If negative values are displayed, this means that the method shown in the coloured boxes measures a lower gross volume of the wood than the measurement method shown on the x-axis. For example, it can be seen that D3 on the x-axis underestimates the wood stack volume compared to the mean of all other measuring methods.
Fig. 8 - Pairwise relative comparison of different measurement methods (D3: iPad 3d Scanner App; SRM: section-based measurement; P4D: iPad Pix4D; GS: GeoSLAM; TB: Timbeter; FV: Fovea; FBG: self-measurement by forest owner; DR1: Dralle 1; DR2: Dralle 2).
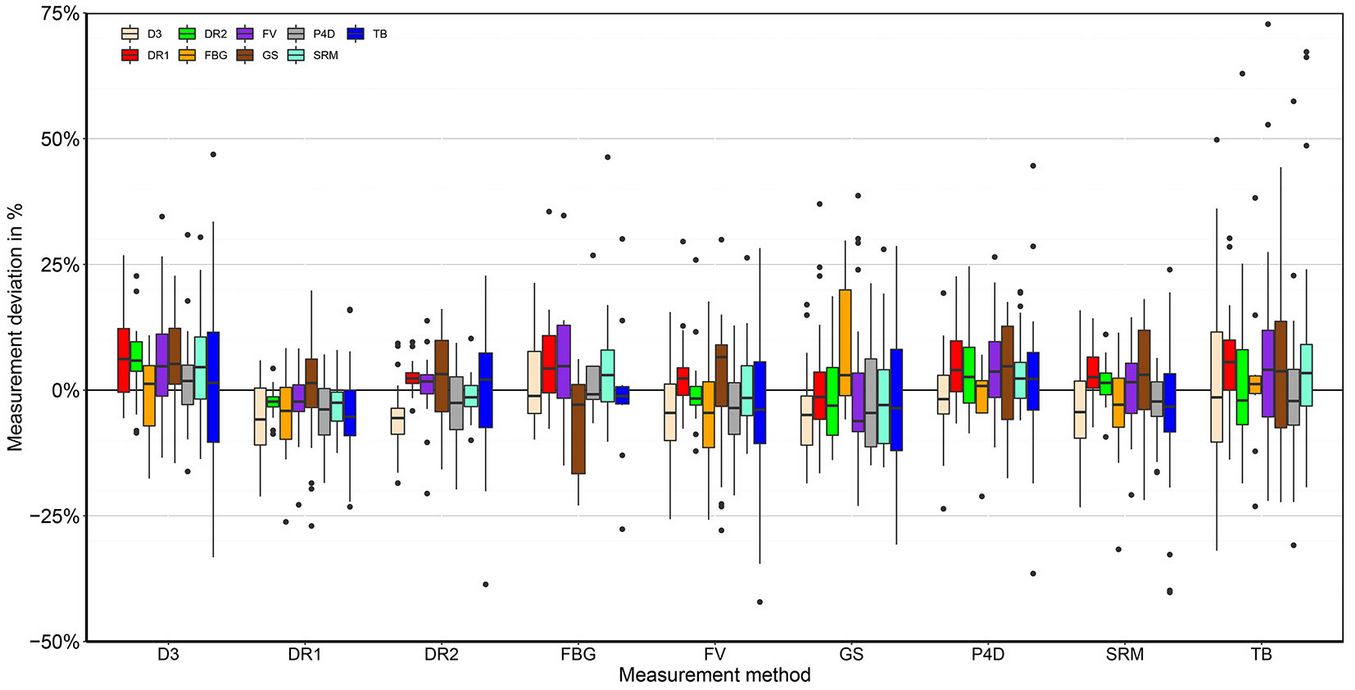
Tab. 3 shows the relative and absolute differences between the pairwise-measured wood stack volume sums of the different measuring methods. The medians and the 25-th/75-th percentiles vary greatly between the individual measurements. Via direct comparison, it becomes clear that the various measurement methods differ systematically from each other. As can be seen in Fig. 8, the medians of the measurements with the two iPad-based LiDAR methods are lower than the parsed comparison measurements. Thus, the iPad 3D Scanner App method recorded a total of 13,873 m3 according to a pairwise comparison, and the other methods recorded 14,241 m3 (difference: 368.4 m3 o.b.), which is 2.7% higher than the reference value (Tab. 3). On average, the 3D measurement method using the iPad and the 3D Scanner App recorded lower timber volumes than the comparison methods. The same is true for the 3D measurement method using the iPad and the app Pix4D, which determined 11,733 m3 o.b., and the comparison methods, which determined 12,.030 m3 o.b. (+296.8 m3; +2.5%).
Tab. 3 - Wood stack gross volume o.b., and the absolute and relative differences between the pairwise measured wood stack volume sum for the different measuring methods.
| Method | Volume of method (m3) |
Volume of other pairwise methods (m3) |
Absolute difference (m3) |
Relative difference (%) |
|---|---|---|---|---|
| Dralle 1 | 13,346.0 | 12,953.2 | -392.8 | 97.1 |
| GeoSLAM | 11,886.3 | 11,566.1 | -320.2 | 97.3 |
| Fovea | 14,799.1 | 14,547.2 | -252.0 | 98.3 |
| Dralle 2 | 9,229.5 | 9,133.8 | -95.7 | 99.0 |
| FBG | 2,659.6 | 2,658.2 | -1.5 | 99.9 |
| SRM | 14,597.8 | 14,594.8 | -3.0 | 100.0 |
| iPad Pix4D | 11,733.2 | 12,030.0 | 296.8 | 102.5 |
| iPad 3dScan | 13,872.7 | 14,241.1 | 368.4 | 102.7 |
| Timbeter | 14,258.8 | 14,658.8 | 400.0 | 102.8 |
When measuring with Dralle1, the reverse was true. Except for the applied method in Cloud Compare, based on the samples taken with GeoSLAM ZEB HORIZON, all medians, when compared with Dralle1, give results in the minus range. Both GeoSLAM and Dralle 1 (13,346 m3) achieve higher values than the other methods (12,953 m3 o.b.).
There are large fluctuations between and within the results of individual measurement methods (Fig. 8). In particular, the app Timbeter gives huge outliers in the positive range. These occur primarily in the areas of wood stacks with smaller gross volumes. The gross volumes obtained via the SRM and FBG measurement methods were almost exactly the same as in the corresponding comparison measurements. Therefore, on average, the fluctuations balance each other out.
Discussion
From an economic point of view, the accurate volume estimation of a wood stack is of utmost importance, especially when used for billing purposes ([4]). Since the costs of roundwood purchases correspond to 60-85% of the final production costs of wood products ([13]), inaccurate estimations of roundwood stack volume have serious economic consequences ([9]). This study aimed to analyze the suitability of the selected methods for estimating the gross volume of the wood stacks and compare them to each other. The main analysed tree species was Norway spruce, and the recordings were concentrated in a small area; the results can presumably be transferred to other comparable conditions, as the analyses considered a broad range of stack sizes (between 8.89 and 209.3 m3), different timber assortment qualities, and two different forest owner types (state and private). Moreover, the study was conducted under real-world conditions. Therefore, the stacks, which were measured in this study, are deemed as representative in spite of the slightly imbalanced sample number. The results are thus reliable and reproducible.
Firstly, it must be pointed out that the application of each method resulted in reliable results although with variable deviations between each other. Thus, the suitability of all applied methods was demonstrated. Within the study, several distinct methods were compared: (i) manual section-based measurement; (ii) 2D optical measurements with both mono and stereo camera-based methods; and (iii) 3D optical measurements with mobile LiDAR and RGB methods. The results show that of the 35 pairwise comparisons, only 7 gave significantly different means, according to the t-test (Tab. 2). Most of these significant differences were attributable to only two methods: the iPad 3D Scanner App and Dralle1. However, in Fig. 8 Dralle1 showed few deviations in the single stack volume estimation compared to the other methods, with a narrow deviation range. Thus, the deviation between Dralle1 and other measurement methods seems to be due to a small systematic underestimation. Deviations between stack volume estimations via a single method varied between -42.1% and 72.8%, and we also found deviations between the two mono RGB-camera based methods (Timbeter and iFOVEA) and measurements of a stack size of approx. 25 m3. The causes of the strong deviations in individual cases may be varied. Despite our approach, human measurement or operating errors cannot be ruled out, although the researchers collected vast experience with both apps in former research and teaching. In particular, most wood stacks failed to perfectly meet all criteria of a photo-optical measurement method (e.g., visibility of the wood stack bottom line). While countermeasures against systematic over- or underestimations are easy to implement, no correction factors can be implemented for methods with a high deviation range.
A possible explanation for the broad range of deviation in estimations of stack volume with the mono RGB-camera method is that the operators must use a reference scale. This reference is either a measuring rod (Timbeter) or the stack length (iFOVEA), and it can be a major source of error. For example, it hardly seems possible to determine the exact stack length with a measuring tape in real-world conditions. Moreover, locating the exact beginning and end of the measuring rod on a smartphone screen is not very easy, even with a good-quality zoom. It should also be noted that small inclinations in the measuring rod or the mobile device when taking the photos may also have a non-negligible negative effect on the measuring accuracy. In addition, differences in stitching quality due to the taking of images at slightly different angles and with slightly different overlaps might lead to deviations in the resulting volume; stereo RGB-camera methods do not have this problem, as the spatial reference is defined by the fixed distance between the two cameras and is thus of higher accuracy. The soft- and hardware upgrade from Dralle1 to Dralle2 resulted in overall better performances. The difference in the legally prescribed RVR procedure decreases from 2.9% to 1.2%. This shows that technical improvements may further increase the efficacy and accuracy of photo-optical methods.
There are some systematic inaccuracies within the measurement methods. For the manual and purely RGB-optical measuring methods, the length of the logs is defined according to RVR ([38]), depending on the type of use. For low-quality industrial wood, no oversize is added, while for sawn timber, 1% (minimum 10 cm) oversize is usually added to the timber order length. Therefore, the timber length used for calculating the volume of the same wood stack can vary, e.g., between 2.40 and 2.50 m, depending on the ultimate use (e.g., wood for palettes, respectively pulpwood). In some cases, this ultimate use was not known on-site. In the current study, the wood stack depth, corresponding with the timber assortment lengths, was measured and, in cases of differences, corrected and standardised for the evaluation.
Weather conditions can be a factor in the recording process. Light conditions do not influence the GeoSLAM ZEB HORIZON or Dralle, since they use LiDAR or artificial light and can be used in the dark. However, the GeoSLAM ZEB HORIZON can only be used within the operating temperature range of 0 °C to 50 °C ([15]). Furthermore, all optical-based methods face problems under heavy rain or snow. In particular, it was noted, but not measured, that the outside handling of the touchscreen for a precise data assessment becomes more difficult with cold and wet weather conditions. Except for SRM, FBG and Dralle (tablet within a car), all studied methods required outside tablet use.
As regards the manual section-based and 2D optical methods, the results of this study are in line with other studies, though slightly higher mean deviations have been observed. The mean deviations between manual and photo-optical measurements of 0.9% and 1.9% ([8]), 4.5% ([24]), and -2.1% and -3.7% ([4]) are comparable with the mean deviations in this study, which are between -5.4% and 6.9%. The slightly higher deviation might result from differing assortments and wood stacks that were included and that were, in general, not as homogeneous compared to the assortments used in the previous studies. Already, a standard deviation of repeating measurements of the same wood stack was observed at between 0.55% and 3.93%.
The 3D optical measurement method did not calculate the gross volume via the multiplication of the front area and the log assortment length, but instead used the real physical length. In Germany, logs of sawing assortments are usually cut with some oversize. Theoretically, this should result in a larger volume than manual cut-based or 2D optical methods. It is important to note that the volume derived by the 2D optical method can only be an approximation, as the depth given never represents the real, physical depth of the stack. Moreover, the estimation of gross stack volume using the 2D optical and manual section-based methods was only performed using the height of the front side of the stack. This is mainly due to the fact that photo-optical methods often cannot be used to measure the backside of the stack, as a free view of and access to the backside is required. This cannot be guaranteed and is often not feasible in a forest environment. For accuracy reasons, RVR ([38]) recommends to measureboth sides of the stack taking the mean of both values. Therefore, some differences in stack volume estimations were expected between the 2D and 3D measurement methods. In comparison with all the other measurement methods (Fig. 2), the RGB- and LiDAR-based methods (P4D and D3) mostly underestimated the volume, while the method applied in Cloud Compare based on the samples taken with GeoSLAM ZEB HORIZON (GS) tended to give a higher estimate of the volume. A possible explanation might be that the RGB- and LiDAR-based measurement methods have the capacity to identify the airspace in wood stacks, while the method applied in Cloud Compare based on samples taken with GeoSLAM ZEB HORIZON only estimates the gross stack volume from the surface area from above, assuming that the wood stack is a bulk. Thereby, the method used in Cloud Compare assumes that both stack ends are even, i.e., there is no deviation in the logs’ ends between the front and rear sides of the stack. In this way, the existing air spaces between the logs’ ends are considered when estimating the gross stack volume, which leads to overestimates of the stack volume. Another reason for obtaining generally overestimated gross volumes is that this method partially considers air spaces located on the bottom side of the stack, in the saddle, as part of the stack, whereas this volume is excluded when applying other measurement methods. In this sense, more research should focus on the accuracy of RGB- and LiDAR-based measurement methods in identifying the airspaces, and thus bypassing the need for conversion from stacked volume to solid timber volume. This would lead to increased accuracy in timber solid volume estimation, as conversion factors are dependent on many other factors, such as midpoint diameter and crookedness ([9], [10]). However, to totally bypass the conversion factors used to derive the timber volume without airspace and bark from gross volume o.b., research should focus on the automatic detection of bark with RGB and combined RGB and LiDAR methods. Thus, the fastidious but accurate quantification of bark volume by X-ray-computed tomography ([41]) or water immersion ([2], [3]) to develop bark factors could be avoided; this is particularly a problem as bark factors should be reviewed regularly, because they may change over time ([40]).
A trend of greater deviations was observed when smaller stacks were measured (Fig. 8). This is in line with the results reported by Berendt et al. ([4]) and Neumann ([33]), wherein a relationship between small stacks and lower stack quality was assumed to be responsible for the higher deviation in smaller stack measurements.
For purely optical methods, in particular, which measure the front surface of the wood stack, the quality of the stacking and the surroundings of the wood stack play decisive roles and can influence the measurement results. These methods also face problems with wood stacks that lay at a lower level than the road from which they are measured, especially if the lower edge cannot be recognised correctly. The LiDAR-based methods, on the other hand, face problems when the wood stack is poorly or not accessible from the backside. In addition, the stack could be too high. In that case, the LiDAR methods cannot capture the whole wood stack, which leads to inaccuracies or, in some cases, misapplications of the volume algorithms.
The methodologies for the high-precision estimation of the real gross volume of wood stacks, using retrieved or calculated point clouds based on LiDAR measurement, still have potential. The differences between 2.5D and true 3D measurements, with the inclusion of airspaces between the logs, should be analyse in further research. The newly developed LiDAR-based methods achieve high accuracy and have the potential to complement or replace classical methods in the near future. Further research to determine the most accurate and efficient volume calculation procedure is needed.
Conclusions and outlook
According to the results of this study, all the selected methods are suitable for measuring the gross volumes of the stacks. However, the variation between the different methods was surprisingly high. Moreover, no trend with respect to these resulting deviations could be observed or identified. However, the results of the direct comparison between the methods revealed two important aspects: (i) the 3D measurement methods using the iPad and the apps 3D Scanner and Pix4D recorded lower gross stack volumes compared to the other methods; (ii) in contrast, and taking the volumes measured with DRALLE, the other methods underestimated the gross stack volumes, with the exception of the method used in Cloud Compare.
Overall, no analysed measurement method could currently be considered as the most accurate. Differences due to human influence when measuring, manually recording and transmitting the values were unexpectedly high. To attain higher accuracy, it is advantageous for the human influence factor can be reduced as much as possible. Further improvements in digitalisation, standardised data exchange, and the consistent use of forestry 4.0 methods can be of help. Careful measurements should be taken and, if possible, the fronts and backs of the wood stacks should be measured. This will have a great influence on the quality of the measurement result. Additionally, many influential aspects, such as working hours, costs, work safety, and the applicability of the different processes under difficult conditions, were not investigated. Further research in this field is needed.
References
Gscholar
Gscholar
CrossRef | Gscholar
Gscholar
Gscholar
Gscholar
Gscholar
Gscholar
Gscholar
CrossRef | Gscholar
Gscholar
Gscholar
Gscholar
CrossRef | Gscholar
Gscholar
Gscholar
Authors’ Info
Authors’ Affiliation
Felipe De Miguel-Díez 0000-0002-3800-7449
Benjamin Engler 0000-0003-2104-8209
Chair of Forest Operations, University Freiburg (Germany)
Ferreol Berendt 0000-0002-6285-7590
Tobias Cremer 0000-0001-7866-944x
Department of Forest Utilization and Timber Markets, Eberswalde University for Sustainable Development, Eberswalde (Germany)
Corresponding author
Paper Info
Citation
Purfürst T, De Miguel-Díez F, Berendt F, Engler B, Cremer T (2023). Comparison of wood stack volume determination between manual, photo-optical, iPad-LiDAR and handheld-LiDAR based measurement methods. iForest 16: 243-252. - doi: 10.3832/ifor4153-016
Academic Editor
Enrico Marchi
Paper history
Received: Jun 08, 2022
Accepted: Jul 12, 2023
First online: Aug 23, 2023
Publication Date: Aug 31, 2023
Publication Time: 1.40 months
Copyright Information
© SISEF - The Italian Society of Silviculture and Forest Ecology 2023
Open Access
This article is distributed under the terms of the Creative Commons Attribution-Non Commercial 4.0 International (https://creativecommons.org/licenses/by-nc/4.0/), which permits unrestricted use, distribution, and reproduction in any medium, provided you give appropriate credit to the original author(s) and the source, provide a link to the Creative Commons license, and indicate if changes were made.

Web Metrics
Breakdown by View Type
Article Usage
Total Article Views: 30206
(from publication date up to now)
Breakdown by View Type
HTML Page Views: 22015
Abstract Page Views: 4812
PDF Downloads: 2843
Citation/Reference Downloads: 6
XML Downloads: 530
Web Metrics
Days since publication: 1037
Overall contacts: 30206
Avg. contacts per week: 203.90
Article Citations
Article citations are based on data periodically collected from the Clarivate Web of Science web site
(last update: Mar 2025)
Total number of cites (since 2023): 8
Average cites per year: 2.67
Publication Metrics
by Dimensions ©
Articles citing this article
List of the papers citing this article based on CrossRef Cited-by.
Related Contents
iForest Similar Articles
Research Articles
The potential of using xylarium wood samples for wood density calculations: a comparison of approaches for volume measurement
vol. 4, pp. 150-159 (online: 11 August 2011)
Research Articles
Use of terrestrial laser scanning to evaluate the spatial distribution of soil disturbance by skidding operations
vol. 8, pp. 386-393 (online: 08 October 2014)
Research Articles
Characterization of VOC emission profile of different wood species during moisture cycles
vol. 10, pp. 576-584 (online: 08 May 2017)
Research Articles
Validation of models using near-infrared spectroscopy to estimate basic density and chemical composition of Eucalyptus wood
vol. 17, pp. 338-345 (online: 03 November 2024)
Research Articles
NIR-based models for estimating selected physical and chemical wood properties from fast-growing plantations
vol. 15, pp. 372-380 (online: 05 October 2022)
Research Articles
Integrating area-based and individual tree detection approaches for estimating tree volume in plantation inventory using aerial image and airborne laser scanning data
vol. 10, pp. 296-302 (online: 15 December 2016)
Research Articles
Density, extractives and decay resistance variabilities within branch wood from four agroforestry hardwood species
vol. 14, pp. 212-220 (online: 02 May 2021)
Research Articles
Identification of wood from the Amazon by characteristics of Haralick and Neural Network: image segmentation and polishing of the surface
vol. 15, pp. 234-239 (online: 14 July 2022)
Research Articles
Improving dimensional stability of Populus cathayana wood by suberin monomers with heat treatment
vol. 14, pp. 313-319 (online: 01 July 2021)
Research Articles
Examining the evolution and convergence of wood modification and environmental impact assessment in research
vol. 10, pp. 879-885 (online: 06 November 2017)
iForest Database Search
Search By Author
Search By Keyword
Google Scholar Search
Citing Articles
Search By Author
Search By Keywords
PubMed Search
Search By Author
Search By Keyword


