Characterization of VOC emission profile of different wood species during moisture cycles
iForest - Biogeosciences and Forestry, Volume 10, Issue 3, Pages 576-584 (2017)
doi: https://doi.org/10.3832/ifor2259-010
Published: May 08, 2017 - Copyright © 2017 SISEF
Research Articles
Abstract
This study addresses the characterization of volatile organic compounds (VOCs) emitted by samples of 13 different wood species, belonging to both softwoods and hardwoods groups, regularly measured at different intervals of time, after the first measurement on green wood. The same wood specimens were subjected to several cycles of water desorption and adsorption, assuming that moisture variation might play a role in both the formation and emission of VOCs. Proton Transfer Reaction-Time of Flight-Mass Spectrometry (PTR-TOF-MS) was used as a tool to characterize the emission of VOCs. Coupled with a multivariate class-modelling approach, this tool was able to discriminate between groups (softwood and hardwood) and in some cases between different species. However, results showed that the discriminant capacity of VOCs emission to separate species and families rapidly decreases after the first cycles of moisture variation in wood. The green wood was characterized by a richness of volatile compounds, whereas, after only the first dry cycle, wood emitted a more restricted group of compounds. We hypothesized that most of these VOCs might have originated from structural changes and degradation processes that involve the main polymers (particularly hemicellulose) constituting the cell wall of wooden cells. The results obtained are in agreement with the physical and chemical modification processes that characterize wood ageing.
Keywords
Wood, VOCs, PTR-TOF-MS, PLSDA, Wood Ageing, Moisture Content
Introduction
Volatile organic compounds (VOCs) represent a large and chemically diverse group of carbon-based molecules, such as hydrocarbons and other organic molecules, with a high vapour pressure at room temperature. They are emitted into the atmosphere from anthropogenic and biogenic sources (plants, animals, microorganisms, production processes, and/or their products - [19], [13]). These compounds may also be formed in situ in the atmosphere as products of the transformation of other VOCs ([2]). The major classes of emitted VOCs are alkanes, alkenes, aromatic hydrocarbons, and oxygenated compounds, with vegetative emissions typically being composed of alkenes (such as isoprene, monoterpenes, and sesquiterpenes) and oxygenated VOCs (including acetone and methanol - [2]).
The classification proposal of the World Health Organization ([39]) is the most widely used. The WHO classifies pollutants into very volatile organic compounds (VVOCs), volatile organic compounds (VOCs), semi-volatile compounds (SVOCs), and organic compounds associated with particulate matter (POM).
The emission from vegetation (biogenic emission) has been widely studied: conditions that have been explored include diurnal and seasonal variations ([12], [21]) in response to temperature changes ([10]) and to different environmental conditions ([16]).
VOC emissions are also present in wood, and they are dependent upon many factors including species, age, and pH value; these emissions differ significantly between hardwoods and softwoods ([36], [29], [35], [28]). Specifically, Fengel & Wegener ([8]) reported that softwood polyoses contain higher amounts of mannose and galactose than hardwoods, whereas hardwoods are richer in pentoses, characterized by higher amounts of acetyl groups. VOCs from wood can originate either from compounds present in the native structure of wood, or through different chemical processes, such as oxidation and hydrolysis, that involve wood components ([29]). In general, the most common VOCs emitted from wood are terpenes, aliphatic aldehydes, and organic acids ([32]). Terpenes are the main constituent of the resin of softwoods, and aldehydes are formed by oxidative decay of fatty acids. Among the organic acids, acetic acid occurs due to cleavage of acetyl groups from hemicelluloses, whereas hexanoic acid originates from the decay of fatty acids. Furthermore, by increasing the time of storage and modifying the conditions of wood storage, the release of some VOCs declines dramatically over time, reaching very low emission levels (e.g., terpenes in softwoods and formaldehyde in both soft- and hardwoods are naturally occurring chemicals in wood - [28]), whereas specific treatments could determine the transformation of the originals VOCs from wood, changing their release rates ([25], [17]). In addition, during storage the composition of extractives changes: the content of extractives decreases whilst free sugar, lipophilic fats, fatty and resin acids, and sterols substantially decreases ([31]).
Previous studies have already dealt with products that derived from the degradation of wood polysaccharide fraction, after specific treatments or processing procedures of wood, showing the formation of compounds such as: (1) formaldehyde, acetaldehyde, propenal, butanal, and butanone resulting from the breakdown of the polysaccharide fraction of the wood during pyrolysis ([31]); (2) acetic acid following acetyl group hydrolysis in hemicellulose ([27]); (3) pentanal, hexanal, and other aldehydes resulting from the oxidation of unsaturated fatty acids of triglycerides ([27]); (4) furfural due to hydrolysis of carbohydrates ([29]); and (5) furan and furan derivatives as thermal degradation products of cellulose and other polysaccharides ([25], [9]).
In the literature, no studies have been carried out on green wood (i.e., measured before the first drying cycle) and subsequently repeated on the same samples at regular intervals of time after wood moisture cycles. Assuming that moisture cycles could have an effect in VOC formation and emission, having an active (hydrolysis) or passive (carrier) role in such phenomena described as wood ageing (i.e., change in the chemical composition of constitutive polymers), the aims of the present study were:
- assessing the VOCs emitted by the wood of different species in the green condition (e.g., immediately after tree felling or increment cores sampling) and over the time in response to several conditioning cycles (e.g., variation of moisture content of the sample);
- estimating the possibility to use VOC emission as a discriminant between different wood taxaafter ageing (e.g., after repetition of different cycles of moisture variation); and
- evaluating whether VOC compounds yield information about the processes of wood modification occurring during wood ageing.
PTR-TOF-MS, used to characterize these emissions, is a useful analytical technique largely applied in order to provide an overview of the mass spectra of volatile compounds emitted by different materials ([38], [24], [34], [6], [14]). A detailed description of the PTR-TOF-MS tool is discussed by Blake et al. ([4]).
Material and methods
Study area and sampling design
Sampling procedures including site and species description have been thoroughly described elsewhere ([36]). The list of the species studied is reported in Tab. 1. The specimens, mainly constituted by increment cores, originated from the same plant and made up of both heartwood and sapwood, were analysed in the green condition and after several cycles of moisture variation.
Tab. 1 - List of specimens studied.
| Code no. |
Species | Species Acronym |
Family | Group |
|---|---|---|---|---|
| 1 | Atlantic cedar (Cedrus atlantica Man.) | CA | Pinaceae | Softwood |
| 2 | Austrian black pine (Pinus nigra Arn.) | PiN | Pinaceae | Softwood |
| 3 | Common cypress (Cupressus sempervirens L.) | CS | Cupressaceae | Softwood |
| 4 | Bay laurel (Laurus nobilis L.) | LN | Lauraceae | Hardwood |
| 5 | European walnut (Juglans regia L.) | JR | Juglandaceae | Hardwood |
| 6 | Black poplar (Populus nigra) | PoN | Salicaceae | Hardwood |
| 7 | Common fig (Ficus carica L.) | FC | Moraceae | Hardwood |
| 8 | Almond (Prunus amygdalus (Mill.) D.A.Webb) | PAmy | Rosaceae | Hardwood |
| 9 | Wild cherry (Prunus avium L.) | PAv | Rosaceae | Hardwood |
| 10 | Black locust (Robinia pseudoacacia L.) | RP | Fabaceae | Hardwood |
| 11 | Turkey oak (Quercus cerris L.) | QC | Fagaceae | Hardwood |
| 12 | Downy oak (Quercus pubescens Willd.) | QP | Fagaceae | Hardwood |
| 13 | Evergreen oak (Quercus ilex L.) | QI | Fagaceae | Hardwood |
Moisture cycles
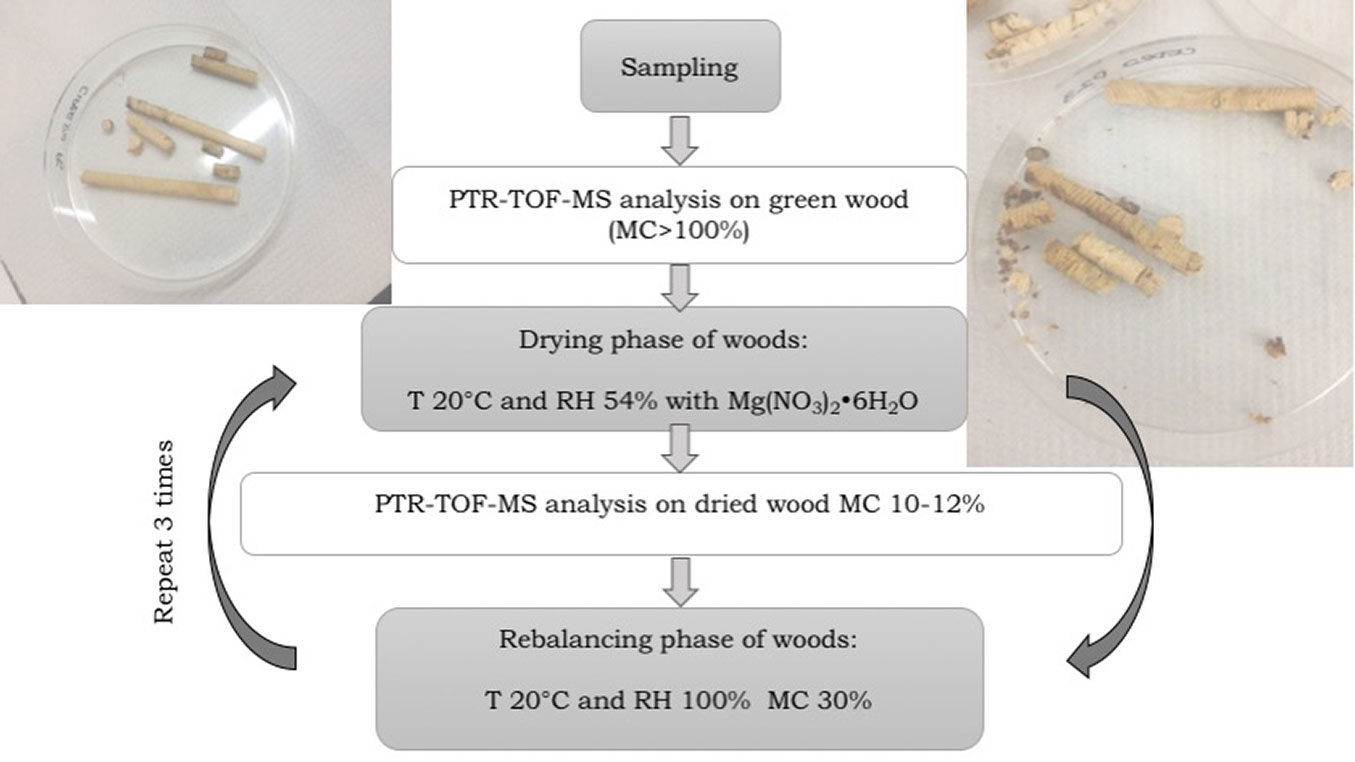
The first VOC analysis was performed by PTR-TOF-MS on green state increment cores (indicated as measurement time T1). Subsequently, samples were submitted to three moisture cycles from fiber saturation point (FSP) to a moisture content (MC) of 10-12%, which were intended to simulate the natural ageing of wood through cycles of moisture variation that typically occur in wood during this process ([1]). Emissions were regularly measured at different intervals of time on samples with moisture content of 10-12% (measurement times T2, T3, and T4).
The following drying-moistened conditioning schedules were followed:
- for T2 analysis (day 7): all the samples were placed in a sealed basin (volume: 72 l) for 7 days and dried with magnesium nitrate hexahydrate for analysis (EMSURE® ACS, Reag. Ph Eur. CAS 13446-18-9, EC Number 233-826-7, chemical formula Mg(NO3)2·6H2O at T 20 °C (obtaining a RH 54%-58%) until no weight loss was detected and a moisture content (MC) of 10-12% was achieved for the analysis of emissions;
- for T3 and T4 analysis: subsequently, the increment cores were moistened at T 20 °C and RH 100% in the same basin for 7 days and submitted to another drying cycle with Mg(NO3)2·6H2O for 7 additional days. At the end of the drying phase, samples were analysed by PTR-TOF-MS (T3, day 21). The same procedure was applied for T4 measurement (day 35 - Fig. 1).
Fig. 1 - Scheme of the experimental procedure.
Soxhlet extraction and UV treatment of core samples
In order to assess whether the emissions were due to, or influenced by, the presence of extractives in wood or to the microbiological activity (bacteria), a supplementary set of Norway spruce samples was prepared. One sub-sample was extracted in alcohol, whereas a second sub-sample was subjected to UV radiation, maintaining for each test an untreated sample as control. Extractives were removed by means of Soxhlet extraction in ethanol (96%), according to standard prescription (TAPPI T 204 om-88), but without the grinding stage. The other specimen was exposed to UV treatment (Sankyo DenKi G20T10® lamp, 20 Watt) for 1 hour, in order to eliminate possible microbiological organisms.
At the end of these treatments, all the specimens, treated and control, were analysed by PTR-TOF-MS.
PTR-TOF-MS and VOCs analysis
The real-time detection of VOCs emitted by different wood cores was achieved using a PTR-TOF 8000® system (Ionicon Analytik Innsbruck, Austria). The same samples were analysed again with the same equipment to monitor the VOCs’ profiles in response to subsequent ageing cycles. All VOCs emitted by the samples were assessed using a setup previously reported in Taiti et al. ([36]). Before analysing the samples, an empty jar was measured. The inlet flow was set at 100 sccm. The headspace analysis was recorded in a range between m/z 20-210 for 60 s with an acquisition rate of one spectrum per second. All of the measurements were carried out under the following drift tube conditions: 600 V drift voltage, 60 °C temperature, and pressure of 2.23 mbar, resulting in an E/N value (electric field strength/gas number density) of 130 Townsend (Td, 1 Td = 10-17 cm2/V s).
PTR-TOF-MS ata analysis
The raw data were acquired by the TOFDAQ Viewer® software (Tofwerk AG, Thun, Switzerland). Data acquisition and quantification of peaks, expressed as normalized count for seconds (ncps), were corrected according to the duty cycle, and the signals were normalized to the primary ion signal (cps→ncps - [15]). To allow a rapid identification of compounds with a high level of confidence, the internal calibration of mass spectral data was based on three points calibration using m/z = 21.022 (H3O+), m/z = 59.049 (C3H7O+), and m/z = 137.132 (C10H17+); this was performed off-line ([23]). The tentative identification of VOCs provided by the tool (high sensitivity and with a fast selective identification) was compared on models of fragmentation available in the literature and compared with published VOCs emitted by wood species (Tab. S1 in Supplementary material). Dead time correction and peak extraction were performed according to a procedure described elsewhere using a modified Gaussian peak shape ([5]). Subsequently, the peaks associated with the PTR-MS ion source including m/z = 32 (O2+) and m/z = 37 (water cluster ion) were eliminated.
Statistical analysis
The matrix composed by 80 VOCs × 156 wood samples (13 species; 4 measurement times T1, T2, T3, T4; 3 replicates each) was used to assess the potential of the method to discriminate: (i) between softwoods and hardwoods (2 groups); (ii) among families (9 groups); and (iii) among plant species (13 groups). Three class-modelling approaches were applied to predict the aforementioned groups: (i) the model M1 built on the first measurement dataset (T1); (ii) the model M2 built on the fourth measurement dataset (T4); and (iii) the model M3 that include all the measurement datasets (T1, T2, T3, T4). Matrices at each time were separately autoscaled by column.
After this procedure, the matrix was pre-processed using the normalization algorithm (which performed normalization of the rows; i.e., samples). A partial least squares discriminant analysis (PLSDA) approach was applied for the classification of the matrix to determine hardwoods and softwoods or the 13 species using the VOCs. The models were developed using a procedure written in the MATLAB 7.1 R14 environment. PLSDA ([33], [30], [18]) is a PLS regression (SIMPLS algorithm - [20]) in which the response variable is categorical, expressing the class membership of the statistical units. The objective of PLSDA is to find a model, developed from a training set of observations of known class membership, that separates classes of objects on the basis of their X-variables. The percentages of correct classification were calculated for the calibration and validation phases, and then used for model selection. The PLSDA model selection was mainly based on the efficiencies and robustness parameters described above. For M1 and M2, T1 and T4 were respectively used as the calibration and validation sets, and the rest of the samples as the test set; for M3, the dataset was divided into a calibration/validation set composed by 66.67% of samples and an internal validation set represented by the remaining 33.3%. The partitioning of the models for M3, which include all the sampling times, was conducted optimally by choosing the Euclidean distances based on the algorithm of Kennard & Stone ([22]) that selects objects without the a priori knowledge of a regression model. A summary of the relative importance of the X-variables for both Y and X model parts is given by Variable Importance in the Projection (VIP - [37], [18]). VIP scores estimate the importance of each variable in the PLS-based models. VIP scores were calculated according to Chong & Jun ([7]). The explanatory variables with VIP scores values larger than 1 tend to be more important than others, although this does not imply that a variable with a low VIP score is not relevant for the model.
Results and discussion
Several mass peaks in the range of measured masses (m/z = 20-210) were collected from 13 different wood species at four different sampling times; 80 mass peaks were detected in the specimens from the first measurement ([36]), but their number subsequently decreased after several ageing cycles. In Tab. S1 (Supplementary material) are reported the most significant putative molecules identified in the first analysis from wood in the green condition, including their measured m/z ratio, protonated molecular formula, chemical name, and related reference. The signals observed from green specimens varied in terms of the nature and intensity for each wood species.
According to our tentative identification, the main compounds detected were m/z = 33.033 methanol, m/z = 45.033 acetaldehyde, m/z = 47.049 ethanol, m/z = 59.049 acetone, m/z = 61.028 acetic acid, m/z = 69.036 furan, m/z = 81.069 monoterpene fragment, m/z = 93.070 toluene or p-cymene fragment, m/z = 153.127 terpenoid compound, m/z = 137.132 monoterpenes, and m/z = 205.195 sesquiterpenes. All these compounds were recorded in all the investigated species during the first measurement (Tab. S1 in Supplementary material). Their emission rates were successively monitored three times during the ageing of specimens (Fig. 2 and Fig. 3).
Fig. 2 - Evaluation of signal intensity of some compounds (reported by m/z ratio) detected in the 13 analysed species. Different symbols indicate a different time analysis (T1 for green state wood, whereas T2, T3 and T4 for samples after moisture cycles). Species acronyms (x-axis) are reported in Tab. 1.
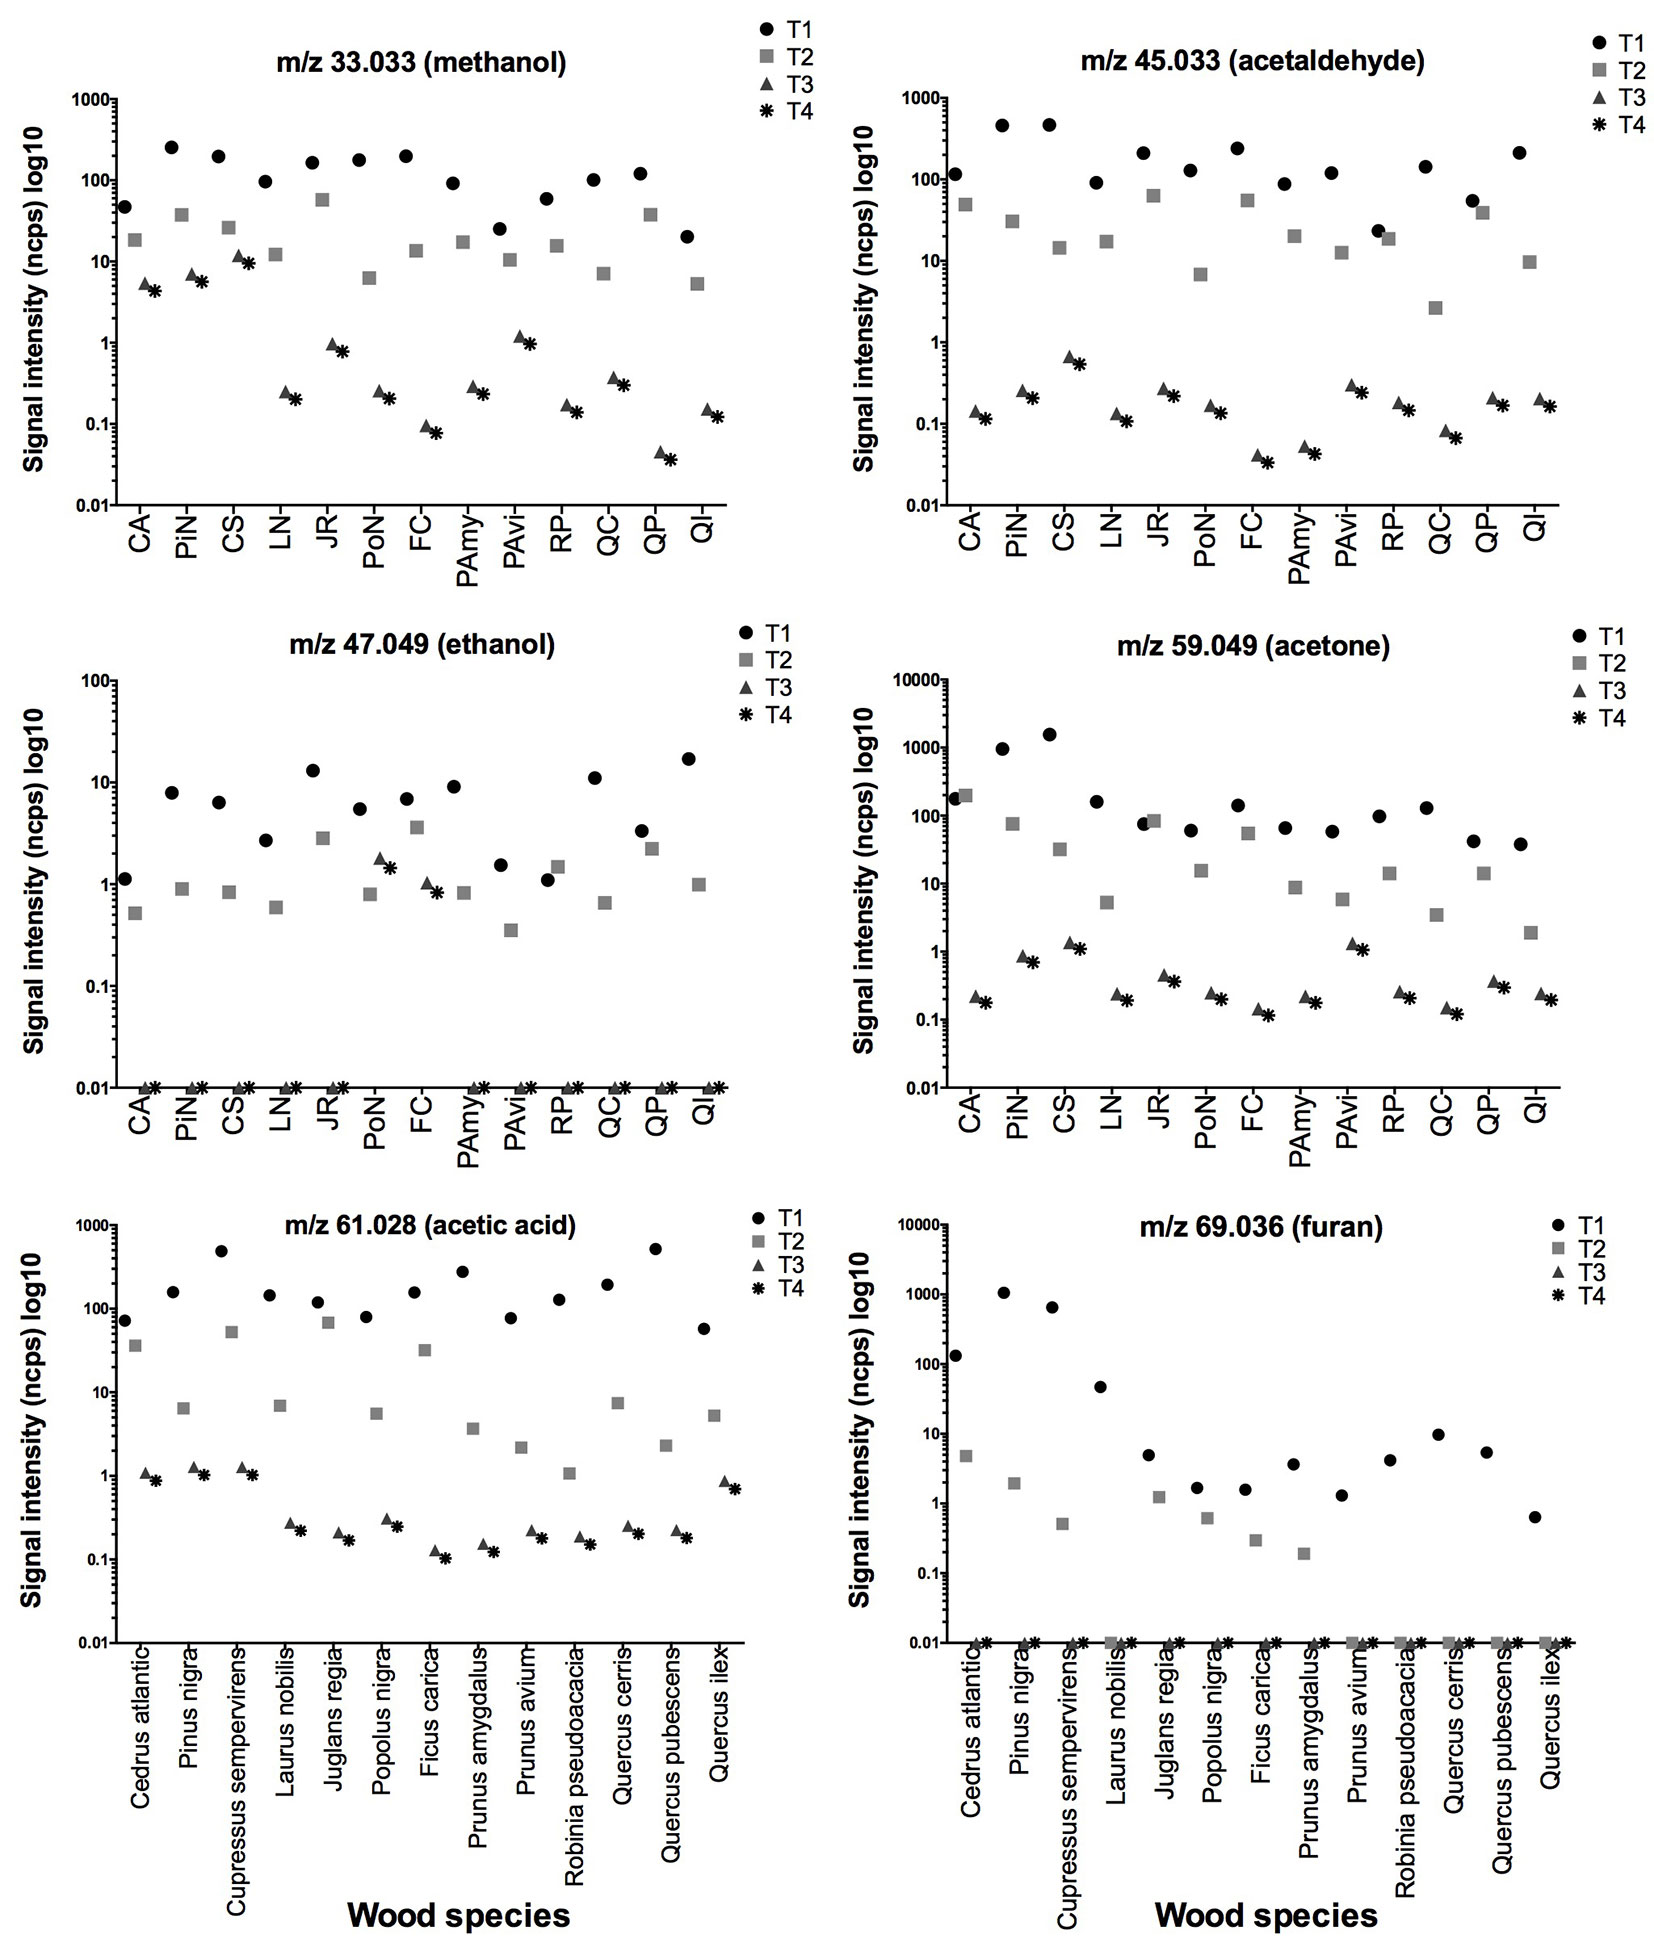
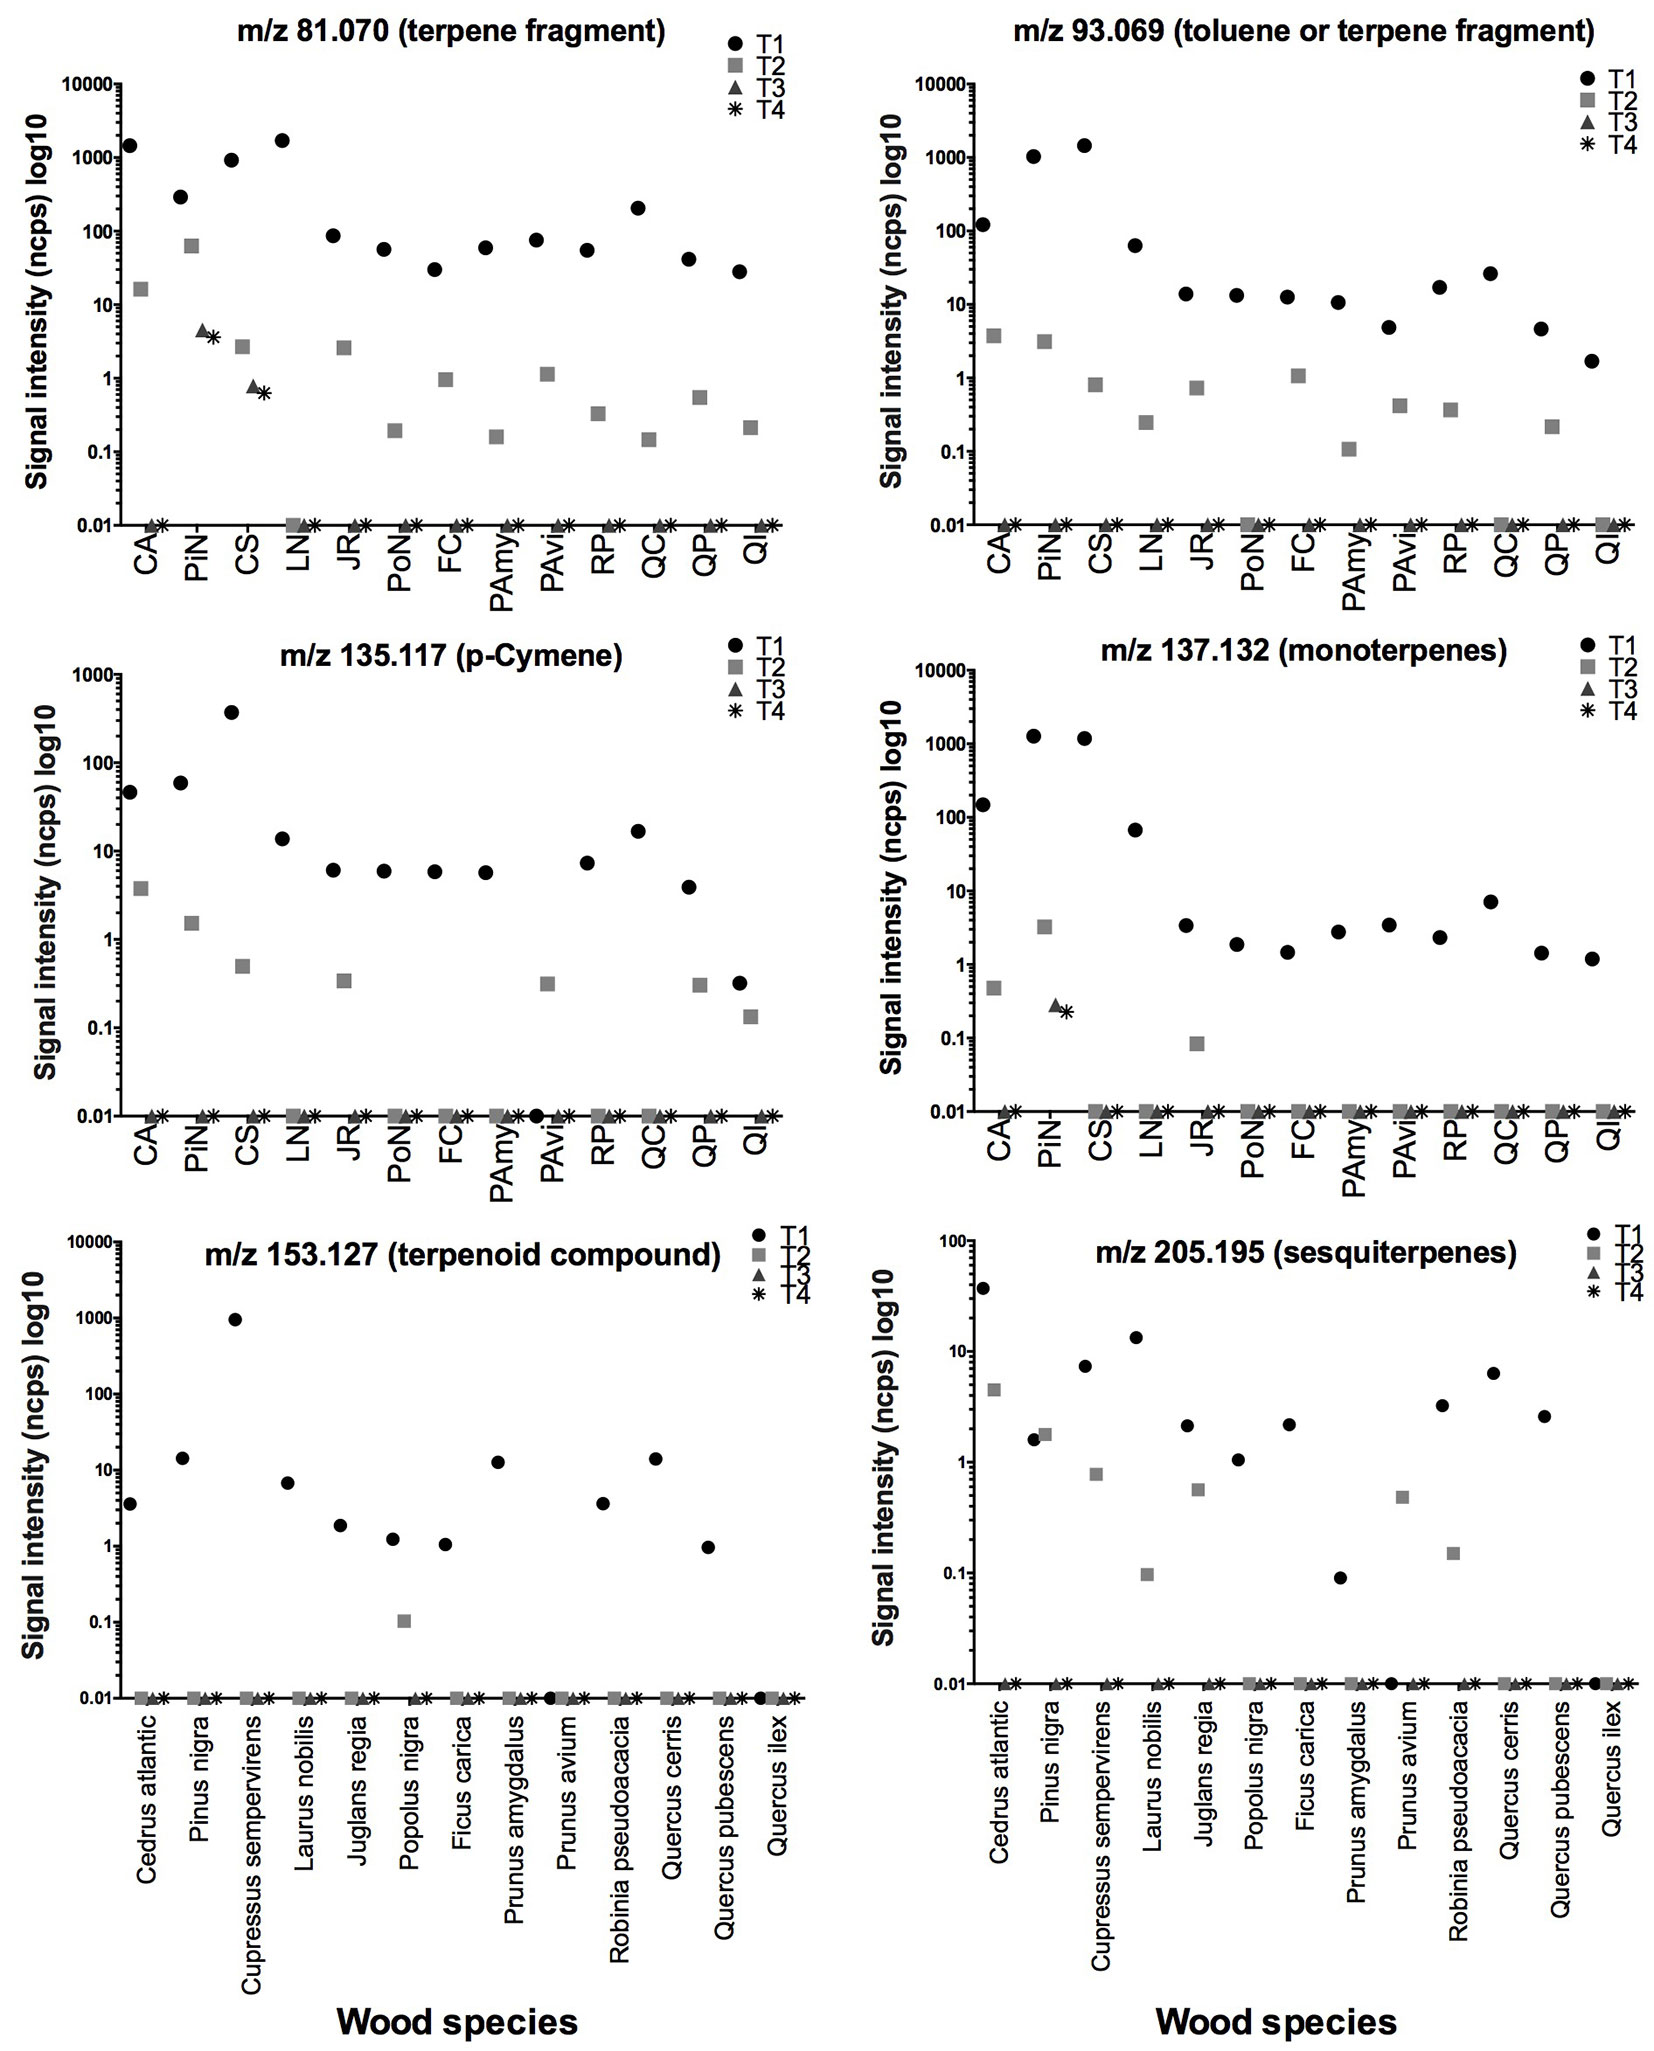
Fig. 3 - Evaluation of signal intensity of terpenes and terpenoid compounds detected in the 13 analysed species. Different symbols indicate a different time analysis (T1 for green state wood, whereas T2, T3 and T4 for samples after moisture cycles). Species acronyms (x-axis) are reported in Tab. 1.
All the VOCs emissions taken into account decreased in intensity starting from the second analysis (after the first drying of wood), and they subsequently disappeared after the second and third steps, excluding some VOCs that continued to be emitted in minimum quantities by some species. For instance, Pinus nigra and Cupressus sempervirens showed the highest signal intensity and the highest number of total peaks in softwood during first sampling time (Fig. 2 and Fig. 3, Tab. S1 in Supplementary material), but in the subsequent analysis, only their emission rates of acetaldehyde and acetone were slightly higher in comparison with all other VOC species. More generally, the softwoods group (Cedrus, Pinus, and Cupressus) continued to emit more methanol than the hardwoods group.
Fresh hardwood species released higher amounts of acetic acid, probably originating from the hydrolyses of acetyl groups in hemicellulose, than terpenes compounds (Fig. 2 and Fig. 3). Regarding specific profile emission from hardwoods during ageing, only Populus nigra and Ficus carica showed ethanol emission even though in very low amounts, differentiating them from the other hardwood and softwood species here examined.
The emission intensity of compounds tentatively identified as terpenes, terpenoids, sesquiterpenes, and their fragments (m/z = 81.069; 93.070; 153.127; 137.132; 205.195) was higher in softwoods (Cedrus, Pinus, and Cupressus) in comparison with most hardwood species (Fig. 3), with terpene compounds being the essential part of the resin composition in many softwood species ([27], [3], [32], [29]). The only exception was represented by Bay laurel (Laurus nobilis) that showed similar peak intensities for the masses regarding terpenes, due to the richness of such compounds in this species (e.g., oxygenated monoterpenes and monoterpene hydrocarbons - [11]). However, given that terpenes are very volatile, their intensity decreased drastically by the second analysis, and, in the following cycles, terpene fragments and monoterpenes (m/z 81.070 and m/z 137.132, respectively) were recorded only in softwoods, especially in Black pine (Pinus nigra).
The comparison of the emission profiles of extracted and UV-treated samples with reciprocal control samples showed no significant changes in the observed emitted compounds. This finding seems to indicate that all the revealed emissions have to be attributed to modification processes occurring in wood and in its constitutive polymers, avoiding the hypothesis of possible interference in the results due to the presence of extractives or because of microbiological activity.
The statistical significance of the data sets measured at the different times (T1 to T4) was tested according to the models previously described (M1, M2, M3).
The performance indicators of the PLSDA models M1 and M2 tested on the other measurement times are reported in Tab. 2.
Tab. 2 - Characteristics and principal results of the three PLSDA models. (LVs): Latent Vectors; (RMSEC): Root Mean Square Error of Calibration.
| Characteristics | M1 | M2 | M3 | ||||||
|---|---|---|---|---|---|---|---|---|---|
| Hard/ softwood |
Families | Species | Hard/ softwood |
Families | Species | Hard/ softwood |
Families | Species | |
| No. samples model | 39 | 39 | 39 | 39 | 39 | 39 | 104 | 104 | 104 |
| No. classes (y-block) | 2 | 9 | 13 | 2 | 9 | 13 | 2 | 9 | 13 |
| No. LVs | 3 | 15 | 10 | 6 | 9 | 8 | 6 | 15 | 17 |
| % Cumulated variance X-block | 70.32 | 99.33 | 97.37 | 84.45 | 97.6 | 94.95 | 77.56 | 88.62 | 90.88 |
| % Cumulated variance Y-block | 68.15 | 85.1 | 71.15 | 65.59 | 51.13 | 50.55 | 32.24 | 48.67 | 45.6 |
| Mean sensitivity (%) | 0.98 | 1 | 1 | 1 | 0.9 | 1 | 1 | 0.88 | 0.89 |
| Mean specificity (%) | 0.93 | 1 | 1 | 0.98 | 0.95 | 0.94 | 1 | 0.93 | 0.93 |
| Random probability (%) | 50 | 11.11 | 7.69 | 50 | 11.11 | 7.69 | 50 | 11.11 | 7.69 |
| Mean classification error (%) | 0.05 | 0 | 0 | 0.01 | 0.08 | 0.03 | 0 | 0.1 | 0.1 |
| Mean RMSEC | 0.4 | 0.12 | 0.14 | 0.41 | 0.22 | 0.19 | 0.52 | 0.23 | 0.2 |
| Mean % correct classification calibration/validation set |
100 | 100 | 100 | 100 | 84.62 | 80.77 | 100 | 82.69 | 78.85 |
| No. samples test | 117 | 117 | 117 | 117 | 117 | 117 | 52 | 52 | 52 |
| Mean % correct classification test set | T2: 84.62 | T2: 10.26 | T2: 17.95 | T1: 66.67 | T1: 7.69 | T1: 7.69 | 100 | 67.31 | 73.08 |
| Mean % correct classification test set | T3: 79.49 | T3: 7.69 | T3: 25.64 | T2: 84.62 | T2: 20.51 | T2: 20.51 | - | - | - |
| Mean % correct classification test set | T4: 79.49 | T4: 7.69 | T4: 25.64 | T3: 100 | T3: 79.49 | T3: 74.36 | - | - | - |
The M1 model adopted to discriminate hardwood vs. softwood samples using 3 Latent Vectors showed 0.98 and 0.93 mean sensitivity and specificity values, respectively. The mean classification error was 0.05. The mean percentage of correct classification was determined to be equal to 100% for the calibration/validation set (at T1), whereas at T2 it decreased to 84.6%, and at T3 and T4 to 79.5%. The M1 model adopted to discriminate the 9 families used 15 Latent Vectors and showed 1 as the mean sensitivity and specificity values. The mean classification error was equal to 0. Even in this case, the mean percentage of correct classification was equal to 100% for the calibration/validation set (at T1), while at T2 it steeply decreased to 10.3%, and at T3 and T4 to 7.7%. The M1 model that was adopted to discriminate the 13 species used 10 Latent Vectors and showed 1 as the mean sensitivity and specificity values. The mean classification error was equal to 0.
The mean percentage of correct classifications in this case was determined be equal to 100% for the calibration/validation set at T1, while at T2 it sharply decreased to 18.0%, and at T3 and T4 to 25.6%.
The results obtained applying the M1 model to the classification of the samples clearly showed the difference in the quality of the VOCs emitted at T1 (fresh wood) and in the subsequent steps (T2 to T4).
The M2 model adopted to determine hardwood vs. softwood samples at T4 using 6 Latent Vectors showed mean sensitivity and specificity values of 1 and 0.98, respectively. The mean classification error was 0.01. The mean percentage of correct classification was determined to be equal to 100% for the calibration/validation set at T3 and T4, whereas at T2 it decreased to 84.6% and at T1 to 66.7%. The M2 model used 9 Latent Vectors to discriminate the 9 families and showed mean sensitivity and specificity values of 0.9 and 1, respectively. The mean classification error was equal to 0.08. The mean percentage of correct classification was found to be equal to 84.6% for the calibration/validation set at T4, while at T3 it decreased to 79.5%, then at T2 it drastically decreased to 20.5%, and at T1 to 7.7%. Then, to discriminate the 13 species, M2 used 8 Latent Vectors and showed mean sensitivity and specificity values of 1 and 0.9, respectively. The mean classification error was equal to 0.03. The mean percentage of correct classification was determined to be equal to 80.8% for the calibration/validation set (at T4), whereas at T3 it decreased to 74.4%, then at T2 it drastically decreased to 20.5%, and at T1 to 7.7%.
The performance indicators of the PLSDA model M3 built on 66.7% of the full dataset and tested on the remaining 33.3% are reported in Tab. 2. The M3 model adopted to determine hardwood vs. softwood samples using 6 Latent Vectors showed mean sensitivity and specificity values of 1. The mean classification error was 0. The mean percentage of correct classification was found to be equal to 100% for both the calibration/validation and the test sets. The M3 model adopted to discriminate the 9 families used 15 Latent Vectors and showed mean sensitivity and specificity values of 0.88 and 0.93, respectively. The mean classification error was equal to 0.10. The mean percentage of correct classification was observed to be equal to 82.6% for the calibration/validation set and 67.3% for the test set. The M3 model adopted to discriminate the 13 species used 17 Latent Vectors and showed mean sensitivity and specificity values of 0.89 and 0.93, respectively. The mean classification error was equal to 0.10. The mean percentage of correct classification was found to be equal to 78.9% for the calibration/validation set and 73.1% for the test set.
Tab. 3 and Tab. 4 show the classification test set results for the M3 families and species, respectively, reported as a confusion matrix. Each row of the square matrix represents the instances in the actual class (i.e., observed), while each column of the matrix represents the instances in the predicted class. Each entry, then, gives the number of instances of real classes that were classified as the predicted class. As a result, all correct classifications are on the main diagonal of the matrix; any value off that diagonal is an incorrect classification observation. The accuracy of the statistical classification of the model is evaluated by two different measures, the producer’s accuracy (PA) and the user’s accuracy (UA), reported in Tab. 5 and Tab. 6. The PA of a category indicates to what extent the reference samples of the category are correctly classified, whereas the UA of a category represents to what extent the other categories are less misclassified into the category in question.
Tab. 3 - Confusion matrix for M3 families test set. Correct classification of wood samples are on the main diagonal of the matrix, while any value off the diagonal represents an incorrectly classified observation.
| PLSDA model M3 | Predicted family | ||||||||||
|---|---|---|---|---|---|---|---|---|---|---|---|
| Pinaceae | Cupressaceae | Lauraceae | Juglandaceae | Salicaceae | Moraceae | Rosaceae | Fabaceae | Fagaceae | Total | ||
| Actual family | Pinaceae | 6 | 0 | 0 | 0 | 0 | 0 | 0 | 0 | 2 | 8 |
| Cupressaceae | 0 | 3 | 0 | 0 | 0 | 0 | 0 | 1 | 0 | 4 | |
| Lauraceae | 0 | 0 | 4 | 0 | 0 | 0 | 0 | 0 | 0 | 4 | |
| Juglandaceae | 0 | 0 | 0 | 4 | 0 | 0 | 0 | 0 | 0 | 4 | |
| Salicaceae | 0 | 0 | 0 | 0 | 2 | 0 | 1 | 0 | 1 | 4 | |
| Moraceae | 0 | 0 | 0 | 0 | 1 | 2 | 0 | 1 | 0 | 4 | |
| Rosaceae | 0 | 0 | 0 | 0 | 0 | 2 | 4 | 0 | 2 | 8 | |
| Fabaceae | 0 | 0 | 0 | 0 | 0 | 0 | 1 | 1 | 2 | 4 | |
| Fagaceae | 0 | 0 | 1 | 0 | 0 | 1 | 1 | 0 | 9 | 12 | |
| Total | 6 | 3 | 5 | 4 | 3 | 5 | 7 | 3 | 16 | 52 | |
Tab. 4 - Confusion matrix for the 13 M3 species test set. Correct classification of wood samples are on the main diagonal of the matrix, while any value off the diagonal represents an incorrectly classified observation.
| PLSDA model M3 | Predicted species | ||||||||||||||
|---|---|---|---|---|---|---|---|---|---|---|---|---|---|---|---|
| Cedrus atlantica | Pinus nigra | Cupressus sempervirens | Laurus nobilis | Juglans regia | Populus nigra | Ficus carica | Prunus amygdalus | Prunus avium | Robinia pseudoacacia | Quercus cerris | Quercus pubescens | Quercus ilex | Total | ||
| Actual species | Cedrus atlantica | 4 | 0 | 0 | 0 | 0 | 0 | 0 | 0 | 0 | 0 | 0 | 0 | 0 | 4 |
| Pinus nigra | 0 | 4 | 0 | 0 | 0 | 0 | 0 | 0 | 0 | 0 | 0 | 0 | 0 | 4 | |
| Cupressus sempervirens | 0 | 0 | 3 | 0 | 0 | 0 | 0 | 0 | 0 | 1 | 0 | 0 | 0 | 4 | |
| Laurus nobilis | 0 | 0 | 0 | 4 | 0 | 0 | 0 | 0 | 0 | 0 | 0 | 0 | 0 | 4 | |
| Juglans regia | 0 | 0 | 0 | 0 | 4 | 0 | 0 | 0 | 0 | 0 | 0 | 0 | 0 | 4 | |
| Populus nigra | 0 | 0 | 0 | 0 | 0 | 2 | 0 | 0 | 0 | 1 | 0 | 0 | 1 | 4 | |
| Ficus carica | 0 | 0 | 0 | 0 | 0 | 1 | 2 | 0 | 0 | 1 | 0 | 0 | 0 | 4 | |
| Prunus amygdalus | 0 | 0 | 0 | 0 | 0 | 0 | 0 | 0 | 0 | 1 | 3 | 0 | 0 | 4 | |
| Prunus avium | 0 | 0 | 0 | 0 | 0 | 0 | 0 | 0 | 4 | 0 | 0 | 0 | 0 | 4 | |
| Robinia pseudoacacia | 0 | 0 | 0 | 0 | 0 | 0 | 0 | 0 | 1 | 2 | 1 | 0 | 0 | 4 | |
| Quercus cerris | 0 | 0 | 0 | 0 | 0 | 0 | 0 | 0 | 1 | 0 | 3 | 0 | 0 | 4 | |
| Quercus pubescens | 0 | 0 | 0 | 0 | 0 | 0 | 0 | 0 | 0 | 2 | 0 | 2 | 0 | 4 | |
| Quercus ilex | 0 | 0 | 0 | 0 | 0 | 0 | 0 | 0 | 0 | 0 | 0 | 0 | 4 | 4 | |
| Total | 4 | 4 | 3 | 4 | 4 | 3 | 2 | 0 | 6 | 8 | 7 | 2 | 5 | 52 | |
Tab. 5 - Producer accuracy (PA) and user accuracy (UA) for families based on the M3 model.
| Family | PA (%) |
UA (%) |
|---|---|---|
| Pinaceae | 75 | 100 |
| Cupressaceae | 75 | 100 |
| Lauraceae | 100 | 80 |
| Juglandaceae | 100 | 100 |
| Salicaceae | 50 | 67 |
| Moraceae | 50 | 40 |
| Rosaceae | 50 | 57 |
| Fabaceae | 25 | 34 |
| Fagaceae | 75 | 56 |
Tab. 6 - Producer accuracy (PA) and user accuracy (UA) for species based on the M3 model.
| Species | PA (%) |
UA (%) |
|---|---|---|
| Cedrus atlantica | 100 | 100 |
| Pinus nigra | 100 | 100 |
| Cupressus sempervirens | 75 | 100 |
| Laurus nobilis | 100 | 100 |
| Juglans regia | 100 | 100 |
| Populus nigra | 50 | 67 |
| Ficus carica | 50 | 100 |
| Prunus amygdalus | 0 | - |
| Prunus avium | 100 | 67 |
| Robinia pseudoacacia | 50 | 25 |
| Quercus cerris | 75 | 43 |
| Quercus pubescens | 50 | 100 |
| Quercus ilex | 100 | 80 |
The two matrices return an accurate representation of statistical classification, and incorrect classifications based on the M3 model occur especially for the Fabaceae family (PA = 25% and UA = 33.3%) and regarding species as Prunus amygadalus (PA = 0% - Tab. 5 and Tab. 6).
In Tab. 7, the protonated measurement masses presenting high VIP scores for taxonomic, families, or species discrimination based on the three different models are shown. In particular, it is worth noting that the chemical species with higher significance for hardwoods and softwoods discrimination in the M1 model were m/z = 81.070 (TI: monoterpene fragment) and m/z = 205.195 (TI: sesquiterpenes), but in the other two models these masses were no longer suitable for taxonomic discrimination. On the other hand, compounds with higher VIP value that are able to discriminate families and species, both in M1 and M2 models and in some cases also in the M3 model, are m/z = 33.033 (TI: methanol), m/z = 43.050 (TI: alkyl fragment), m/z = 45.033 (TI: acetaldehyde), m/z = 47.049 (TI: ethanol), m/z = 61.028 (TI: acetic acid), and m/z = 123.116 (sesquiterpene fragment).
Tab. 7 - Protonated masses having VIP scores higher than 2 (in italic) among the three PLSDA models.
Protonated measured m/z |
VIP scores | ||||||||
|---|---|---|---|---|---|---|---|---|---|
| M1 | M2 | M3 | |||||||
| Hard/ softwood |
Families | Species | Hard/ softwood |
Families | Species | Hard/ softwood |
Families | Species | |
| 27.022 | 0.969 | 0.855 | 0.918 | 1.776 | 2.508 | 2.056 | 0.745 | 1.712 | 1.703 |
| 33.033 | 0.582 | 3.462 | 3.039 | 3.391 | 2.348 | 3.569 | 1.172 | 1.933 | 1.947 |
| 39.020 | 1.238 | 0.803 | 1.129 | 1.682 | 3.152 | 3.166 | 0.835 | 1.928 | 2.475 |
| 41.038 | 1.288 | 0.757 | 0.722 | 1.911 | 2.531 | 2.259 | 1.253 | 1.524 | 1.521 |
| 43.050 | 0.953 | 2.110 | 2.363 | 2.385 | 2.833 | 2.452 | 1.313 | 1.515 | 2.103 |
| 45.033 | 1.057 | 2.511 | 2.169 | 1.528 | 3.772 | 4.372 | 0.799 | 1.927 | 2.238 |
| 47.049 | 1.011 | 2.083 | 3.908 | 1.657 | 5.002 | 3.686 | 1.081 | 2.761 | 2.970 |
| 49.011 | 0.492 | 3.944 | 3.351 | 0.000 | 0.000 | 0.000 | 0.582 | 3.334 | 2.308 |
| 53.040 | 1.266 | 0.932 | 1.308 | 1.773 | 2.434 | 1.883 | 1.338 | 1.612 | 1.803 |
| 55.055 | 1.290 | 0.839 | 1.142 | 1.491 | 4.360 | 3.819 | 1.219 | 1.996 | 2.135 |
| 59.049 | 1.144 | 0.782 | 0.624 | 1.751 | 3.430 | 3.005 | 1.072 | 2.158 | 2.633 |
| 61.028 | 0.453 | 2.829 | 4.059 | 2.889 | 3.712 | 3.963 | 0.809 | 2.344 | 2.888 |
| 69.069 | 1.290 | 0.774 | 0.989 | 1.865 | 2.560 | 1.978 | 1.295 | 1.406 | 1.638 |
| 75.043 | 0.642 | 2.565 | 3.597 | 0.000 | 0.000 | 0.000 | 0.614 | 1.976 | 2.212 |
| 77.038 | 1.281 | 0.819 | 1.152 | 1.549 | 2.150 | 2.063 | 1.196 | 1.473 | 1.636 |
| 79.054 | 1.359 | 1.050 | 0.874 | 2.793 | 1.743 | 1.822 | 1.542 | 1.592 | 1.571 |
| 81.070 | 2.363 | 2.565 | 2.822 | 1.997 | 2.351 | 1.877 | 1.649 | 1.990 | 1.883 |
| 89.059 | 0.880 | 1.201 | 1.563 | 0.000 | 0.000 | 0.000 | 0.766 | 2.007 | 1.558 |
| 91.054 | 0.923 | 1.399 | 1.380 | 1.857 | 4.842 | 3.371 | 1.399 | 2.086 | 2.198 |
| 95.086 | 1.192 | 0.792 | 0.786 | 2.291 | 2.957 | 1.626 | 1.770 | 1.543 | 1.358 |
| 107.085 | 0.413 | 2.913 | 2.839 | 0.000 | 0.000 | 0.000 | 0.758 | 1.302 | 2.074 |
| 123.116 | 1.133 | 3.301 | 3.287 | 2.245 | 3.005 | 2.804 | 1.088 | 2.948 | 2.597 |
| 137.137 | 1.270 | 0.734 | 0.892 | 1.791 | 2.448 | 2.023 | 1.387 | 1.389 | 1.862 |
| 153.126 | 0.929 | 0.869 | 0.912 | 0.000 | 0.000 | 0.000 | 0.784 | 2.095 | 1.767 |
| 169.090 | 0.944 | 2.018 | 1.299 | 0.000 | 0.000 | 0.000 | 0.655 | 0.709 | 1.134 |
| 189.165 | 2.228 | 2.669 | 3.134 | 0.000 | 0.000 | 0.000 | 1.054 | 1.141 | 1.609 |
| 203.180 | 2.084 | 1.856 | 2.865 | 0.000 | 0.000 | 0.000 | 1.185 | 1.145 | 1.303 |
| 205.195 | 2.489 | 2.364 | 3.319 | 0.000 | 0.000 | 0.000 | 1.224 | 1.404 | 1.791 |
The M1 model confirms that VOC emissions tend to decrease with time; in fact, green wood samples are characterized by a multiplicity of compounds not present or negligible in wood after a few moisture cycles. Softwoods and hardwoods are still discerned (> 79% for all sampling-analysis time), whereas the predictive capability for families, and especially for species, drastically decreases even as soon as T2. Even applying the M2 model, it is possible to distinguish between softwoods and hardwoods with a mean % value of at least 66.7% for T1; nevertheless, this model is able to identify families and species with a mean % value higher than 50% only at the T3 sampling time.
The M3 model maintains an accurate predictive capacity only because it also contains the data obtained with measurements carried out on fresh wood, in the absence of which the prediction capability of the models becomes very poor (as shown by Model 2).
Despite the usefulness of the three models in using VOCs as a possible tool for identifying species, families, or groups, the statistical analysis clearly showed the significant difference between the measurements at T1 (green wood) and the measurements after a few cycles of moisture variation (T2 to T4).
In particular, the results of this study indicate that after the first cycles, both softwood and hardwood species tend to converge towards a common class of compounds, but a small residue of terpenes persists in the case of softwoods. It seems that green wood is still rich in compounds originated from physiological activity of the tree. Furthermore, it seems that the majority of these compounds are very volatile and, during moisture cycles, the residual compounds measured can be correlated to the processes of structural modification of the cell walls. This explanation is confirmed by studies carried out on aged wood that show a lower content of hemicellulose and a significant reduction of its hygroscopicity ([26]). This analysis of VOCs indicates that such process starts when the first drying of wood occurs, and the tests on extractives and microbial-free wood allows us to exclude the influence of these two factors on the products emitted.
In this study, moisture cycles were used to simulate and accelerate a natural wood process which occurs gradually over time, with a rate that can change according to wood species and timber thickness. Further investigation are required in order to assess whether water and moisture changes inside wood have an active role in the alteration of polymers. However, despite the fact that heat treatment changes the composition of wood permanently and modifies the emission of VOCs from the material (e.g., increasing the emission of furfural that is the main thermal degradation product of hemicellulose), it is interesting to compare our results with those obtained by Manninen et al. ([25]) and Hyttinen et al. ([17]) on Norway spruce (Picea abies), Scot pine (Pinus sylvestris), and European aspen (Populus tremula). In their works, they demonstrated that the emissions of terpenes from softwoods and aldehydes from hardwoods decrease significantly after heat treatment. Assuming that the heat treatment produces an extreme and very intense ageing of wood, this confirms the trend showed by our results and clearly attests to the loss of these compounds by different wood species during normal ageing of wood.
Conclusions
Our results showed that, as a consequence of the moisture cycles applied, the spectra of VOC emissions from wood were significantly changed. Emission rates of all observed compounds decreased after only a few moisture (ageing) cycles. Moreover, we did not observe any increase in the emissions of specific compounds or the presence of new compounds during the simulated ageing.
The statistical analysis showed that the two PLSDA models (M1 and M2) based on a single set of measurements (T1 and T4, respectively) were not suitable for discriminating among groups of aged wood samples (hardwoods vs. softwoods, families and species), whereas using the M3 model allowed to correctly discriminate between softwoods and hardwoods. This depends on the fact that the M3 model also contains the data set acquired at T1 (green wood), combined with the other 3 datasets (T2, T3, T4).
During the moisture cycles, wood VOC emissions were subjected to quantitative and qualitative modification of the acquired spectra in all the species studied. Apparently, losing the compounds produced by the metabolic activity of the tree, the wood emits compounds that possibly stem from structural changes and degradation processes of the main polymers constituting the cell wall. These polymers are common to all wood species, with slight differences in their chemical composition. These results clearly indicate that the analysis of VOCs might be applied to the identification of wood species only on very fresh wood, when the wood material still contains all the classes of compounds characterized by strong volatility. As soon as the natural cycle of variation in the moisture content (i.e. moisture desorption and adsorption) begins, the composition of emissions changes, making wood identification by VOCs very hard even at the highest hierarchical level of taxa (i.e., families).
The results of this study do not clarify the role of water in the observed processes. Further studies are needed to elucidate if water can be considered only as a VOC carrier or it has an active role in the hydrolysis of wood polymers (or both of these processes). Specific treatments (Soxhlet extraction and UV treatment) applied to a separate and supplementary set of samples of Norway spruce (Picea abies) allowed us to exclude the potential effect of microbiological activity or extractives on the observed results.
In this study both the nature and the amount of VOCs emitted by wood at different times seem to indicate that the native organization of the wooden structural polymers (i.e., cellulose, hemicellulose, lignin, and their reciprocal bonding) starts to be modified immediately after the first exposure to the external environment, initiating a process of ageing that can affect the physical, mechanical, and acoustical properties of wood, and whose practical consequences are only recognizable over very long periods of time.
Extending the analysis of VOCs by PTR-TOF-MS on increasingly aged and naturally aged wood samples, will help verify the presence of new signals to be possibly matched with specific degradation processes of wood components.
Acknowledgements
Part of this study was funded by the project “ALForLab” (PON03PE_00024_1) co-funded by the Italian National Operational Programme for Research and Competitiveness (PON R&C) 2007-2013, through the European Regional Development Fund (ERDF) and the national resource Revolving Fund - Cohesion Action Plan (CAP) MIUR.
References
Gscholar
CrossRef | Gscholar
CrossRef | Gscholar
CrossRef | Gscholar
CrossRef | Gscholar
CrossRef | Gscholar
CrossRef | Gscholar
Online | Gscholar
Gscholar
Authors’ Info
Authors’ Affiliation
Marco Fioravanti
Università degli Studi di Firenze, Dipartimento di Gestione dei Sistemi Agrari, Alimentari e Forestali (GESAAF), v. San Bonaventura 13, I-50145 Firenze (Italy)
Werther Guidi Nissim
Stefano Mancuso
Università degli Studi di Firenze, Dipartimento di Scienze delle Produzioni Agroalimentari e dell’Ambiente, v.le delle Idee 30, I-50019 Sesto Fiorentino, Firenze (Italy)
Paolo Menesatti
Consiglio per la ricerca in agricoltura e l’analisi dell’economia agraria (CREA) - Unità di ricerca per l’ingegneria agraria, v. del Pascolare 16, I-00015 Monterotondo Scalo (RM - Italy)
Corresponding author
Paper Info
Citation
Sassoli M, Taiti C, Guidi Nissim W, Costa C, Mancuso S, Menesatti P, Fioravanti M (2017). Characterization of VOC emission profile of different wood species during moisture cycles. iForest 10: 576-584. - doi: 10.3832/ifor2259-010
Academic Editor
Giacomo Goli
Paper history
Received: Oct 19, 2016
Accepted: Mar 29, 2017
First online: May 08, 2017
Publication Date: Jun 30, 2017
Publication Time: 1.33 months
Copyright Information
© SISEF - The Italian Society of Silviculture and Forest Ecology 2017
Open Access
This article is distributed under the terms of the Creative Commons Attribution-Non Commercial 4.0 International (https://creativecommons.org/licenses/by-nc/4.0/), which permits unrestricted use, distribution, and reproduction in any medium, provided you give appropriate credit to the original author(s) and the source, provide a link to the Creative Commons license, and indicate if changes were made.

Web Metrics
Breakdown by View Type
Article Usage
Total Article Views: 55906
(from publication date up to now)
Breakdown by View Type
HTML Page Views: 46454
Abstract Page Views: 3843
PDF Downloads: 4158
Citation/Reference Downloads: 40
XML Downloads: 1411
Web Metrics
Days since publication: 3348
Overall contacts: 55906
Avg. contacts per week: 116.89
Article Citations
Article citations are based on data periodically collected from the Clarivate Web of Science web site
(last update: Mar 2025)
Total number of cites (since 2017): 7
Average cites per year: 0.78
Publication Metrics
by Dimensions ©
Articles citing this article
List of the papers citing this article based on CrossRef Cited-by.
Related Contents
iForest Similar Articles
Research Articles
Changes in moisture exclusion efficiency and crystallinity of thermally modified wood with aging
vol. 12, pp. 92-97 (online: 24 January 2019)
Review Papers
Moisture in modified wood and its relevance for fungal decay
vol. 11, pp. 418-422 (online: 05 June 2018)
Research Articles
NIR-based models for estimating selected physical and chemical wood properties from fast-growing plantations
vol. 15, pp. 372-380 (online: 05 October 2022)
Research Articles
Estimation of total extractive content of wood from planted and native forests by near infrared spectroscopy
vol. 14, pp. 18-25 (online: 09 January 2021)
Short Communications
Changes in Populus sp. wood subjected to heat treatment: anatomy and silica content
vol. 18, pp. 223-226 (online: 09 August 2025)
Research Articles
Physical, chemical and mechanical properties of Pinus sylvestris wood at five sites in Portugal
vol. 10, pp. 669-679 (online: 11 July 2017)
Research Articles
Density, extractives and decay resistance variabilities within branch wood from four agroforestry hardwood species
vol. 14, pp. 212-220 (online: 02 May 2021)
Research Articles
Identification of wood from the Amazon by characteristics of Haralick and Neural Network: image segmentation and polishing of the surface
vol. 15, pp. 234-239 (online: 14 July 2022)
Research Articles
Examining the evolution and convergence of wood modification and environmental impact assessment in research
vol. 10, pp. 879-885 (online: 06 November 2017)
Research Articles
Mechanical and physical properties of Cunninghamia lanceolata wood decayed by brown rot
vol. 12, pp. 317-322 (online: 06 June 2019)
iForest Database Search
Search By Author
Search By Keyword
Google Scholar Search
Citing Articles
Search By Author
Search By Keywords
PubMed Search
Search By Author
Search By Keyword


