Use of terrestrial laser scanning to evaluate the spatial distribution of soil disturbance by skidding operations
iForest - Biogeosciences and Forestry, Volume 8, Issue 3, Pages 386-393 (2015)
doi: https://doi.org/10.3832/ifor1165-007
Published: Oct 08, 2014 - Copyright © 2015 SISEF
Research Articles
Abstract
We investigated the disturbance to the surface of a skid trail caused by removing cut timber from inside the forest to the roadside by dragging using terrestrial laser scanning technology. We scanned the study site prior to taking any action, after skidding and after implementing post-harvesting reinstatement to the surface of the skid trail. From the point cloud obtained, we derived an irregular point field. We generated a triangulated irregular network which we then interpolated into a raster digital terrain model with a resolution of 1cm. By comparing the digital terrain models, we analysed the influence of skidding the timber and the influence of post-harvesting reinstatement upon the surface of the skid trail. The surface of the skid trail was most significantly affected in the area where the harvested logs were extracted and stacked for hauling. In the centre section of the trail, where the logs were dragged by a tractor, quite deep tracks were created and the intensity of soil disturbance was comparable to the handling section. The lowest intensity of soil disturbance was found in the area where the skid trail met the roadside. The post-harvesting reinstatement of the working area resulted in levelling the surface of the skid trail and the deepest tracks were filled in. The post-harvesting reinstatement caused a 12% increase of the volume of ruts, a 49% decrease of the volume of mounds of soil and a 6% increase of total soil volume change.
Keywords
Terrestrial Laser Scanning, Skidding Operation, Soil Disturbance, Precision Forestry
Introduction
The movement of harvesting and transportation machinery on the forest floor and the dragging of logs on the ground disturb and compress the forest soil. By compressing the soil, its porosity decreases, causing a decrease in its infiltration properties and soil aeration, a change in the hydrological processes and thermal regime of the soil, an increase in the flow of surface water and a decrease in its microbiological processes ([8]). The removal and disturbance of harvesting residues reduce also the quality of the forest soil. The negative consequences caused by disturbance to the forest soil may result in a long-term struggle for root growth and a decrease in the nutrients received by trees, leading to a decrease in the production of wood mass, and disturbance to forest regeneration ([22]). The intensity of soil disturbance is related to many factors such as steepness of the slope, number of skidder passes, season of logging, site characteristics and vehicle construction ([14], [11], [1]).
Research on the effects of harvesting on the cause of ruts is usually based on manual measurements of cross-sectional and longitudinal profiles on skid trails. The vertical distance of a ruler to the terrain is measured at regular intervals. The distance of manual sampling along the ruler varies from 10 to 50 cm ([15], [1]). The resolution of measurements can be improved by using a specially designed profile meter ([18]). The distance between sampling lines is usually several meters. In order to capture and analyze the spatial distribution of soil disturbance more accurately, application of a modern geoinformation technology is suitable.
Terrestrial laser scanning (TLS) is an advanced technology which allows to obtain very accurate and detailed data about natural and technical objects. It is based on measuring distances using a laser beam, and allows to capture the position of the surrounding objects. Modern devices are equipped with an internal color camera which allows the assignment of colors to points during data post-processing. Based on the point cloud created, measurements of the position and distance of objects can be carried out and three-dimensional models can be created.
Significant attention has recently been paid to the possibility of using terrestrial laser scanning in forestry. The main applications include deriving the basic characteristics of a forest stand. To determine the position, the diameter at breast height, the height and the basal area of trees, we can use methods based on finding and measuring cross-sections of standing trees ([3]), cluster analyses, analyses of the geometric properties of the point cloud ([5]), voxel data structures ([17]), as well as complex approaches which use the distance, intensity and color of points ([2]).
From the point cloud, we may determine the shape, dimensions and height of a tree crown ([16]), create a geometric model of a tree crown and calculate its volume ([7]), while detailed data about crowns may be used for analyzing competitive relationships between the trees in a forest ecosystem ([20]). Kankare et al. ([13]) proposed a method for stating the volume of a trunk and living and dead branches from a dense point cloud, which allows precise estimates of the single-tree-level aboveground biomass (AGB).
Data from terrestrial laser scanning has been successfully used in monitoring landslides, obtaining information about the structure, size, cross-sectional profiles and geometric shapes of landslides ([6], [21]). An overview of possible applications of terrestrial and aerial laser scanning for monitoring landslides, rock falls and flow of debris is given in Jaboyedoff et al. ([12]). High-resolution digital terrain models (DTM) based on data from terrestrial laser scanning were used by Grayson et al. ([9]) to measure the intensity of erosion across a peatland. The high precision and high accuracy of DTMs created from TLS data allow for the monitoring of spatio-temporal changes to surface roughness and microtopography ([10]).
The aim of our work was to investigate the possibilities of using terrestrial laser scanning to precisely measure and evaluate soil disturbance on skid trails caused by skidding wood in a forest stand. The first partial aim was to create detailed digital terrain models with very high resolution which would capture the surface of a skid trail after the realization of selected operations while yarding timber. The second partial aim was to compare the digital terrain models and evaluate the intensity of soil disturbance in various sections of the skid trail.
Materials and methods
Study site
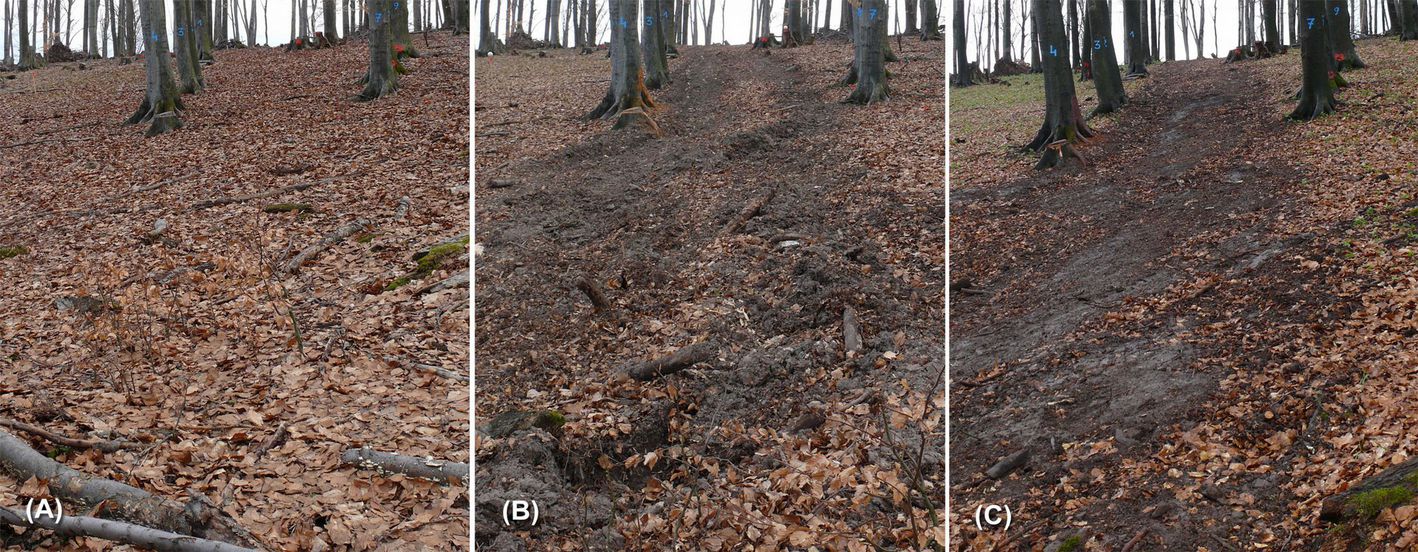
The study was carried out in a commercial forest managed by the Forests of the Slovak Republic, Banská Bystrica, a state enterprise. The study plot (18 × 52 m) was established in the protected area of Štiavnické vrchy in central Slovakia, and located inside an even-aged forest stand (110 years old - Fig. 1). Most represented species were common beech (Fagus sylvatica L. - 55%, mean height: 30 m, mean diameter: 37 cm) and sessile oak (Quercus petraea Matt. - 37%, mean height: 25 m, mean diameter: 34 cm). Common hornbeam (Carpinus betulus L.) and silver fir (Abies alba Mill.) had a lower representation in the stand (5 % each).
Fig. 1 - The skid trail before skidding (A), after skidding (B), and after post-harvesting reinstatement (C).
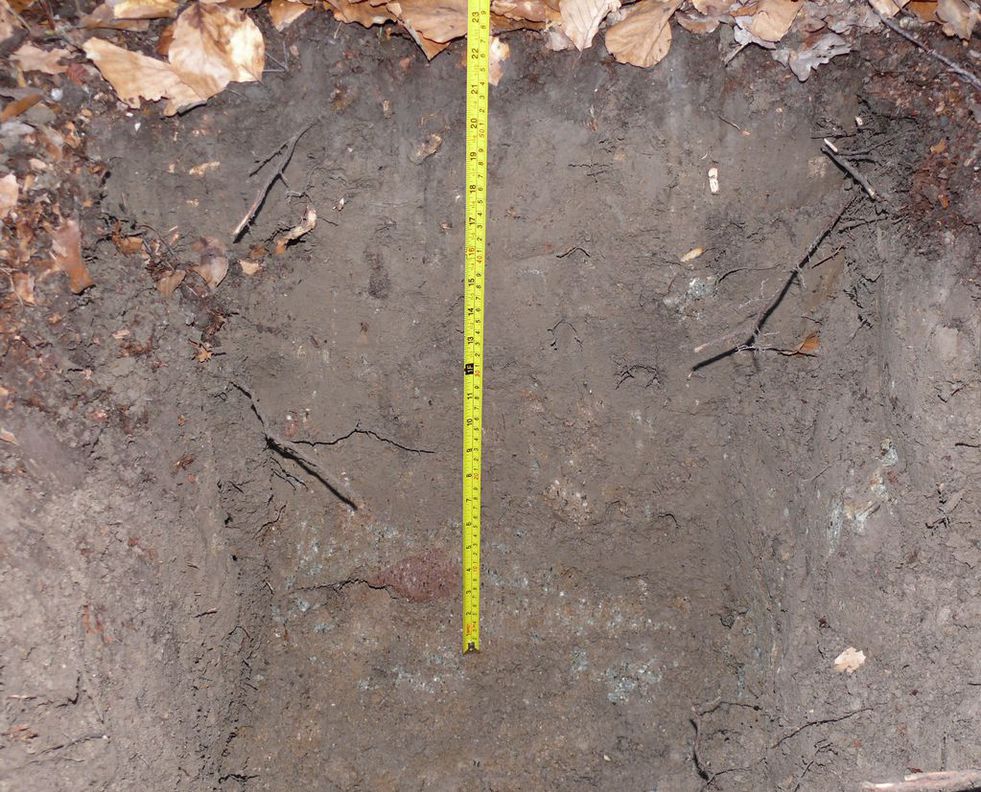
The type and depth of soil was determined using a soil probe (Fig. 2). The soil at the study site developed from volcanic material and may be classified amongst cambisol-andosol soils. The depth of horizon A was 6-8 cm and horizon B was 30-35 cm deep, with fragmented and partially weathered andesites clearly visible in the horizon C. Horizon C was more than 50 cm deep. The soil’s surface was continuously covered with a thin layer of leaf litter.
We carried out terrestrial laser scanning on the study site when thinning took place in the stand using the strip shelterwood silvicultural system. Harvesting was carried out in the lower part of the study site. A traditional tree length harvesting method was used. Raw logs were skidded to the loading site using a LKT 81 Turbo forest wheeled tractor. The tractor had a diesel engine with 74kW power, and it was equipped with a winch, blade and 16.9-30 12 PR tyres. The kerb weight of the tractor was 7 tonnes. Following the stated technical parameters, the nominal pressure of tractor tyres on the soil reached approximately 195 kPa.
The tractor passes over the skid trail were documented. We recorded the number of passes by the forest wheeled tractor on the skid trail, and the number and volume of the logs skidded (Tab. 1). To estimate the weight of the extracted logs, we used the nominal weight of raw beech timber 1.15 t m-3. The average slope of the skid trail was 19%. All logs were dragged in an uphill direction.
Tab. 1 - Number and volume of skidded logs in the study area.
| Drive no. |
No. of logs | Volume (m3) |
Weight (t) |
|---|---|---|---|
| 1 | 4 | 2.52 | 2.90 |
| 2 | 3 | 2.24 | 2.58 |
| 3 | 1 | 2.33 | 2.68 |
| 4 | 1 | 1.86 | 2.14 |
| 5 | 2 | 1.60 | 1.84 |
| 6 | 3 | 2.14 | 2.46 |
| Total | 14 | 12.69 | 14.59 |
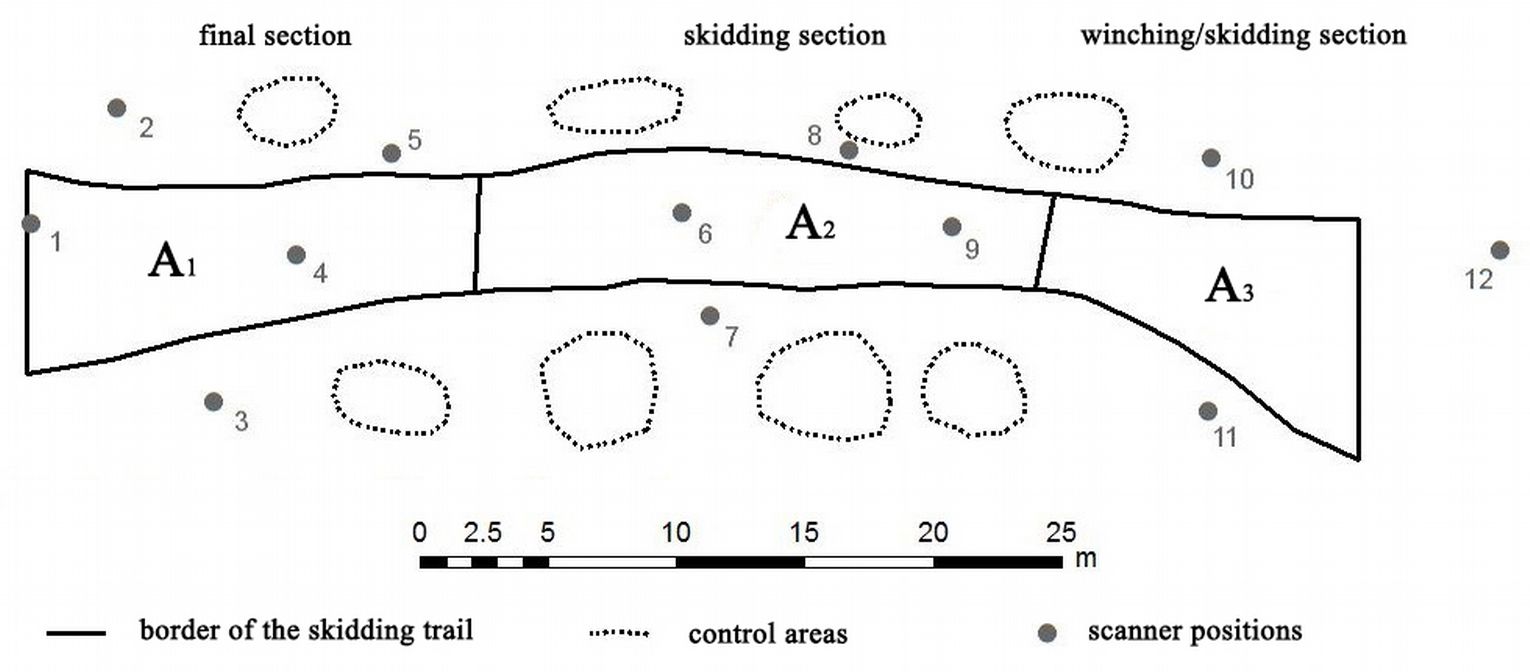
The border of the skid trail area where work activities took place was marked with a polygon and divided into three sections: (i) A1 - final section, the section of the trail close to the loading bay, where the skid trail meets the roadside; (ii) A2 - skidding section, the middle part of the trail where logs were skidded; (iii) A3 - winching/skidding section, the first section of the trail where logs were winched to the trail before skidding. Moreover, several control areas C were selected and marked in undisturbed areas adjacent to the skidding trail, not affected by work activities and snow melting (Fig. 3).
Fig. 3 - Scheme of the study area with the indication of the skid trail sections analyzed for soil disturbance. More information are reported in Tab. 2.
In the skid trail sections and in the control areas, we randomly generated samples with a density of 4 points per square meter (Tab. 2). Samples were used for the statistical evaluation of the differences between the derived DTMs.
Tab. 2 - Characteristics of the skid trail sections analyzed in this study. Number of samples refers to a number of randomly generated points used for statistical evaluation
| Section | Area (m2) | Number of samples |
|---|---|---|
| A1 final section | 101.96 | 408 |
| A2 skidding section | 103.76 | 415 |
| A3 winching/ skidding section |
73.69 | 295 |
| C control areas | 85.36 | 341 |
| Total | 364.77 | 1459 |
TLS survey
The study site was scanned three times: before logging, after skidding and after the post-harvesting reinstatement. We used a Faro Focus 3D terrestrial laser scanner, with a resolution of 3mm/10m.
The first scan was carried out before skidding the timber, when still snow residuals were present on the ground at the edges of the study area, therefore not influencing the measurements on the skid trail. We extracted a segment of the point cloud in such a way that it did not intrude into areas covered by snow.
Significant changes in the terrain occurred while skidding the timber in the study site. Tracks made by tractor wheels were deep, and in some places close to the skid trail the soil was pushed to the sides and mounds of soil accumulated, causing the shading of some spots on the ground. For that reason, the laser scanner was set in close vicinity to, or even directly on the skid trail, in such a way the laser beam struck the terrain at various angles, penetrating inside the tracks and gullies present on the ground.
Prior to the terrestrial laser scanning, 15 reference spheres of size 14.4 cm and covered by reflecting white paint were placed around the study site, attached to either stumps from previous harvesting or wooden stakes. The position of the reference spheres did not change throughout the scanning, allowing a precise geo-referencing of scans taken in different periods into a joint local coordinate system.
We carried out a total of 32 scans of the study site (Tab. 3). All scans were referenced together in order to ensure their correct placement in the joint local coordinate system. Before referencing, the point cloud was colored using photographs obtained by the scanner’s internal camera. We then used a function for automatic searching of the reference spheres in the point cloud, which were subsequently verified by visual inspection. Incorrectly localized reference spheres were manually removed, while those correctly localized were used for the automatic placement of point clouds in the scans.
Tab. 3 - Dates and number of TLS scans carried out at the study site.
| Point cloud | Date | No. of scans |
|---|---|---|
| Before harvesting | 11.04.2013 | 10 |
| After harvesting | 17.04.2013 | 12 |
| After post-harvesting reinstatement | 22.04.2013 | 10 |
As a basic reference scan, we selected a scan taken in the center of the skid trail after skidding the timber. The position of this scan did not change over the referencing process, thus the coordinates of other scans were re-calculated based on this reference.
Data processing and analysis
The creation of a digital terrain model is the first step in processing a point cloud for most applications in forestry. A digital terrain model is required for creating horizontal cross-cuts of a point cloud, measuring tree height or crowns, modeling trunks, etc. The generation of high-precision DTM consisted of eight steps (Fig. 4).
Fig. 4 - Outline of the procedure adopted for the creation of the digital terrain models (DTMs) from the TLS data.
First, we created three point clouds from colored and referenced scans. Each point cloud was cropped into a rectangular block which corresponded to the study site. The blocks were 54 meters long and 20 meters wide, covering an area 1 m wider than the planned DTMs to ensure full coverage of rasters and to derive the correct heights on the peripheral cells of the rasters. The height of the point cloud blocks was 45 m, which corresponded to the difference in elevation between the lowest ground points and the topmost tree points.
The vertical projection method is a simple and quick procedure commonly used to create DTM from data obtained by TLS. For each cell of the raster, elevation is assigned based on the lowest elevation point found within that cell. The main disadvantage of this method is that the assigned elevation is linked to the cell center, although the point may be anywhere in the cell area. Moreover, if the raster has a high resolution and the terrain is rugged, then it may be that not every cell contains a point.
First, a raster DTM with resolution of 1 m was created using the vertical projection method, and used to filter the trunk and crown of trees from the point cloud. Such DTM provided only a rough representation of the terrain structure at the study site. The raster resolution was selected taking into consideration the maximum diameter of the trees, and the slope and ruggedness of the terrain. Using such low resolution, each raster cell contained points reflected directly from the terrain.
Afterwards, points from the original point cloud showing a height above the DTM higher than 0.5 m were discarded, excluding in this way all the points of the cloud which corresponded to tree trunks and crowns. This simple method was very effective since there was no natural regeneration, vegetation cover, bushes or young or low trees at the study site.
The modified point clouds were used to create very detailed DTMs with a resolution of 1 cm. For each raster cell with a resolution of 2 cm, the point with the lowest elevation was found and its coordinates recorded. Triangulated irregular networks (TIN) were created from the derived elevation points. TINs were then converted into raster DTMs with a resolution of 1 cm using the linear interpolation method.
The raster digital terrain models before skidding (DTM1), after skidding (DTM2) and after post-harvesting reinstatement to the skid trail (DTM3) were compared using map algebra tools, and differences in terrain elevation (Δ) at each map point after each working phase were obtained (Δ21 = DTM2 - DTM1, Δ31 = DTM3 - DTM1).
Unexpectedly, mean differences (MD) between DTMi in the control areas were not null as expected for undisturbed surfaces. This would imply a systematic error in assessing the area and volume of the surface change. Therefore, we added the arithmetic mean of mean differences in the control areas [MD(Δ21)+MD(Δ31)]/2 to DTM1, in order to achieve a minimal mean difference in the DTMs in the control areas. A t-test was used to verify that the mean differences in the control areas were equal to zero after correction of the DTM1.
For the modified digital terrain model DTM′1, we calculated the new differences Δ′21 = DTM2 - DTM′1 and Δ′31 = DTM3 - DTM′1. Finally, the area of different categories of elevation changes in the terrain were calculated in selected sections of the skid trail. We grouped such elevation changes in the following categories: very little change (0-1 cm), little change (1-5 cm), moderate change (5-10 cm), great change (10-20 cm), and very great change (> 20 cm).
Based on the differences between the digital terrain models after each phase, we calculated the volume of ruts (terrain decrease) VD, the volume of the mounds of soil (terrain rise) VR and the total change of soil volume VT = VD+VR. To compare sections of the skid trail with varying sizes, the intensity of the total change of soil volume (m3 m-2) was estimated as follows (eqn. 1):
where S is the area of the section considered. In the same way, we also calculated the intensity of soil volume decrease ID, and the intensity of soil volume rise IR.
Results
High precision digital terrain models
Each of the extracted rectangular blocks contained approximately 700 million points (Mpts), of which almost 80% were directly in the terrain or close to it. The average density of points on the terrain surface was 50 per square centimeter (Tab. 4). Each of the irregular point fields derived from TLS data covered more than 97% of the study site. Elevation data was only missing for a few raster cells.
Tab. 4 - Coverage of the study site by the point cloud. (Pi): number of points in the block (Mpts); (Si): number of points up to 50 cm above the terrain (Mpts); (Di): density of points (Mpts m-2).
| Point cloud | Rectangular block | Up to 50cm above the terrain |
||
|---|---|---|---|---|
| Pi | Di | Si | Di | |
| Before harvesting | 703.6 | 0.651 | 555.9 | 0.515 |
| After harvesting | 781.5 | 0.613 | 612.5 | 0.567 |
| After post-harvesting reinstatement | 640.2 | 0.496 | 496.1 | 0.459 |
An accurate georeferencing of scans is a prerequisite for the correct comparison of digital terrain models taken in different periods. Using the automatic identification function, 6 to 12 reference spheres were correctly found in each scan, as verified afterward by visual inspection. A greater error was found when positioning the furthermost reference spheres, affecting the accuracy in georeferencing the point cloud. Therefore, sphere showing a positional error greater than 5 mm were excluded from the georeferencing step. Overall, the mean error in georeferencing for all scans was 1.8 ± 1.4 (SD) mm.
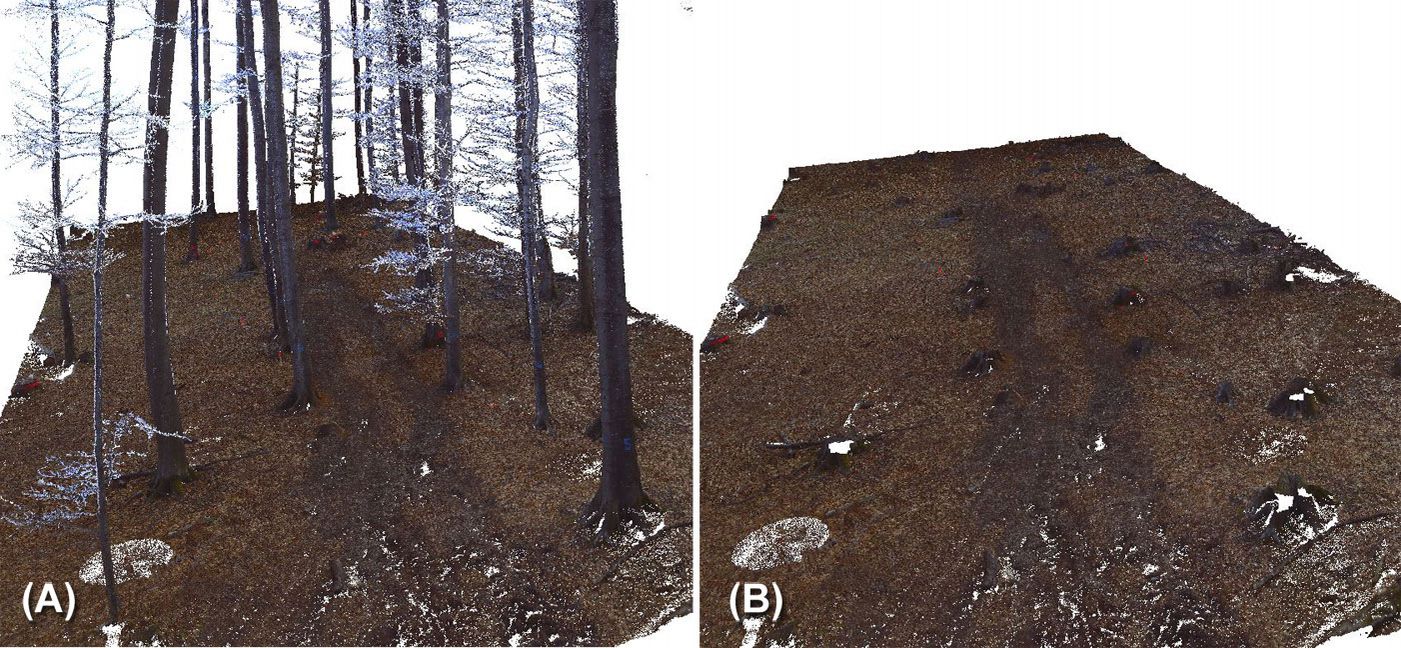
Large point clouds measured using terrestrial laser scanning created an adequate database for deriving an irregular point field of elevations with a high density (Fig. 5). Elevation point fields served for the creation of DTMs with a high precision and accuracy.
Fig. 5 - The point cloud after skidding. (A): Unmodified; (B): after removing trunk and crown of trees using the filtering procedure described in “Material and Methods”.
In order to ascertain changes to the terrain caused by measurement errors, a preliminary assessment of the changes to the soil surface in the control areas was carried out on the raster DTMs with resolution 1 cm. Elevations were calculated from the DTMs for a set of randomly generated points in the control areas, obtaining a standard deviation significantly different from zero (approximately 5 mm - Tab. 5). This was significantly more than the error in georeferencing the point cloud.
Tab. 5 - DEM deviations for the control areas located outside the skid trail (values are reported in centimeters).
| Parameter | Before DTM correction | After DTM correction | ||
|---|---|---|---|---|
| Δ21 | Δ31 | Δ′21 | Δ′31 | |
| Minimum | -7.34 | -7.40 | -7.82 | -7.89 |
| Maximum | 7.59 | 8.44 | 7.11 | 7.95 |
| Arithmetic mean | 0.47 | 0.49 | -0.01 | 0.01 |
| Standard deviation | 0.88 | 0.93 | 0.88 | 0.93 |
Several extreme elevation changes of the terrain (up to 7 cm) were detected after skidding activities in the control areas. A careful visual investigation carried out on such areas revealed that such extreme differences occurred only in very small portion of the ground. Accidental movement of fallen branches, local soil compaction or even movement of people during scanning are the likely causes of the extreme differences found in the control areas.
A systematic movement of the terrain caused by georeferencing errors could negatively affect the results of the terrain change evaluation. Therefore, a correction factor was applied to the DTM before harvesting (DTM1) to obtain a minimal mean difference in the DTMs in the control areas. Each point of the DTM1 was increased by 4.8 mm, which corresponds to the arithmetic mean of DEM deviations estimated for control areas (Tab. 5).
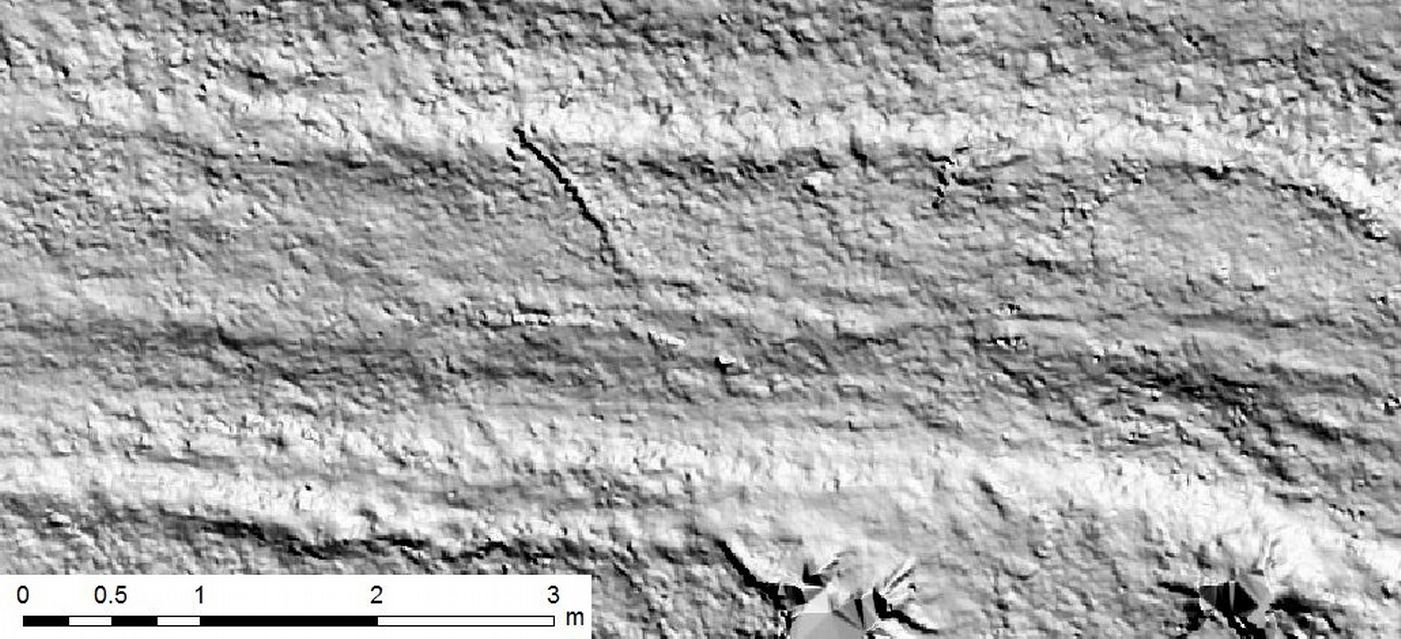
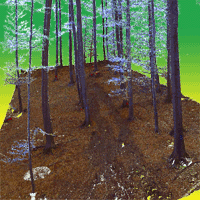
Digital terrain models derived from terrestrial laser scanning data are highly accurate and capture the surface details of soil and tree trunks in full detail (Fig. 6). By scanning with a sufficient density and with suitable positioning of the scanner, it was possible to achieve almost full coverage of the surface of the study area with the point cloud. The DTM created clearly displays all the shapes of the microrelief, tracks after tractor passes, and the other surface changes caused by a tractor on the skid trail.
Changes to the surface of skid trails
Changes caused by harvesting and transport activities
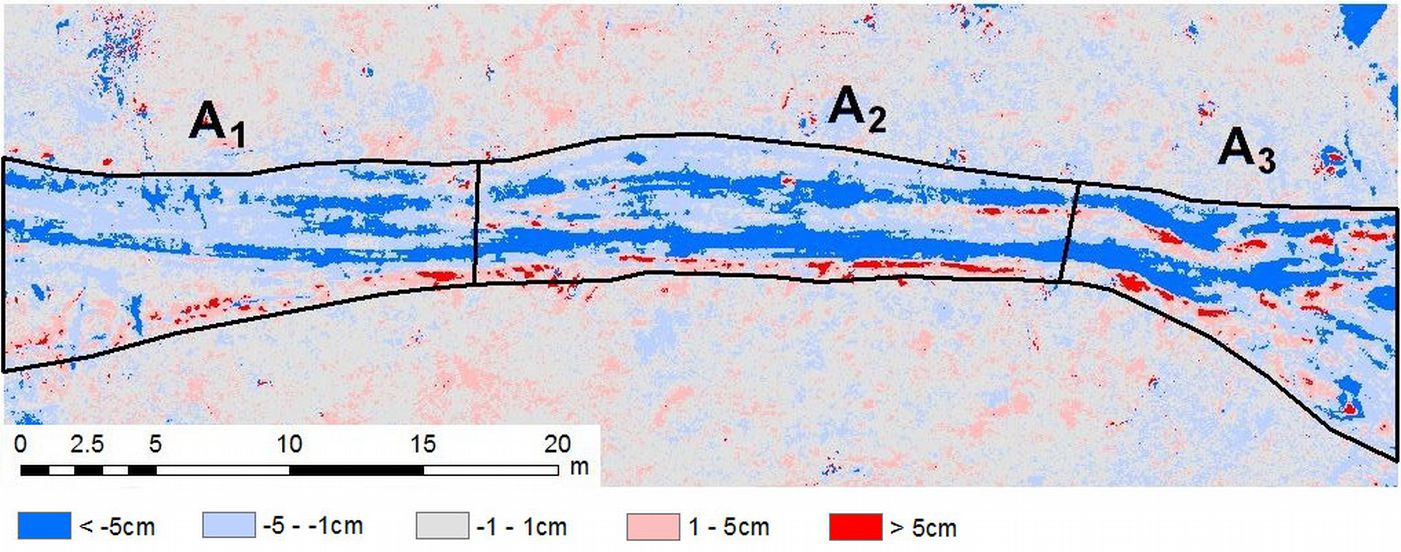
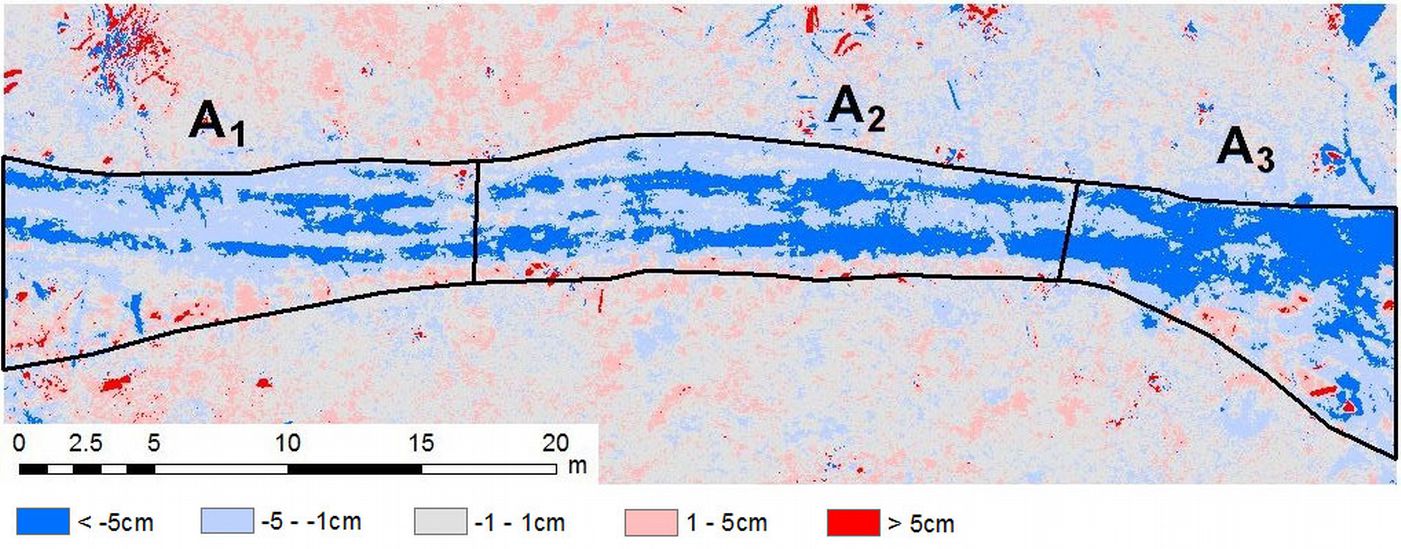
Throughout the skidding, a wheeled forest tractor passed twelve times through the skid trail and dragged logs with a total volume of 12.69 m3 (Tab. 1). According to the TLS data, the largest depression in the terrain due to skidding activities was -37.8 cm and the greatest increase was 32.6 cm. The deepest ruts were created in the mid-section of the skid trail A2 where logs were dragged onto the skid trail (Fig. 7). The greatest mounds of soil (more than 30cm) generated by the harvesting operations were observed in section A3, where the soil was moved by the blade and wheels of the tractor while dragging logs from the stand.
Fig. 7 - Changes to the terrain (calculated as the difference between DTMs values) after the skidding operations.
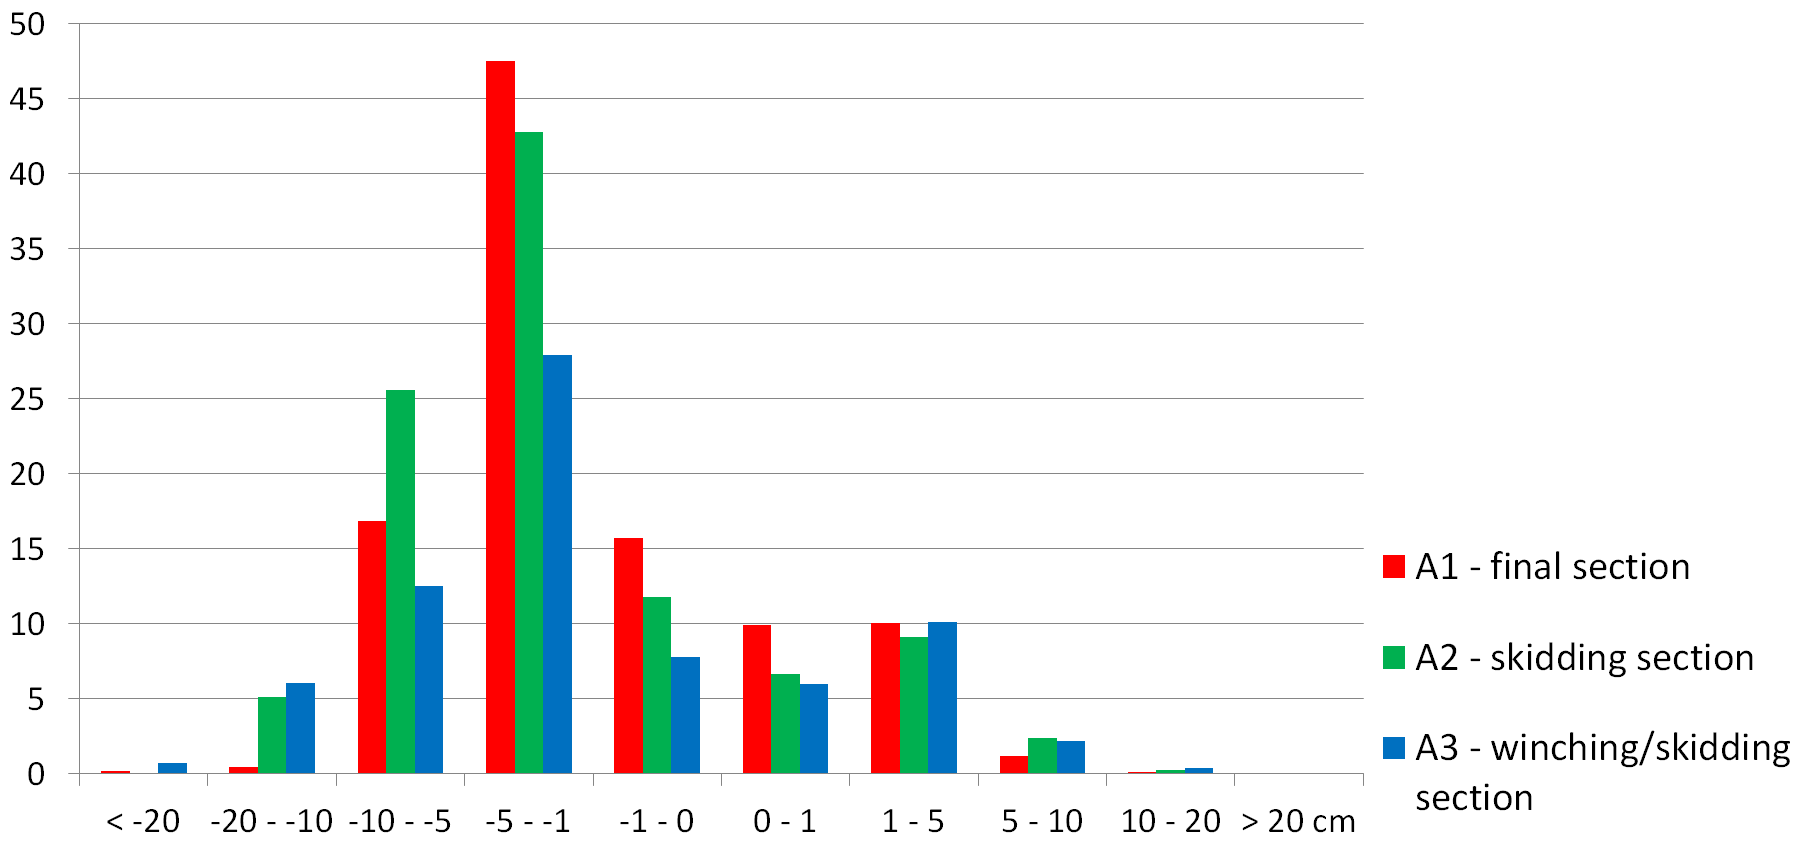
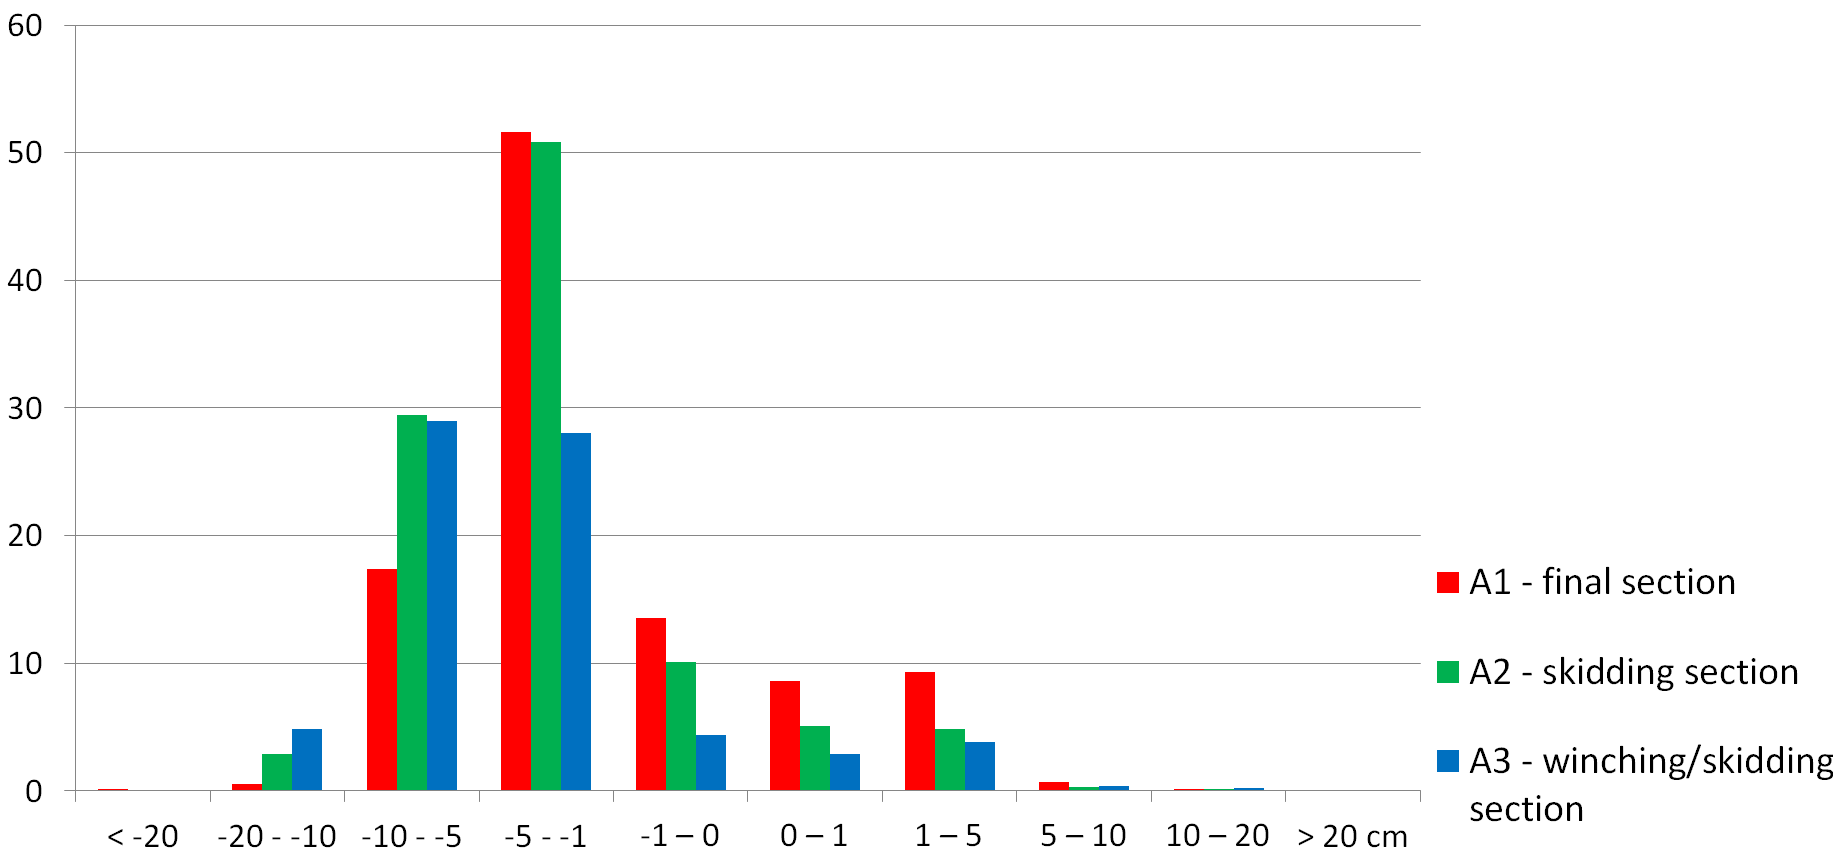
The different nature of disturbance to the soil cover in various sections of the trail is clearly visible in Fig. 8. On the skid trail, there was a prevalence of surface change from 0 to -10 cm, caused by compacting the harvesting residue in the soil upper layer, as well as by the creation of shallow tracks by the tractor wheels. Areas with changes from -5 to 5 cm were the most frequent, occurring almost everywhere close to the skid trail. However, extremely deep tracks or high soil accumulation only occurred in a relatively small area of the skid trail.
In section A3, logs were extracted from the forest stand to the skid trail using a winch and stacked for skidding. When dragging the timber, root swellings and tree stems standing close to the winching trail were damaged. The average decrease in the terrain in this area was -3.0 ± 5.2 cm. Similarly to the mid-section of the skid trail, ruts deeper than 30 cm were also created in section A3.
Significant changes to the terrain also appeared in the mid-section of skid trail A2. Logs were dragged in the direction of the tractor. The front ends of the pulled timber caused the mixing, displacement and compaction of the upper part of the soil and the tractor wheels made tracks deeper than 30 cm. The average surface change was -3.1 ± 4.0 cm, though extreme changes to the terrain up to 23 cm were also recorded in this section of the skid trial.
The raw timber that was skidded had a length of 15 to 25 m. When turning onto the roadside in section A1, the logs deviated from the axis of the skid trail to the outer side of the trail, causing disturbance to the soil away from the skid trail and minor damage to trees standing close to the skid trail. The average decrease in the terrain in this section of the skid trail was -2.2 ± 3.1 cm.
A more even distribution was found for categories of surface change in the section A3. Indeed, soil overflow and deflected soil occurred in this section, along with ruts caused by the skidder deeper than in other sections, as a consequence of the nature of the activities performed and the higher intensity of their effect on the soil cover. In the mid-section of skid trail A2, there was a prevalence of change up to -10 cm, mainly caused by the timber trailing whilst the skidder moved quite quickly and dragged the stems on a gentle slope. Slight soil disturbance was found in the section where the skid trail met the roadside A1. When turning onto the road, the tractor slowed down and the logs deviated from the route, determining the creation of shallow gullies and soil accumulation even outside the skid trail.
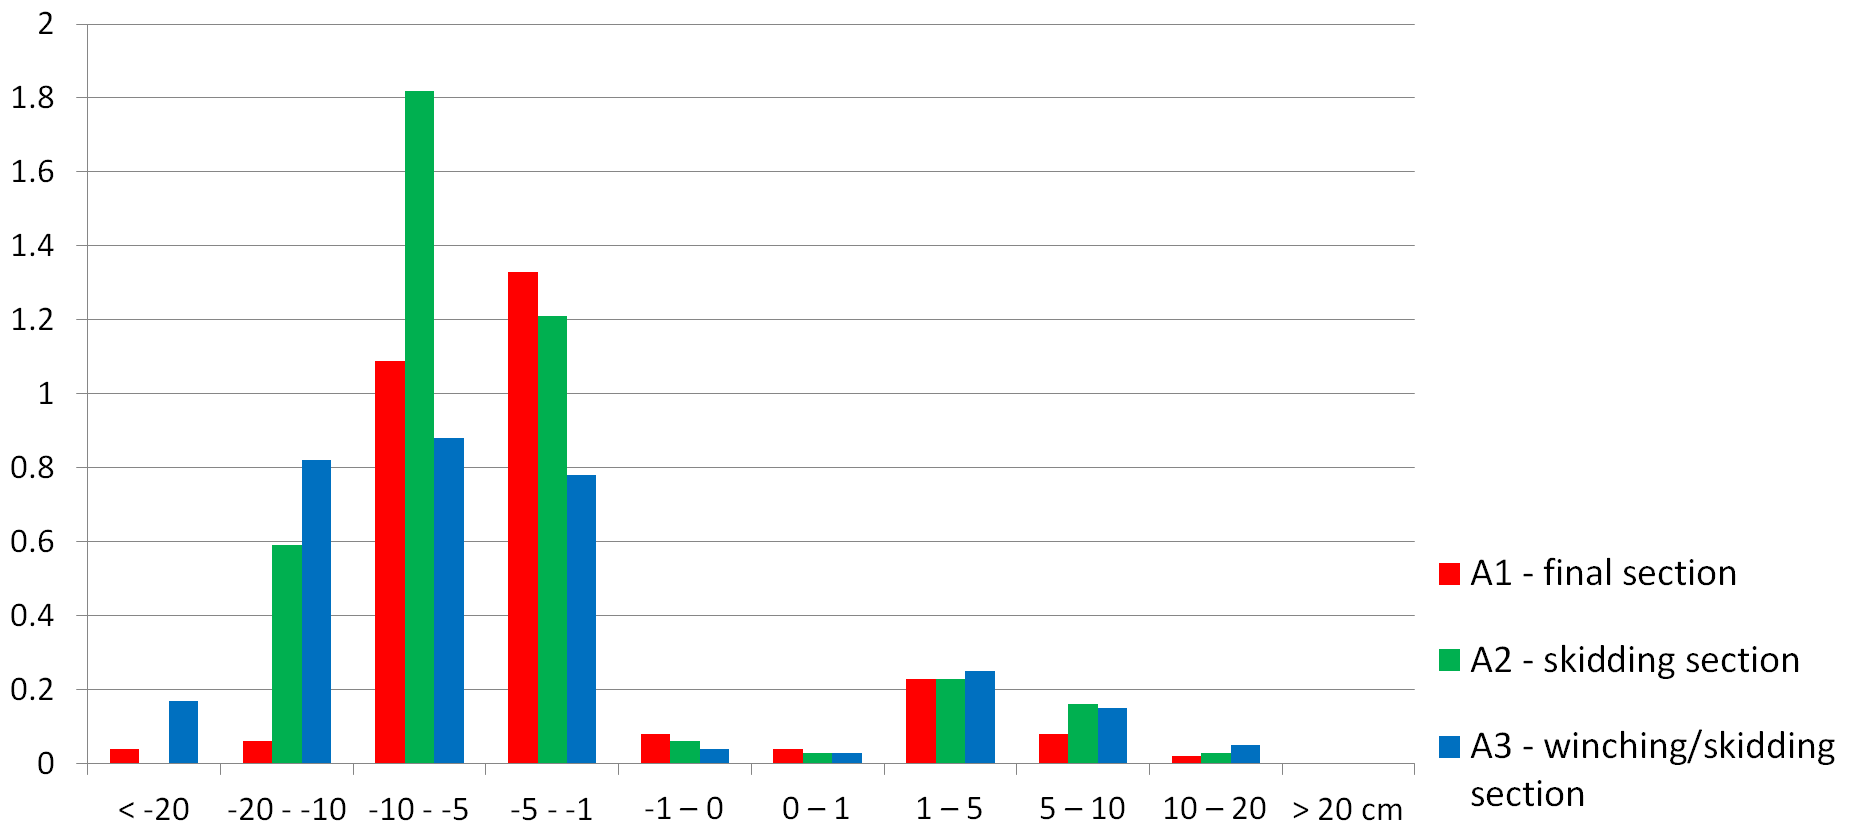
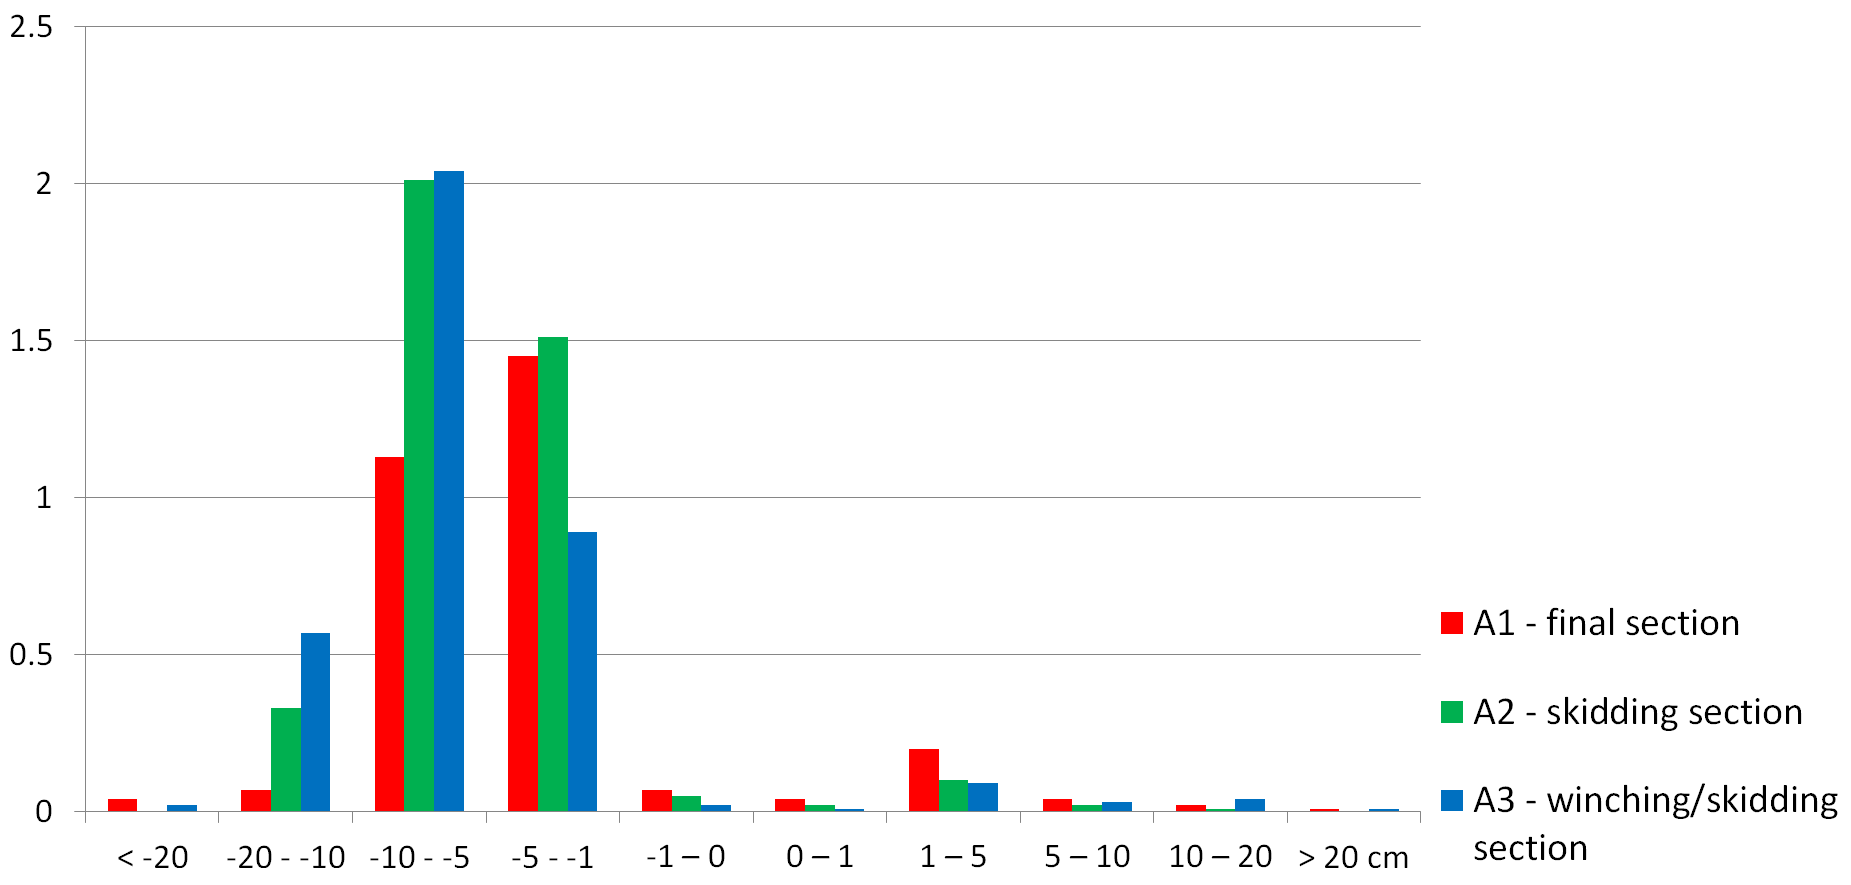
Changes in the volume of soil on the skid trail are reported in Tab. 6. Most of the detected changes were caused by ruts, i.e., soil compaction and displacement due to skidder trafficking. The highest proportion of soil volume decrease was found in sections A1 and A2 of the skid trail. As for rut depth, the largest decrease in soil volume was due to surface changes from -5 to -10 cm (Fig. 9).
Tab. 6 - Changes in the volume of soil after skidding.
| Soil disturbance | A1 | A2 | A3 | Whole area |
||||
|---|---|---|---|---|---|---|---|---|
| m3 | % | m3 | % | m3 | % | m3 | % | |
| Ruts | 2.60 | 87.66 | 3.69 | 89.16 | 2.68 | 85.07 | 8.97 | 87.47 |
| Mounds of soil | 0.37 | 12.34 | 0.45 | 10.84 | 0.47 | 14.93 | 1.28 | 12.53 |
| Total | 2.96 | 100.00 | 4.13 | 100.00 | 3.15 | 100.00 | 10.25 | 100.00 |
The most intense changes in volume were detected in the skid trail section A3 (Tab. 7). Stem extraction and arrangement of loads also contributed to such large changes, in particular with soil mounding. The least intense surface changes were detected in the section A1, where the skid trail joins the roadside.
Tab. 7 - Intensities of soil volume change after skidding (m3 m-2).
| Soil disturbance | A1 | A2 | A3 | Whole area |
|---|---|---|---|---|
| Ruts | 0.025 | 0.036 | 0.036 | 0.032 |
| Mounds of soil | 0.004 | 0.004 | 0.006 | 0.005 |
| Total | 0.029 | 0.040 | 0.043 | 0.037 |
Overall changes to the surface of skid trails
During post-harvesting reinstatement, the logging residues were removed from the surface of the skid trail, ruts and mounds of soil were recovered by a tractor blade and the ground profile was levelled. Deep and conspicuous tracks caused by the skidder’s wheels were filled wherever heavy rain could cause intensive gully soil erosion. Parts of the skid trail where the soil had gathered were also levelled. This soil was removed and used for filling in the ditches and tracks created on the skid trail (Fig. 10).
Fig. 10 - Changes to the terrain (calculated as the difference between DTMs values) post-harvesting reinstatement.
Post-harvesting reinstatement to the workplace resulted in a reduction in extreme changes of the terrain, but at the same time, the area of less intensive changes increased (Fig. 11). The relative amount of displaced soil on the surface of the skidding trail decreased to approximately 10%, mainly due to the soil pushed aside in sections A3 and A2. Such proportion did not change significantly in section A1. In section A3, tracks deeper than -20 cm almost disappeared, but the area with terrain changes up to -10 cm increased significantly. Levelling the surface of the skid trail in section A2 caused an increase in changes to the terrain of up to -10cm to almost 90% of the area. In section A1, there were no significant changes to the terrain surface, indicating an insufficient post-harvesting reinstatement in this section.
The skidder’s movement on the skid trail during post-harvesting reinstatement caused an increase of 12% in the volume of ruts and a decrease of 49% in the volume of soil mounds (Tab. 8). However, the overall change in soil volume did not differ significantly from changes before the post-harvesting operations. The greatest decrease in the volume of soil mounds occurred in sections A3 and A2 of the skid trail. The volume of ruts increased significantly only in section A3.
Tab. 8 - Changes in the volume of soil after work completion.
| Soil disturbance | A1 | A2 | A3 | Whole area |
||||
|---|---|---|---|---|---|---|---|---|
| m3 | % | m3 | % | m3 | % | m3 | % | |
| Ruts | 2.75 | 89.89 | 3.91 | 96.01 | 3.53 | 95.25 | 10.2 | 94.02 |
| Mounds of soil | 0.31 | 10.11 | 0.16 | 3.99 | 0.18 | 4.75 | 0.65 | 5.98 |
| Total | 3.06 | 100.00 | 4.07 | 100.00 | 3.71 | 100.00 | 10.85 | 100.00 |
Post-harvesting reinstatement to the workplace had the least effect on the surface changes in section A1, where the skid trail joins the roadside (Tab. 9). In other sections of the skid trail, post-harvesting reinstatement caused an increase in the intensity of soil volume changes.
Tab. 9 - Intensities of soil volume change after work completion (m3 m-2).
| Soil disturbance | A1 | A2 | A3 | Whole area |
|---|---|---|---|---|
| Ruts | 0.027 | 0.038 | 0.048 | 0.036 |
| Mounds of soil | 0.003 | 0.002 | 0.002 | 0.002 |
| Total | 0.030 | 0.039 | 0.050 | 0.039 |
The levelling of the unevenness on the skid trail and the filling of tracks resulted in an increase in the proportion of changes in soil volume, which corresponded to the terrain shift from 0 to -10 cm (Fig. 12). Together, these changes represented almost 85% of the changes in the soil volume on the skid trail. No significant changes were detected in section A1, while in sections A2 and A3 the proportion of changes to the terrain by up to -10 cm increased significantly. The proportion of deeper tracks and gullies on the skid trail above -10 cm in terms of changes to soil volume only decreased to 9%. The significance of other changes to the terrain in terms of changes to soil volume was minimal.
Discussion
So far, terrestrial laser scanning has not been frequently used tools for terrain modelling, although it provides outstanding possibilities in the analysis of terrain changes from both natural and human-related processes. One of the main problems in modelling a terrain based on a point cloud obtained by terrestrial laser scanning is the separation of points reflected by the terrain from those reflected by other objects. In our work, we used a simple and effective filtration algorithm which removed all points located at a certain height above the ground. Such method could be used at the study site since no understorey was present. Pirotti et al. ([19]) proposed an advanced method for categorizing point clouds from terrestrial laser scanning, distinguishing points forming the terrain from those reflected by the vegetation. Very good results in separating the vegetation from the surface in a point cloud were also achieved by applying a multi-scale approach ([4]).
The assessment of changes in the terrain by comparing DTMs before and after the skidding operations revealed the largest differences to occur near the stumps of standing or fallen trees, making difficult to evaluate the extreme changes. The problem was caused by the incorrect modeling of stumps in the vicinity of the skid trail. Manual removal of stumps in the point clouds would improve the accuracy of the terrain models, although this would be time-consuming in larger and more complicated study sites. The development of automated methods aimed at removing stumps, trunks and other objects in the forest from the point cloud is highly preferable.
In this study, the observed differences in the DTMs before and after skidding could be also affected by the presence of branches lying on the forest floor and harvesting residues. The automatic recognition of such objects in the point cloud is much more difficult than recognizing trunks, since branches may be partially buried in the soil. During timber skidding and post-harvesting activities, stem remains and branches were removed from the study area, resulting in local differences between DTMs by as much as 7 cm, and partially affecting the accuracy of the results. In more complicated situations, sophisticated methods for the identification of complex objects may be necessary, taking into consideration other parameters obtained through TLS analysis, such as shape, size, distance from the terrain, color and texture.
We verified the shift of the DTMs obtained by comparing the elevations of samples from undisturbed control areas, and finding differences up to several centimeters. Therefore, a correction was applied to DTMs, in such a way to reduce the deviations in DTMs in the control areas close to zero. Being the skid trail area 279.41 m2, a correction of 4.8 mm represents a deviation of 1.3 m3, i.e., 12% of the overall change in soil volume.
Particular care should be taken in the validation and the height accuracy of the DTMs. Control areas should be preserved from accidental soil compaction using a clearly visible delimitation. The precise localization of selected points in the terrain using geodetic methods is a viable alternative.
Conclusions
Manual measurements of a skid trail’s profile are obviously simpler and less expensive than terrestrial laser scanning. Nonetheless, the latter method provides a much higher sampling density of the soil surface and allows a more accurate image of the terrain changes, in particular when the spatial distribution of soil disturbance is irregular. Moreover, manual measurement of terrain is a time-consuming process. Terrestrial laser scanning of our study site was made in approximately 3 hours. In our experience, this corresponds to the time required for manual measurements of 12 cross-sectional profiles of a skid trail at intervals of 10 cm.
Terrestrial laser scanning technology has shown to be a suitable tool for the detailed mapping of terrain changes in a forest environment. This method facilitates flexible and quick measurements of the terrain structure over large areas. Furthermore, high scanning density facilitates a detailed capture of the geometric shape of the terrain, and increases the probability of penetration of the laser beam through the understory vegetation and of reflection by the terrain as well.
DTMs derived from TLS data are suitable for monitoring small changes in the terrain of forest stands and evaluating the spatial distribution of changes with high accuracy. Based on such data, we were able to precisely quantify the effect of harvesting and transportation activities in various sections of a skid trail.
Acknowledgements
This study benefited from the contributions of the Center of Excellence for Decision Support Systems in Forest and Landscape, Technical University in Zvolen (Slovakia), ITMS 26220120069, co-funded by the European Regional Development Fund.
References
Online | Gscholar
CrossRef | Gscholar
Gscholar
Authors’ Info
Authors’ Affiliation
Department of Forest Management and Geodesy, Faculty of Forestry, Technical University in Zvolen, T. G. Masaryka 24, 960 53 Zvolen (Slovakia)
Jozef Suchomel
Department of Forest Harvesting, Logistics and Amelioration, Faculty of Forestry, Technical University in Zvolen, T. G. Masaryka 24, 960 53 Zvolen (Slovakia)
Forests of the Slovak Republic, Námestie SNP 8, 975 66 Banská Bystrica (Slovakia)
Corresponding author
Paper Info
Citation
Koren M, Slančík M, Suchomel J, Dubina J (2015). Use of terrestrial laser scanning to evaluate the spatial distribution of soil disturbance by skidding operations. iForest 8: 386-393. - doi: 10.3832/ifor1165-007
Academic Editor
Enrico Marchi
Paper history
Received: Oct 26, 2013
Accepted: Aug 15, 2014
First online: Oct 08, 2014
Publication Date: Jun 01, 2015
Publication Time: 1.80 months
Copyright Information
© SISEF - The Italian Society of Silviculture and Forest Ecology 2015
Open Access
This article is distributed under the terms of the Creative Commons Attribution-Non Commercial 4.0 International (https://creativecommons.org/licenses/by-nc/4.0/), which permits unrestricted use, distribution, and reproduction in any medium, provided you give appropriate credit to the original author(s) and the source, provide a link to the Creative Commons license, and indicate if changes were made.
Web Metrics
Breakdown by View Type
Article Usage
Total Article Views: 54455
(from publication date up to now)
Breakdown by View Type
HTML Page Views: 44742
Abstract Page Views: 3837
PDF Downloads: 4442
Citation/Reference Downloads: 29
XML Downloads: 1405
Web Metrics
Days since publication: 4139
Overall contacts: 54455
Avg. contacts per week: 92.10
Article Citations
Article citations are based on data periodically collected from the Clarivate Web of Science web site
(last update: Mar 2025)
Total number of cites (since 2015): 22
Average cites per year: 2.00
Publication Metrics
by Dimensions ©
Articles citing this article
List of the papers citing this article based on CrossRef Cited-by.
Related Contents
iForest Similar Articles
Research Articles
Efficient measurements of basal area in short rotation forests based on terrestrial laser scanning under special consideration of shadowing
vol. 7, pp. 227-232 (online: 10 March 2014)
Technical Advances
Forest stand height determination from low point density airborne laser scanning data in Roznava Forest enterprise zone (Slovakia)
vol. 6, pp. 48-54 (online: 21 January 2013)
Research Articles
Three-dimensional forest stand height map production utilizing airborne laser scanning dense point clouds and precise quality evaluation
vol. 10, pp. 491-497 (online: 12 April 2017)
Research Articles
Influence of slope on physical soil disturbance due to farm tractor forwarding in a Hyrcanian forest of northern Iran
vol. 7, pp. 342-348 (online: 17 April 2014)
Research Articles
Comparison of wood stack volume determination between manual, photo-optical, iPad-LiDAR and handheld-LiDAR based measurement methods
vol. 16, pp. 243-252 (online: 23 August 2023)
Research Articles
Deploying an early-stage Cyber-Physical System for the implementation of Forestry 4.0 in a New Zealand timber harvesting context
vol. 17, pp. 353-359 (online: 13 November 2024)
Research Articles
Improving dimensional stability of Populus cathayana wood by suberin monomers with heat treatment
vol. 14, pp. 313-319 (online: 01 July 2021)
Research Articles
Estimating machine impact on strip roads via close-range photogrammetry and soil parameters: a case study in central Italy
vol. 11, pp. 148-154 (online: 07 February 2018)
Research Articles
The natural recovery of disturbed soil, plant cover and trees after clear-cutting in the boreal forests, Russia
vol. 13, pp. 531-540 (online: 18 November 2020)
Research Articles
Relationship between tree growth and physical dimensions of Fagus sylvatica crowns assessed from terrestrial laser scanning
vol. 8, pp. 735-742 (online: 11 June 2015)
iForest Database Search
Search By Author
Search By Keyword
Google Scholar Search
Citing Articles
Search By Author
Search By Keywords
PubMed Search
Search By Author
Search By Keyword

