Genetic control of intra-annual height growth in 6-year-old Norway spruce progenies in Latvia
iForest - Biogeosciences and Forestry, Volume 12, Issue 2, Pages 214-219 (2019)
doi: https://doi.org/10.3832/ifor2777-012
Published: Apr 25, 2019 - Copyright © 2019 SISEF
Research Articles
Abstract
Coupling growth with periods of favourable weather conditions minimizes risks of frost damage and maximizes annual height increment. The phenology of the formation of height increment is therefore a trait related to the adaptability of trees to annual weather fluctuations. Strong genetic control of the timing of the onset and cessation of shoot elongation has been reported for Norway spruce, but little is known about its fluctuations that occur during the growth period. The strength of the genetic control of the height growth rate was assessed for young (6 years old) Norway spruce progenies originating from six open-pollinated stands from two local provenance regions. In 2010, the length of the growing period for the studied trees was ca. 60 days. Trees from the more continental provenance region, which had later onset and cessation of height growth (by ca. 2.5 days), exhibited slightly lower increments (by ca. 1%). Accordingly, the provenance region had a significant effect on height growth at the beginning and end of the growing period. Nevertheless, considerable genetic control of the growth rate was found throughout the entire growing period (particularly at the beginning and cessation, ha2 ≥ 0.20), except for a week-long interval around mid-summer (ha2 = 0.07). Similarly, the coefficient of additive genetic variation suggested that breeding could be applied for the improvement of height growth intensity throughout the season. The phenotypic correlations between weekly growth rates and tree height (before growth) were mostly non-significant, suggesting varying mechanisms of control, hence possibility for simultaneous improvement of the traits by breeding.
Keywords
Height Growth Rate, Growing Period, Heritability, Picea abies, Local Populations
Introduction
The effect of climatic changes on forests varies regionally and locally ([47], [31]), raising challenges for management systems worldwide ([33]). In Northern Europe, warming is expected to enhance forest productivity via an extension of vegetation period and intensification of photosynthesis ([32], [27]), yet the increasing effects of water deficit and late/early frosts might notably counteract such improvements ([19], [31], [48]). To mitigate the negative effects of a changing climate, an application of the improved forest regeneration material has been advised ([30], [5]), emphasizing the importance of tree breeding for future forestry ([35]). Currently, tree breeders have focused mainly on traits related to growth capacity and stem quality ([16], [20], [28]), yet the traits related to adaptability appear particularly topical under shifting conditions ([21], [35]). Ekberg et al. ([16]) showed that traits important for adaptation have higher within-population variability than growth capacity does; nevertheless, to include such traits in selection programmes, detailed information about their genetic control is necessary.
Tree height is among the main traits related to the growth capacity and productivity of stands; hence, it has been used for the selection of best genotypes ([16], [20], [11], [28]). The height increment of Norway spruce (Picea abies Karst.) is determined by the number of growth initials formed in the preceding year and their elongation ([6]). In addition, “free”, i.e., undetermined lammas growth ([6], [23]), which increases the productivity of stands ([36]), can occur. The height growth of Norway spruce is seasonal, and most of the annual increment is formed rapidly during the first part of summer ([38], [7]), although additional growth can occur afterwards, if conditions are favourable ([36]).
The susceptibility of newly formed tissues (shoots) to environmental risks varies throughout the season, thus the coupling of periods of cell division and tissue maturation with favourable conditions is crucial for growth ([13], [29], [34]). Accordingly, timing and intensity of growth, which vary geographically, seasonally, and depending on genetic and environmental factors ([46]), can be considered as adaptive traits related to height growth and productivity ([23]). Such adaptive traits have been shown to have an even greater effect on the productivity of Norway spruce over a longer term than the traits related to growth capacity ([23], [11], [7]). In addition, traits related to the timing of growth are age-independent, hence are crucial for long-term predictions of tree responses ([23]).
The physiological activity and growth of Norway spruce are controlled primarily by photoperiod ([1], [40]), while temperature causes certain shifts in the date of budburst and thus the initiation of the height increment ([22]) and intensity of shoot elongation ([43], [10]). In a warming climate, which also implies increasing variability in terms of weather extremes in springs ([2]), height growth can start earlier ([10]), exposing newly formed shoots to damage from late frosts ([41]), particularly in the case of unsheltered trees, e.g., after clear cuts ([29]). The termination of height growth coincides with the initiation of cold hardening in response to the decreasing photoperiod ([14], [15], [4]). Accordingly, Danusevičius & Gabrilavičius ([11]) and Kohmann & Johnsen ([26]) showed that Norway spruce populations/clones with later onset and cessation of growth suffered considerably less frost damage, were more productive, and had better stem form. Such differences have been related to the requirements in terms of heat and day-length for the initiation and cessation of growth, which vary among provenances ([43], [11]). Considering the importance of phenology for the survival and adaptation of species, strong genetic control (heritability) has been estimated for the timing of budburst and growth cessation ([21], [22], [23]), implying photoperiodic and thermal regulation. Nevertheless, the annual height increment is a result of continuous elongation and maturation processes; hence, detailed information about the genetic control of intra-annual shoot elongation can be helpful for a deeper assessment of the susceptibility of growth to environmental conditions ([45]). Ekberg et al. ([16]) reported a slight increase in the genetic variance component of the height increment with the advance of the growing period for Norway spruce in populations in Sweden. Still, insufficient information is available on the genetic control of height growth during various stages of shoot elongation for other populations ([28]).
The aim of this study was to assess the intra-annual height growth pattern and the strength of genetic control (heritability) of the height growth rate (GR) of Norway spruce individuals originating from the western and eastern provenance regions of Latvia. We hypothesized that genetic control fluctuated during the height growth period, being the highest at the initiation and cessation of growth. We also hypothesized that intra-annual GRs were not correlated with tree height, but rather controlled independently.
Material and methods
Field trial and measurements
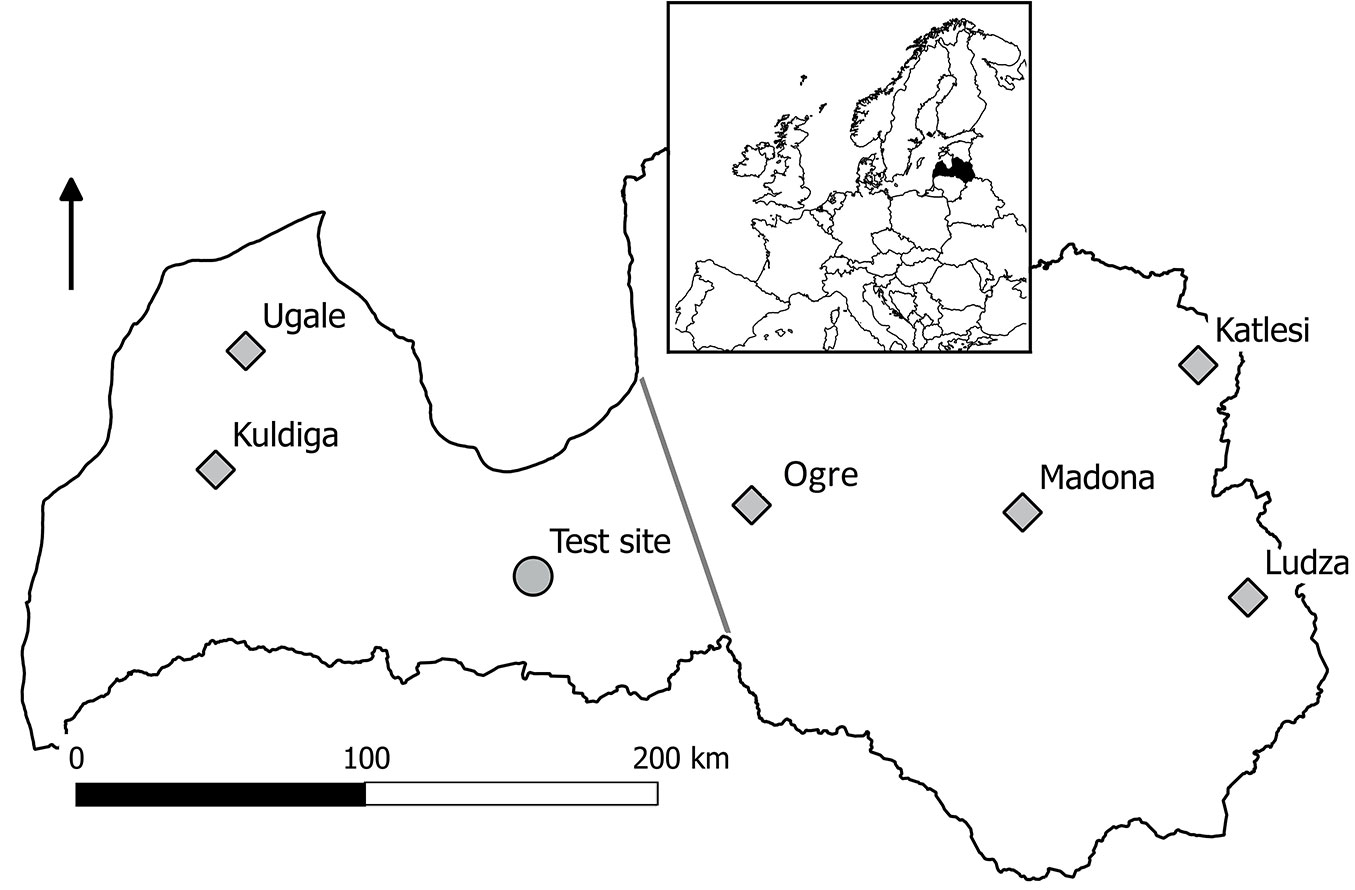
A field trial of progenies of Norway spruce plus-trees from six open-pollinated stands (Fig. 1) representing two local provenance regions (western and eastern - [18]) from the western part of the species range was studied. The naturally regenerated seedlots (stands where seeds were collected) were growing in lowland conditions (50-150 m above sea level) on dry, mesotrophic mineral (silty or sandy) soils. The studied trial was established in 2006; two-year-old, bare-rooted seedlings were planted in forest land in dry, mesotrophic mineral soil (Hylocomiosa stand type). Ten open-pollinated half-sib families per seedlot (20 and 40 families representing the western and eastern provenance regions, respectively - Fig. 1) were tested. Each family was represented by five (for a few families, four) randomized replications of plots containing 4 × 3 trees (3190 trees planted in total; 48-60 trees per family). The spacing of trees was 3 × 2 m.
Fig. 1 - The provenances of the tested Norway spruce (squares) and location of the trial (circle). Grey line demarcate two provenance regions of Norway spruce in Latvia.
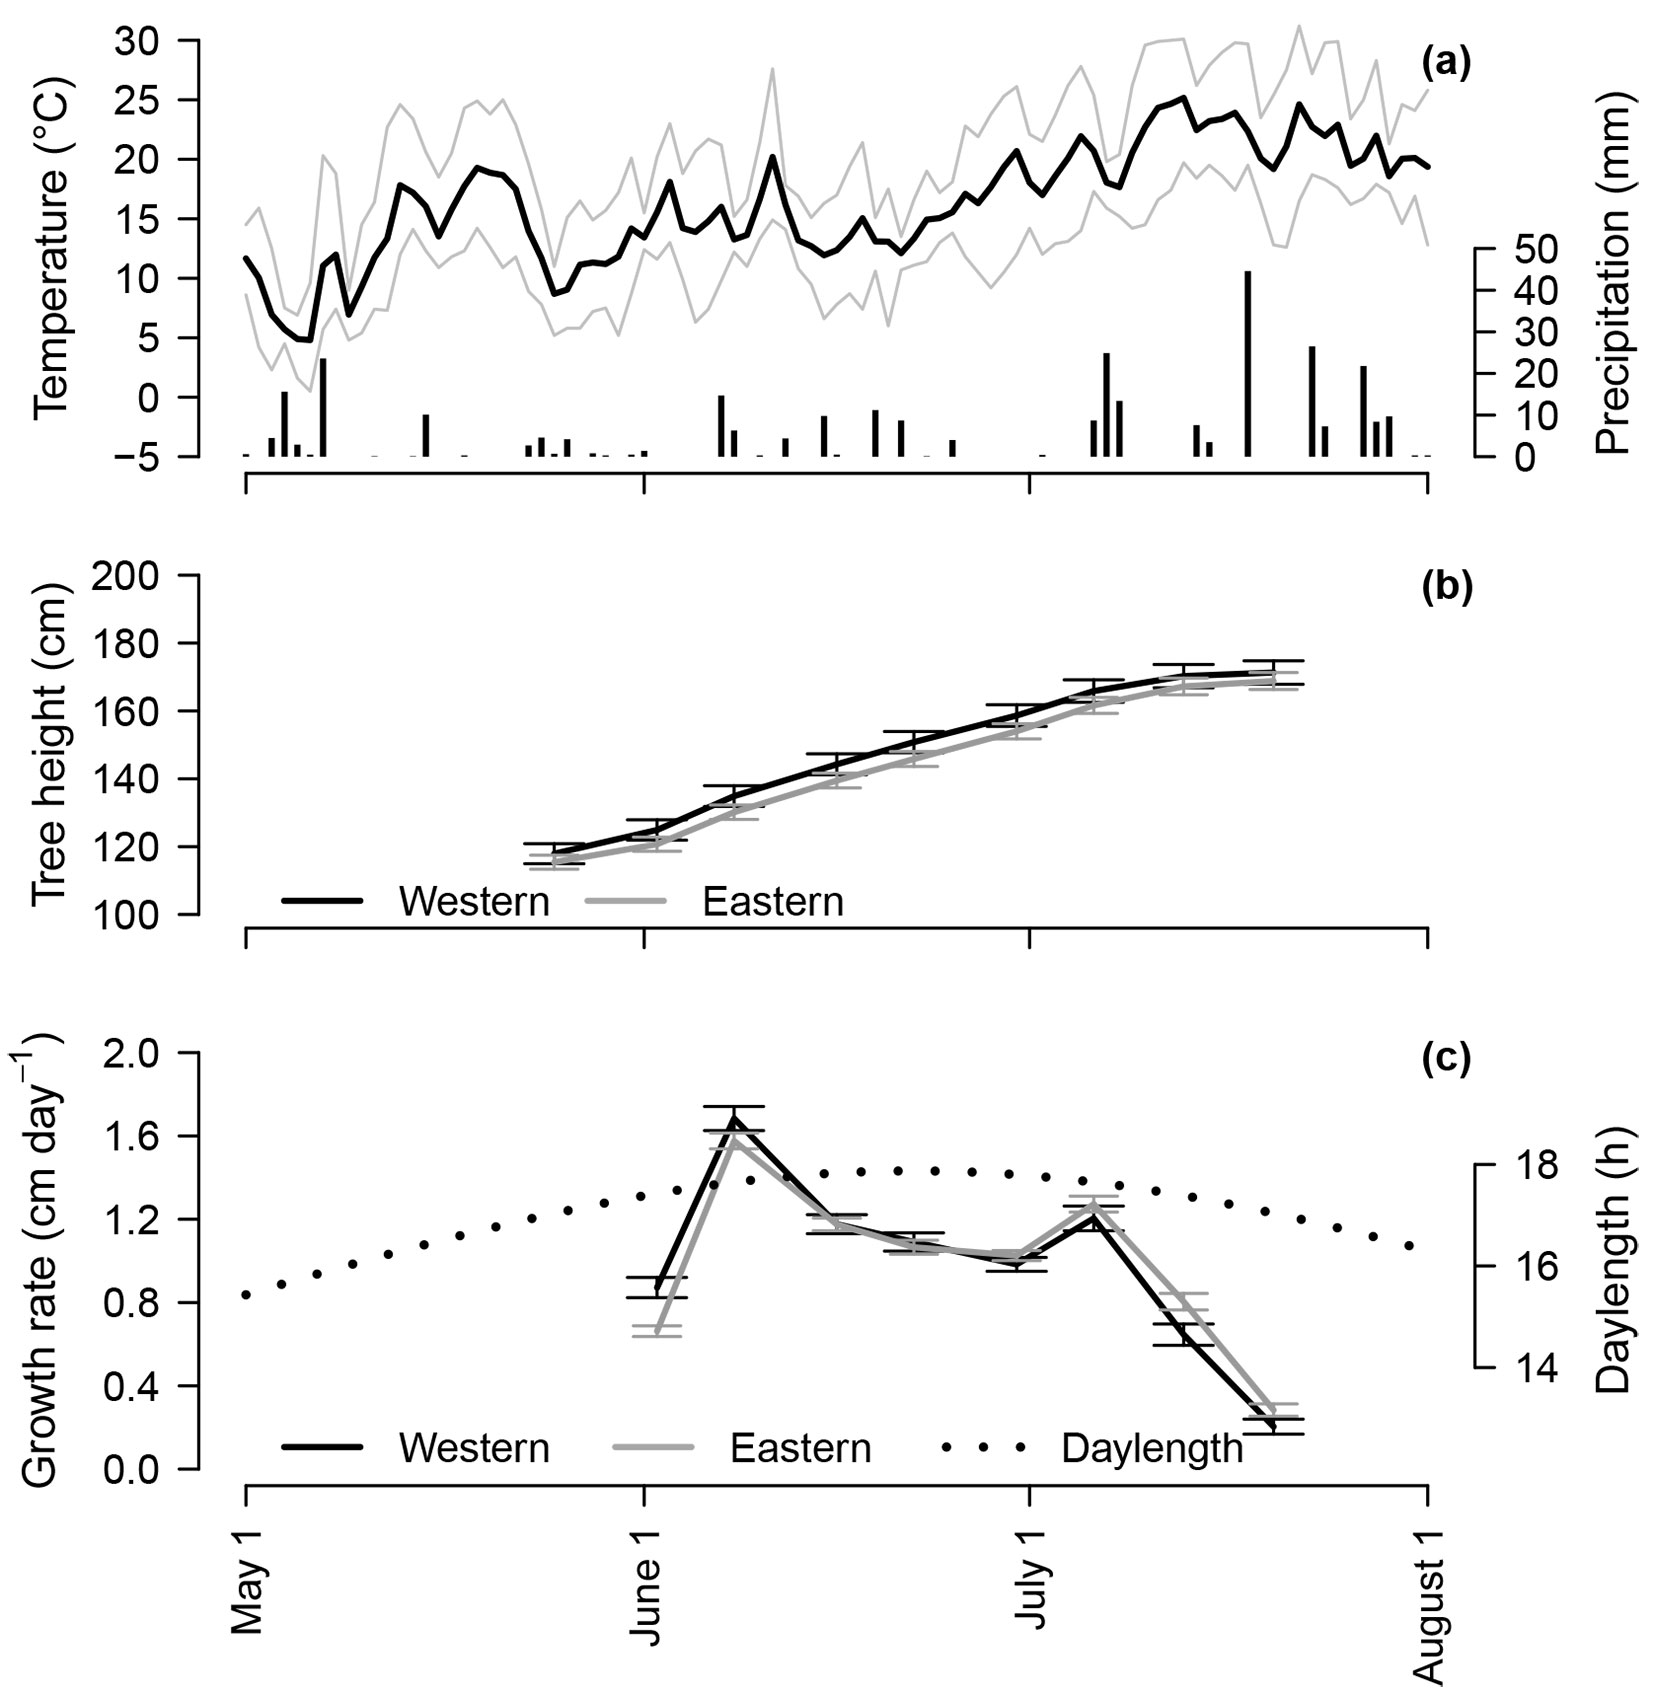
The climate in the central part of Latvia is moist continental ([31]). During 2005-2015, the mean (± standard deviation) annual temperature was 7.8 ± 0.6 °C; the mean monthly temperature ranged from -3.5 ± 3.3 to 18.9 ± 1.6 °C in January and July, respectively ([24]). The vegetation period, when mean diurnal temperatures exceeded 5 °C, extended from mid-April to mid-October. The mean annual precipitation was 656 ± 91 mm, yet the highest monthly precipitation occurred during the summers (June-September period, ca. 75 ± 30 mm per month). The climate in the central part of Latvia is warmer (annual temperature was ca. 1.5 °C higher, and the vegetation period is longer by ca. 10 days) and drier (annual precipitation was ca. 150 mm lower) than both the western and eastern parts of the country ([24]). In 2010, the daily minimum temperature was constantly above 0 °C from May through September, although the beginning of May was warmer than the long-term mean for that period (Fig. 2a). The highest amount of precipitation occurred in July and August. The precipitation-free periods were up to a week long. During the growing period of 2010 (May 15-Jul 31), the mean diurnal temperature and precipitation were 17.3 ± 4.8 °C and 265 mm, respectively, which were similar to the long-term means. During the July-September period in 2009, when the primordia of the studied increment were formed, the diurnal temperature ranged 14.0-29.7 °C, with the mean value of 16.2 ± 2.6 °C; the mean 10-day precipitation sum was 17.5 ± 15.4 mm.
Fig. 2 - Mean (black bold line), minimum and maximum (fine grey lines) daily temperature and precipitation (bars) at the trial site (a), mean height (b), and height growth rate of studied Norway spruce originating from the western and eastern regions of Latvia, and daylength (c) during the seventh growing period in 2010. In (b) and (c), whiskers indicate 95% confidence intervals. In (c), the dates correspond to the last day of intervals, for which growth rates were calculated.
Within the trial, 1273 trees (430 and 843 trees representing the western and eastern provenance regions, respectively) were selected for measurements. Forked and/or damaged trees were excluded. In 2010, at the age of six years, the lengths of the main shoots of the selected trees were measured every 6-8 days during the period from May 25 to July 20 (nine surveys) with a precision of 1 mm. The measurements for all trees were done during the same day to reduce errors associated with growth. In addition, tree height after the cessation of height growth (September 10) was measured.
Data analysis
For each tree, weekly GRs (mm day-1) were calculated. The effect of provenance region on the timing of growth initiation (as a binomial variable), weekly GRs, total height increment, and tree height at the beginning and end of the observation period was assessed using linear mixed models ([49]) of the following form (eqn. 1):
where Yijk was the response variable; μ was the overall mean; Pi was the fixed effect of provenance region i; (Fj(i)) was the random effect of family j, nested within provenance region i; (Rk) was the random effect of replication k; Zijk1 was the value of the response parameter in the preceding period (numeric covariate, where applicable); and Eijk was the residual error term. The differences in growth onset and cessation were assessed with a generalized model using a binomial distribution of the residuals and a “logit” link function. The analysis of variance of the models was used to determine the strength of the effect of provenance throughout the growing period.
For the assessment of the strength of the genetic control of intra-annual growth patterns (genetic parameters), which is based on the family and family × environment variance components, the models were transformed to (eqn. 2):
where Pi was the fixed effect of provenance region i; Rk was the fixed effect of replication k; (Fj) was the random effect of family j; (Fj(i) · Rk) was the random effect of the family × replication interaction; Zijk1 was the value of the response parameter from the preceding period (numeric covariate, where applicable); and Eijk was the residual error term.
The narrow sense (additive) individual-tree heritability coefficient (ha2) for weekly GR, shoot length, and tree height was calculated based on family variance according to Falconer & MacKay ([17] - eqn. 3)
where σf2, σfb2 and σe2 were the estimated variance components of family, family × replication interaction, and residual, respectively. The mean heritability at the family level (hf2), which describes the representability of heritability of traits by the experimental design, was calculated as (eqn. 4):
where r was the number of replications, and n was the harmonic mean of the number of observations per plot. The standard errors for ha2 and hf2 were estimated using approximation by Dickerson ([12]). The coefficient of additive genetic variation (CVa), which indicates the amount of variance in a trait that could be altered by breeding ([17]), was calculated as follows (eqn. 5):
Phenotypic Pearson’s correlation analysis based on individual observations as well as on family means was used to quantify the linkage among the studied traits. Trees were used as observations, and replication was considered to be the statistical unit. The analyses were conducted in SAS using PROC MIXED, PROC LIMMIX, and PROC CORR ([44]).
Results
During the seventh growing period, the mean tree height increased from 114.5 ± 1.7 to 169.6 ± 2.0 cm (Fig. 2b). Trees from the western provenance region were slightly taller (ca. 1%) compared with trees from the eastern region; yet, considering the experimental design (random effects, among which family and block had the highest variance), these differences were not significant (p-value > 0.50). The same was observed for total shoot length at the end of the seventh growing period.
The onset of height growth was significantly (p-value < 0.01) earlier for trees from the western provenance as compared to the eastern provenance region, because 68.7 and 51.7% of trees had initiated shoot elongation prior to the first measurement on May 25, respectively. A significant difference (p-value < 0.05) was also observed for growth cessation, because 36.6% and 28.2% of trees from the western and eastern provenance regions had completed height increment (showed zero GR) prior to the final measurement on July 20, respectively. Accordingly, the height growth period was estimated to be ca. 60 days long (mean GR = 0.92 ± 0.02 cm day-1), and it occurred when the day-length was ≥ 16.5 h (Fig. 2c).
In 2010, shoot growth was faster during the first part of the season (Fig. 2c), and 50% of the height increment were completed around the 17th of June (ca. 25 days since growth onset). Initiation and cessation of the height growth of trees from the western provenance region appeared ca. 2 days earlier. Accordingly, they showed significantly higher GR at the beginning and significantly lower GR at the cessation of the growing period. Although GR showed a decreasing tendency after June 8, a sudden improvement in growth, irrespective of provenance region, was observed during the first week of July, which coincided with a warmer and dryer period (Fig. 2a).
The effect of provenance region on GR varied during the season (Tab. 1). The strongest provenance effect was observed at the beginning and at the cessation of the growing period (before June 3 and after July 6; p-values < 0.05), while it was weak around mid-summer (p-value > 0.21). A similar seasonal pattern was observed for the additive heritability, as the highest ha2 coefficients (>0.30) were observed at the beginning and end of the season. Nevertheless, during the mid-part of the growing period, ha2 remained mostly intermediate ([17]). The hf2 was generally higher (mean hf2 = 0.60) and less variable throughout the season. The pattern of CVa was similar to the effect of provenance region, ranging from 0.06 to 0.48 in the middle and at the end of the growing period, respectively. The heritability for tree height and shoot length was high (ha2 ≥ 0.31 and hf2 ≥ 0.65), yet the genetic variation in these traits was low (CVa ≤ 0.11).
Tab. 1 - The effect of provenance region on height growth rate during the growing period, tree height prior and after the height measurements in 2010, and genetic parameters: additive heritability coefficient (ha2), family mean heritability coefficient (hf2), and coefficient of additive genetic variation (CVa) for these traits. (SE): standard error.
| Param | Period | Effect of provenance region |
Genetic parameters | |||
|---|---|---|---|---|---|---|
| F-value | p-value | ha2 ± SE | h f 2 | CV a | ||
| Height growth rate |
May 25-June 2 | 8.11 | <0.01 | 0.73 ± 0.16 | 0.81 | 0.31 |
| June 2-June 8 | 2.66 | 0.11 | 0.48 ± 0.12 | 0.66 | 0.11 | |
| June 8-June 16 | 0.01 | 0.93 | 0.07 ± 0.04 | 0.21 | 0.06 | |
| June 16-June 22 | 0.22 | 0.66 | 0.24 ± 0.08 | 0.61 | 0.15 | |
| June 22-June 30 | 1.35 | 0.26 | 0.28 ± 0.09 | 0.63 | 0.14 | |
| June 30-July 6 | 1.55 | 0.21 | 0.31 ± 0.04 | 0.58 | 0.13 | |
| July 6-July 13 | 4.42 | 0.03 | 0.61 ± 0.18 | 0.77 | 0.26 | |
| July 13-July 20 | 3.97 | 0.04 | 0.20 ± 0.07 | 0.50 | 0.48 | |
| Tree height |
In 2009 (before observation) |
0.35 | 0.56 | 0.31 ± 0.11 | 0.65 | 0.11 |
| In 2010 (after observation) |
0.46 | 0.50 | 0.39 ± 0.12 | 0.71 | 0.08 | |
| Increment (shoot length) |
0.27 | 0.65 | 0.30 ± 0.10 | 0.60 | 0.08 | |
Significant phenotypic correlations were observed among the studied traits. The height increment of 2010 was strongly correlated with the terminal tree height (r = 0.56, p-value < 0.001), yet the correlation with the initial height of trees was considerably weaker, although significant (r = 0.10, p-value < 0.01). Similarly, the GRs throughout the season were positively correlated with the terminal tree height (mean r = 0.35), yet the correlations with the tree height prior to the growing period were mostly non-significant (mean r = 0.07 - Tab. 2). The correlations among the weekly GRs ranged from -0.14 to 0.67 and had an explicit tendency to decrease with an increasing interval between the measurements due to the autocorrelation of growth. Nevertheless, the similarity of GRs in consecutive periods was higher during the second part of the growing period from June 22 to July 13. The family mean correlations (not shown) showed a highly similar pattern, although family mean GRs in the May 5-June 2 period and those later periods were negatively correlated.
Tab. 2 - Phenotypic Pearson’s correlation coefficients (the upper diagonal part) and their p-values (the lower diagonal part) among the height growth rate (GR) and tree height before and after growing period of 2010.
| Parameter, Period | GR, May 25-June 2 | GR, June 2-June 8 | GR, June 8-June 16 | GR, June 16-June 22 | GR, June22-June 30 | GR, June 30-July 6 | GR, July6-July 13 | GR, July13-July 20 | Height, before | Height, after |
|---|---|---|---|---|---|---|---|---|---|---|
| GR, May 25-June 2 | - | 0.47 | 0.18 | 0.21 | 0.07 | 0.02 | -0.12 | -0.14 | 0.02 | 0.22 |
| GR, June 2-June 8 | <0.001 | - | 0.19 | 0.47 | 0.39 | 0.35 | 0.25 | 0.04 | 0.07 | 0.38 |
| GR, June 8-June 16 | <0.001 | <0.001 | - | 0.21 | 0.54 | 0.47 | 0.39 | 0.15 | 0.03 | 0.31 |
| GR, June 16-June 22 | <0.001 | <0.001 | <0.001 | - | 0.51 | 0.48 | 0.41 | 0.16 | 0.04 | 0.34 |
| GR, June 22-June 30 | 0.01 | <0.001 | <0.001 | <0.001 | - | 0.67 | 0.63 | 0.29 | 0.04 | 0.41 |
| GR, June 30-July 6 | 0.43 | <0.001 | <0.001 | <0.001 | <0.001 | - | 0.62 | 0.29 | 0.16 | 0.48 |
| GR, July 6-July 13 | <0.001 | <0.001 | <0.001 | <0.001 | <0.001 | <0.001 | - | 0.42 | 0.16 | 0.45 |
| GR, July 13-July 20 | <0.001 | 0.14 | <0.001 | <0.001 | <0.001 | <0.001 | <0.001 | - | 0.06 | 0.24 |
| Height, before | 0.58 | 0.01 | 0.34 | 0.17 | 0.13 | <0.001 | <0.001 | 0.05 | - | 0.88 |
| Height, after | <0.001 | <0.001 | <0.001 | <0.001 | <0.001 | <0.001 | <0.001 | <0.001 | <0.001 | - |
Discussion
The height increment of Norway spruce (Fig. 2) was similar to that in other stands within the region ([42], [36]). Although Gailis ([18]) observed a faster height growth for Norway spruce from eastern Latvia, the lack of such a difference in the studied trial might be related to similar transfer distances (Fig. 1) or to the effects of a drier climate at the trial site. In addition, Norway spruce from both provenance regions had growing periods of similar length (ca. 60 days), explaining the comparable height increments.
The height growth patterns of Norway spruce from both provenance regions were similar. The highest GR was observed at the beginning of the growing period, followed by a gradual decrease (Fig. 2c) that can be related to the concentration of growth hormones after the onset of growth ([39]). The additional lammas growth, which occurred during the June 30-July 6 period, irrespectively of provenance region, was likely triggered by the increased temperature and solar radiation following the period of cooler and more humid weather (low precipitation - [37], [6], [36]).
Although the pattern of height growth of the studied Norway spruce was similar (Fig. 2), the phenology differed by provenance region (Tab. 1), indicating possible local adaptations to climate, as the photoperiod was the same. The specifics of the temperature-related control mechanisms have been identified as the main cause of longitudinal differences in growth phenology of Norway spruce ([25], [21]), even on a small geographic scale (< 300 km - [9]). The Norway spruce from the eastern part of Latvia, where the climate was harsher, had significantly later onset and cessation of height growth (Tab. 1), indicating better adaptation to the late frosts ([13], [41], [29]). Accordingly, the provenance region had a stronger effect on the timing of growth onset than cessation, in contrast to the findings of Ekberg et al. ([16]) in central Sweden. Apparently, in the milder climate of the Baltic States (compared with central Sweden), where summers are warmer, the late frosts mainly have had an effect on Norway spruce growth (particularly in the eastern part of Latvia - [42]), thus determining a stronger genetic control of growth onset (Tab. 1). The increasing effect of late frosts on plant growth has been attributed to the warming of climate ([19]). Nevertheless, the genetic control of GR, as illustrated by the differences between the provenance regions (Tab. 1), was significant only during rather short periods after the onset and before the cessation of growth, likely following the probability of frosts ([2]). During the period of fastest height growth in June 8-22, GR was controlled mainly by external factors, as noted previously by Danusevičius et al. ([10]), while the differences between the provenance regions were negligible (Tab. 1).
The studied traits showed high heritability, as the ha2 mostly exceeded 0.20 (Tab. 1), implying that they might be improved by breeding ([17]). The reliability of the genetic parameters calculated based on the studied trait was good, as the hf2 (Tab. 1) prevailingly exceeded 0.50 ([17]). Considering the additive genetic variation of the studied traits (CVa - Tab. 1), the highest effect of breeding might be expected for the GR at the beginning and cessation of growth, as also shown by the differences among the provenance regions. Nevertheless, the heritability of GR during the middle of summer did not reach minimum values (except for the GR in the period June 8-16), suggesting that these traits might be influenced by selection at the family level. Tree height showed high ha2 values, yet the CVa was low, as observed in similar studies, indicating strong genetic control but limited variability ([23]). The GR throughout the season was independent of tree height (Tab. 2), allowing for selection for productivity and adaptability. The increment of trees is autoregressive ([8]), and such a pattern was observed for the intra-annual GR (Tab. 2). Nevertheless, stronger correlations between consecutive GRs during the middle compared with the cessation of the growing period might be explained by the utilization of current assimilates for growth ([3]).
Conclusions
The studied provenances of Norway spruce showed similar height increments, intra-annual height growth patterns, and length of growing period, yet they differed by growth phenology, indicating adaptation to slightly different climates. Considering that phenology is a trait that is highly important for adaptation, the intensity of growth (GR) throughout the season showed strong genetic control, particularly at the beginning and cessation of the growing period, when the probability of frost was the highest. The control mechanisms of growth phenology (and intensity of height growth during the season) and growth capacity (total annual height increment) appeared to be independent, suggesting that both traits might be simultaneously improved by tree breeding to increase the productivity and sustainability of Norway spruce under a changing climate.
Acknowledgements
The study was financed by European Regional Development Fund, support for post-doctoral studies in Latvia “Plasticity of development and xylogenesis of the native and introduced tree species under changing climate” (No.: 1.1.1.2.VIAA/1/16/108). Sampling and data collection was done under the framework of JSC “Latvijas valsts meži” project “Adaptation of forestry to climatic changes”. Endijs Baders and Andis Adamovičs helped during the data collection.
References
Gscholar
Gscholar
Gscholar
Gscholar
Gscholar
Gscholar
Gscholar
Gscholar
CrossRef | Gscholar
Gscholar
Gscholar
Gscholar
Gscholar
Gscholar
Gscholar
Gscholar
Authors’ Info
Authors’ Affiliation
Pauls Zeltinš
Baiba Džerina
Iveta Desaine
Aris Jansons
Latvian State Forest Research Institute “Silava”, Rigas str. 111, LV2169 Salaspils (Latvia)
Aleksandras Stulginskis University, Faculty of Forest Sciences and Ecology, Studentu 11, LT53361 Kaunas (Lithuania)
Corresponding author
Paper Info
Citation
Matisons R, Zeltinš P, Danusevičius D, Džerina B, Desaine I, Jansons A (2019). Genetic control of intra-annual height growth in 6-year-old Norway spruce progenies in Latvia. iForest 12: 214-219. - doi: 10.3832/ifor2777-012
Academic Editor
Andrea Piotti
Paper history
Received: Mar 06, 2018
Accepted: Feb 06, 2019
First online: Apr 25, 2019
Publication Date: Apr 30, 2019
Publication Time: 2.60 months
Copyright Information
© SISEF - The Italian Society of Silviculture and Forest Ecology 2019
Open Access
This article is distributed under the terms of the Creative Commons Attribution-Non Commercial 4.0 International (https://creativecommons.org/licenses/by-nc/4.0/), which permits unrestricted use, distribution, and reproduction in any medium, provided you give appropriate credit to the original author(s) and the source, provide a link to the Creative Commons license, and indicate if changes were made.

Web Metrics
Breakdown by View Type
Article Usage
Total Article Views: 46756
(from publication date up to now)
Breakdown by View Type
HTML Page Views: 38048
Abstract Page Views: 3511
PDF Downloads: 4210
Citation/Reference Downloads: 1
XML Downloads: 986
Web Metrics
Days since publication: 2631
Overall contacts: 46756
Avg. contacts per week: 124.40
Article Citations
Article citations are based on data periodically collected from the Clarivate Web of Science web site
(last update: Mar 2025)
Total number of cites (since 2019): 2
Average cites per year: 0.29
Publication Metrics
by Dimensions ©
Articles citing this article
List of the papers citing this article based on CrossRef Cited-by.
Related Contents
iForest Similar Articles
Research Articles
Age trends in genetic parameters for growth and quality traits in Abies alba
vol. 9, pp. 954-959 (online: 07 July 2016)
Research Articles
Comparison of genetic parameters between optimal and marginal populations of oriental sweet gum on adaptive traits
vol. 11, pp. 510-516 (online: 18 July 2018)
Research Articles
Genetic variation and heritability estimates of Ulmus minor and Ulmus pumila hybrids for budburst, growth and tolerance to Ophiostoma novo-ulmi
vol. 8, pp. 422-430 (online: 15 December 2014)
Research Articles
Genetic diversity of core vs. peripheral Norway spruce native populations at a local scale in Slovenia
vol. 11, pp. 104-110 (online: 31 January 2018)
Research Articles
Patterns of genetic variation in bud flushing of Abies alba populations
vol. 11, pp. 284-290 (online: 13 April 2018)
Research Articles
Seedling emergence capacity and morphological traits are under strong genetic control in the resin tree Pinus oocarpa
vol. 17, pp. 245-251 (online: 16 August 2024)
Research Articles
Genetic variation of Fraxinus excelsior half-sib families in response to ash dieback disease following simulated spring frost and summer drought treatments
vol. 9, pp. 12-22 (online: 08 September 2015)
Research Articles
Local adaptation at a small geographic scale observed in Juniperus excelsa populations in southern Turkey
vol. 14, pp. 531-539 (online: 24 November 2021)
Research Articles
A comparative study of growth and leaf trait variation in twenty Cornus wilsoniana W. families in southeastern China
vol. 10, pp. 759-765 (online: 02 September 2017)
Research Articles
Clonal structure and high genetic diversity at peripheral populations of Sorbus torminalis (L.) Crantz.
vol. 9, pp. 892-900 (online: 29 May 2016)
iForest Database Search
Search By Author
Search By Keyword
Google Scholar Search
Citing Articles
Search By Author
Search By Keywords
PubMed Search
Search By Author
Search By Keyword


