Genetic variation of Fraxinus excelsior half-sib families in response to ash dieback disease following simulated spring frost and summer drought treatments
iForest - Biogeosciences and Forestry, Volume 9, Issue 1, Pages 12-22 (2015)
doi: https://doi.org/10.3832/ifor1514-008
Published: Sep 08, 2015 - Copyright © 2015 SISEF
Research Articles
Abstract
Ten juvenile Fraxinus excelsior half-sib families from two Lithuanian populations have been tested in the controlled environment for their response to ash dieback disease caused by Hymenoscyphus fraxineus, detecting changes of genetic variation and heritability, as well as estimating genotype by environment (G×E) interaction and phenotypic plasticity following artificial spring frost and summer drought treatments. In 2014, a batch of 200 four-year-old ash seedlings was used for each treatment and control (no treatment). Health condition, bud flushing phenology and height were assessed for each seedling, and disease incidence and survival ratios were assessed for each family both before (at the beginning of the vegetation season) and after the treatments (at the end of the vegetation season). Disease incidence ratio increased from 0.77-0.80 up to 0.90-0.95. Tree mortality rates during one vegetation season were significantly lower in the frost treatment (21%) than in the drought treatment (25%) or control (31%). None of the tested F. excelsior families were completely resistant to ash dieback, although significant among-family differences in disease incidence and damage rates suggest an additive mode of gene action and thus a quantitative resistance to the disease. Neither disease incidence rates, nor tree health condition scores differed significantly among the applied treatments (including control) indicating in general a negligible effect of the simulated adverse conditions on health status of the ash seedlings. However, G×E interaction was found to be significant (at P > 0.05) for disease incidence, length of necrotic shoots and tree survival, implying that susceptibility of ash families to the dieback disease unequally depends on environmental conditions, and indicating a presence of genetic variation in plasticity and reaction norms of the tested families across environments (treatments). Substantially increased coefficients of additive genetic variation and heritability in health condition following both frost and drought treatments and compared to control showed that simulated stress conditions may noticeably contribute to expression of differences among the tested F. excelsior families in their resistance traits, thus enabling a better evaluation of performance of different families, an effective family selection for resistance, and achievement of a marked genetic gain.
Keywords
Common Ash, Dieback, Disease Resistance, Genetic Variation, Heritability, Hymenoscyphus pseudoalbidus (Chalara fraxinea), Phenotypic Plasticity
Introduction
Since 1992, a severe dieback of common ash (Fraxinus excelsior L.) has spread from Eastern Poland to many European countries ([18] and references therein). The disease is caused by the ascomycete fungus Hymenoscyphus fraxineus (T. Kowalski) Baral et al. (=Chalara fraxinea T. Kowalski, syn. Hymenoscyphus pseudoalbidus - [36]), which in Europe is an invasive species ([20], [18]). The disease causes wilting and necroses of ash leaves and petioles, necrotic lesions on stems, branches and shoots, stem cankers and wood discolouration, followed by a gradual crown dieback, and in most severe cases - death of an entire tree ([1], [26], [27], [24], [45]). In Lithuania, dieback of F. excelsior was first observed in 1995-1996 in the north-central part of the country ([22]) and since then large areas of ash stands underwent sanitary fellings ([28]). Currently, the disease is in its chronic phase, and the health condition of the remaining ash stands continues to deteriorate; yet, no effective control measures have been offered so far ([19], [34], [28]). Consequently, the density of ash trees in a stand is often reduced to few individuals per hectare, meaning that the effective population size (Ne) has also decreased, thus compromising the genetic diversity of F. excelsior in mature stands and in regenerating offspring ([34]).
Studies in natural stands, clonal seed orchards and progeny trials in a number of European countries provide evidence of existing substantial genetic variation at individual, clonal, family and population levels in the susceptibility of F. excelsior to H. fraxineus, and that there is a significant genetic heritability in disease resistance/tolerance ([33], [30], [34], [23], [25], [47], [35], [8]). The genetically inherited resistance may provide a basis for a natural adaptation. The success of breeding programs is also determined to a great extent by the presence of sufficient genetic variation in a breeding population, as well as by sufficient heritability of resistance traits that facilitate identification and selection of truly resistant genotypes. Progeny studies show that disease incidence and severity varies among test sites, which was in general explained by the influence of different infection loads and/or environment conditions ([33], [30], [34], [35], [23], [25], [47]). It remains unknown to what extent changes in environmental conditions (e.g., from normal to stressed) can influence the disease development and spread among trees, and how this contributes to changes in genetic parameters such as coefficient of genetic variation, heritability and genetic correlations among the tree traits.
Two strategies of plant adaptation can be distinguished: (i) adaptation via genetic variation, and (ii) adaptation via phenotypic plasticity ([43]). Following environmental changes, a population that has a considerable genetic variation adapts through survival and reproduction of the most resistant genotypes, while maladapted genotypes disappear due to natural selection. When rapid adaptation is required, or when genetic variation is lacking, plants respond to changes in the environment by modifying their phenotype ([43]). This specific response to a certain range of conditions for a single or a set of traits is called phenotypic plasticity ([3]). Studies of plastic response along an environmental gradient indicate that reaction norms vary significantly among genotypes ([16], [31]). There are continuous debates over whether phenotypic plasticity shields genotypes from selection or generates novel opportunities for selection to act ([13]). One hypothesis suggests that genetic variation and plasticity represent alternative strategies for coping with environment heterogeneity ([29], [21]). Other hypotheses however suggest that genetic variation and phenotypic plasticity are positively correlated ([15], [17]). The phenotypic plasticity can be considered to be a trait in itself that is under genetic control, and which can evolve independently of the trait ([3], [41], [42], [39], [40]). Phenotypic plasticity encompasses diverse adaptive and non-adaptive responses to the environment variation ([13]).
A phenotypic response can be adaptive when it enhances plant fitness in a changed environment ([50]), or non-adaptive when it results in deterioration of fitness/condition of an individual plant which reflects an inevitable metabolic or developmental response ([48], [49]). Good adaptation to heterogeneous environments can be achieved by phenotypic plasticity or by stability (canalization). In the first case, populations may be subjected to a selection resulting in specialized genotypes of high plasticity that perform better in an indigenous (optimal) environment than in an unaccustomed environment ([51]). The second case refers to a situation when selection favors genotypes capable of buffering their phenotypes in the changed environment. Thus, the phenotypic plasticity of such genotypes is low. It has been concluded that the adaptive plasticity that places populations close enough to a new phenotypic optimum for directional selection to act is the only plasticity that predictably enhances fitness and is most likely to facilitate adaptive evolution ([13]). On the other hand, the authors pointed up that in stressful environments, the non-adaptive plasticity can result in a response being further away from the optimum or increase the variance due to the expression of cryptic genetic variation. The role of the phenotypic plasticity in plant susceptibility (degree of damage) to diseases/genetic resistance in expression of cryptic genetic variation, natural selection and adaptation processes remains unclear and definitely deserves further studies. Plasticity and plasticity-related changes in genetic variation and heritability in the incidence of the ash dieback disease under spring frosts and summer drought have never been assessed. Searching for not only resistant ash genotypes, but also for heritable adaptability traits and environment conditions under which its largest genetic variation and highest heritability can be obtained may be one of the most promising strategies in breeding for resistance to restore damaged F. excelsior stands.
The main aim of the present study was to assess the susceptibility of ten juvenile F. excelsior half-sib families to ash dieback disease caused by H. fraxineus, and to detect changes in genetic variation and heritability of disease resistance traits as well as to estimate genotype by environment (G×E) interaction and phenogenetic plasticity of selected ash families following simulated spring frost and summer drought treatments.
Materials and methods
Material
Ten half-sib families of F. excelsior originating from two northern Lithuanian populations heavily damaged by H. fraxineus (and therefore having undergone strong natural selection) were selected for the present experiment: Biržai (families no. B080, B076, B069, B078, B072 - 56o 15′ 25″ N, 24o 34′ 30″ E) and Zeimelis (families no. Z049, Z053, Z054, Z060, Z061 - 56o 15′ 45’ N, 24o 02′ 32″ E). Seeds from the respective families were collected in autumn 2008, stratified and sown in spring 2010 in a forest nursery at Dubrava Experimental-Educational State Forest Enterprise (EESFE) located in Kaunas region, central Lithuania. The seedlings were grown outdoors at the same forest nursery for two years. In spring 2012, 60 two-year-old seedlings of generally good health condition (very few with external disease symptoms) were selected from each family (in total 600 seedlings), planted in 5-liter plastic pots containing peat substrate and grown for another two years (until May 2014) under standard greenhouse conditions. In the greenhouse, the pots were arranged with 0.2 × 0.2 m spacing, and regular watering and fertilization was applied.
Treatments
In early May 2014, ash juveniles to be used for spring frost, summer drought and control treatments were randomly selected among the 600 four-year-old potted trees, according to the available number of trees in groups of different health conditions (scored from 1 - tree with dry stem and branches - to 5 - externally healthy tree, modified from [34]) within each family. The following approach was used to randomly distribute trees among the treatments: prior to the treatments, in each family, the pots with ash seedlings were grouped into five batches representing different health condition classes, then plants from each of those five batches were randomly selected to form three batches (each consisting of four plants) to be used in different treatments. As a result, a batch of 200 trees (10 families, 20 trees per family) was formed for each treatment. The trials (treatments) were established in a randomized complete block design with 2 blocks, each consisting of ten trees per family.
On May 16, 2014, a batch of 200 trees assigned for the simulated spring frost treatment was placed in a PE2422UVLX climatic chamber (Angelantoni Test Technologies, Massa Martana, Italy). The temperature in the climatic chamber was first gradually (in one hour) reduced from +20 oC to -5 oC, then held at -5 oC for 30 minutes, and finally was gradually (in one hour) raised back to +20 oC. After this cycle, trees were taken out of the climatic chamber and further grown outdoors for one vegetation season in the forest nursery of Dubrava EESFE. Watering was applied when needed depending on weather conditions. During the applied spring frost treatment, leaves of the ash seedlings became black and wilted. New leaves flushed and shoots resprouted from adventitious latent buds on almost all terminal and lateral shoots in two weeks (by the end of May 2014).
Concurrently, batches of seedlings assigned to the control and summer drought treatments were moved from the greenhouse to the outdoor nursery and placed next to the spring frost-treated seedlings. Watering was applied equally to all seedlings when needed, depending on weather conditions. On June 20, 2014, a batch of 200 trees assigned for the summer drought treatment was transported to the greenhouse, and left there for two weeks without any watering until severe wilting of leaves occurred. During this treatment, the temperature in the greenhouse varied from +25 to +35 oC during day time, and relative air humidity varied between 40-60%. Thereafter, trees were transported back to the outdoor nursery and watered regularly (depending on weather conditions). Leaves regained turgor and shoots regained growth as soon as the watering was applied.
Assessment of tree biometric parameters and sanitary condition
Measurement of tree biometric parameters and scoring of the extent of damage by H. fraxineus were performed in May 2012 (during outplanting of the ash seedlings into plastic pots), and repeated in August 2013, on May 5, 2014 (before the treatments), and on September 3, 2014 (at the end of vegetation season, after the treatments). The assessed traits were: (1) disease incidence ratio (the ratio between the number of symptomatic trees and the total number of trees in a family); (2) health condition of an individual tree (scored between 1 - tree with dry stem and branches - and 5 - externally healthy tree -, [34]); (3) survival ratio (the ratio between the number of living and dead trees in a family); (4) seedling height; (5) total length of necroses on leader and lateral shoots in an individual plant; and (6) total length of necrotic lesions formed on leader and lateral shoots and stem of an individual plant. Bud flushing phenology was assessed in beginning of May 2014 when all phases were present and distribution of scores was closest to normal, using a categorical scale of five degrees (points) adopted from Douglas et al. ([6]): 5 - very early; 4 - early; 3 - of moderate earliness; 2 - late; and 1 - very late flushing.
Variance analysis
The variance analysis of the data was done using the MIXED procedure of the SAS software package (SAS® Analytics Pro 12.1 - [38]), which uses Mixed model equations (MME) and the restricted maximum likelihood (REML) method. The significance of fixed effects (of block and treatment) was tested with F-tests. The significance of the random effects was tested using Z-test (SAS® Analytics Pro 12.1 - [38]). The analysis was performed separately for spring frost and summer drought treatments, and in both cases included the same control batch of trees. The combined linear statistic model was used for joint analysis of data from treatments’ and control batches together (eqn. 1):
where yijklm is an observation of the mth tree from the lth family in the kth population in the jth block of the ith environment (treatment), µ is the overall mean, zi is the fixed effect of the ith environment, bj is the jth block effect, pk is the kth population effect, fl is the effect of lth family, fl · zi is the interaction effect of lth family and ith environment (treatment), εijklm is the random residual. The population effect later was omitted from the model as in most cases it was non-significant. The model assumed that random effects were normally distributed with expectation zero and corresponding variances: σp2, σf2, σf·z2 and σe2. The normality of residuals’ distribution and homogeneity of variances were tested with SAS GLM and UNIVARIATE procedures (SAS® Analytics Pro 12.1 - [38]).
The variance components of random effects of families and family by environment (treatment) interaction (G×E) were computed from corresponding variances obtained in joint ANOVA (statistical model 1; SAS® Analytics Pro 12.1 - [38]), and expressed in percentage of the total random variation (eqn. 2, eqn. 3):
where vcf2 and vcf·z2 are the family and family by environment interaction variance components, σf2 is the family variance, σf·z2 is the variance of family by environment interaction, and σe2 is the variance of random residuals.
The simplified linear model was used for variance analysis of the data from each individual environment (treatment - eqn. 4):
where yjlm is an observation of the mth tree from the lth family in the jth block, µ is the overall mean, bj is the jth block effect, fl is the effect of lth family, and εjlm is the random residual. The model assumed that random effects are normally distributed with expectation zero and corresponding variances σf2 and σe2. Means of environments (treatments) and families were computed using the SAS MEANS procedure (SAS® Analytics Pro 12.1 - [38]).
Genetic parameters estimate
Genetic parameters: family variance components (vcf), coefficients of additive genetic variation (CVa), additive heritability coefficients (ha2) and their standard errors (se) of each trait were assessed using variances and covariances obtained in the analysis of variances of the SAS MIXED procedure. The variance components of families in each environment (treatment) were derived from corresponding variances and expressed in percentage of the total random variation (eqn. 5):
The coefficient of additive genetic variation of a trait was calculated for each individual environment (treatment) using the following formula ([10], [11] - eqn. 6):
where X is the phenotypic mean of the trait. Coefficient 3 was used as progenies in the present experiment were considered as an admixture of half-sibs and full-sibs. The narrow sense individual heritability coefficients were calculated using a formula (eqn. 7):
where ha2 is the individual additive heritability coefficient. B-type genetic correlations ([4]) between the same traits assessed on different trees from the same families in different environments (treatments) were estimated using the following formula (eqn. 8):
where rxy is the product-moment correlation between best linear unbiased predictor (BLUP) values derived from an individual environment (treatment) by variance analysis (SAS MIXED procedure), and rTPx and rTPy are the estimated relation between true and predicted family values for a trait at x and y environments (treatments), respectively; rTPx was calculated as follows (eqn. 9):
where h2 is the individual narrow sense heritability coefficient.
To evaluate the stability of individual families across environments (treatments) and the contribution of each of the family plasticity (in percent) to the family by environment (treatment) interaction (G×E) variances, the Wricke’s ecovalence values ([52]) were calculated using families’ least-squares means obtained within each environment (treatment), using the “Lsmeans” option of the SAS MIXED procedure. The Shukla stability variances were computed and the statistical significance (P) of the ecovalences was tested using the F-test developed by Shukla ([44]). In calculating ecovalences, to better fulfill the assumptions behind the linear model thus reducing the scale effects of different environments (treatments) in the joint ANOVA, data were transformed to equal genetic variance using the method of Danell ([5]). For each environment (treatment), the assessed values for each tree were multiplied by a scaling factor, which for the ith environment (treatment) was the mean genetic (family) standard deviations over all environments (treatments) and for the ith environment (treatment), respectively.
Deviations of families’ treatments least-squares means were calculated by subtracting families’ least-squares means obtained in the MIXED analysis at the individual treatments from total least-squares means of treatments. Phenotypic plasticity of each family was estimated as the difference between maximum and minimum least-squares means obtained for different treatments.
Families’ least-squares means from MIXED analysis at the individual environments (treatments) were regressed on environment (treatment) least-squares means to estimate the reaction norms of individual families over environments (treatments) according to Finlay & Wilkinson ([12]) using the REG procedure of the SAS software (SAS® Analytics Pro 12.1 - [38]). The following Finlay and Wilkinson parameters were obtained: intercept (a) and slope coefficients (b) of linear regression equation, regression residuals and coefficient of determination (R2).
Results and discussion
No families were completely resistant and free from disease (Fig. 1 and Fig. 2). This confirms the results of our previous study on resistance of 340 half-sib families from 24 European F. excelsior populations, where none of the tested families showed complete resistance to the ash dieback, and only a fraction exhibited reduced susceptibility ([34]). In clonal studies, differences among F. excelsior clones are usually pronounced: a small fraction of the clones exhibit good disease resistance (tolerance), while the majority experience high (and increasing) disease incidence rates becoming heavily damaged over time ([30], [23], [47], [34]).
Fig. 1 - Disease incidence (a-c), health condition (d-f) and tree survival (g-i) estimates for ten tested Fraxinus excelsior families (for explanation of the variables and family name codes see Materials and methods) before (May 5, 2014, light bars) and after (September 3, 2014, dark bars) spring frost, summer drought and control treatments. Bars are means ± standard error.
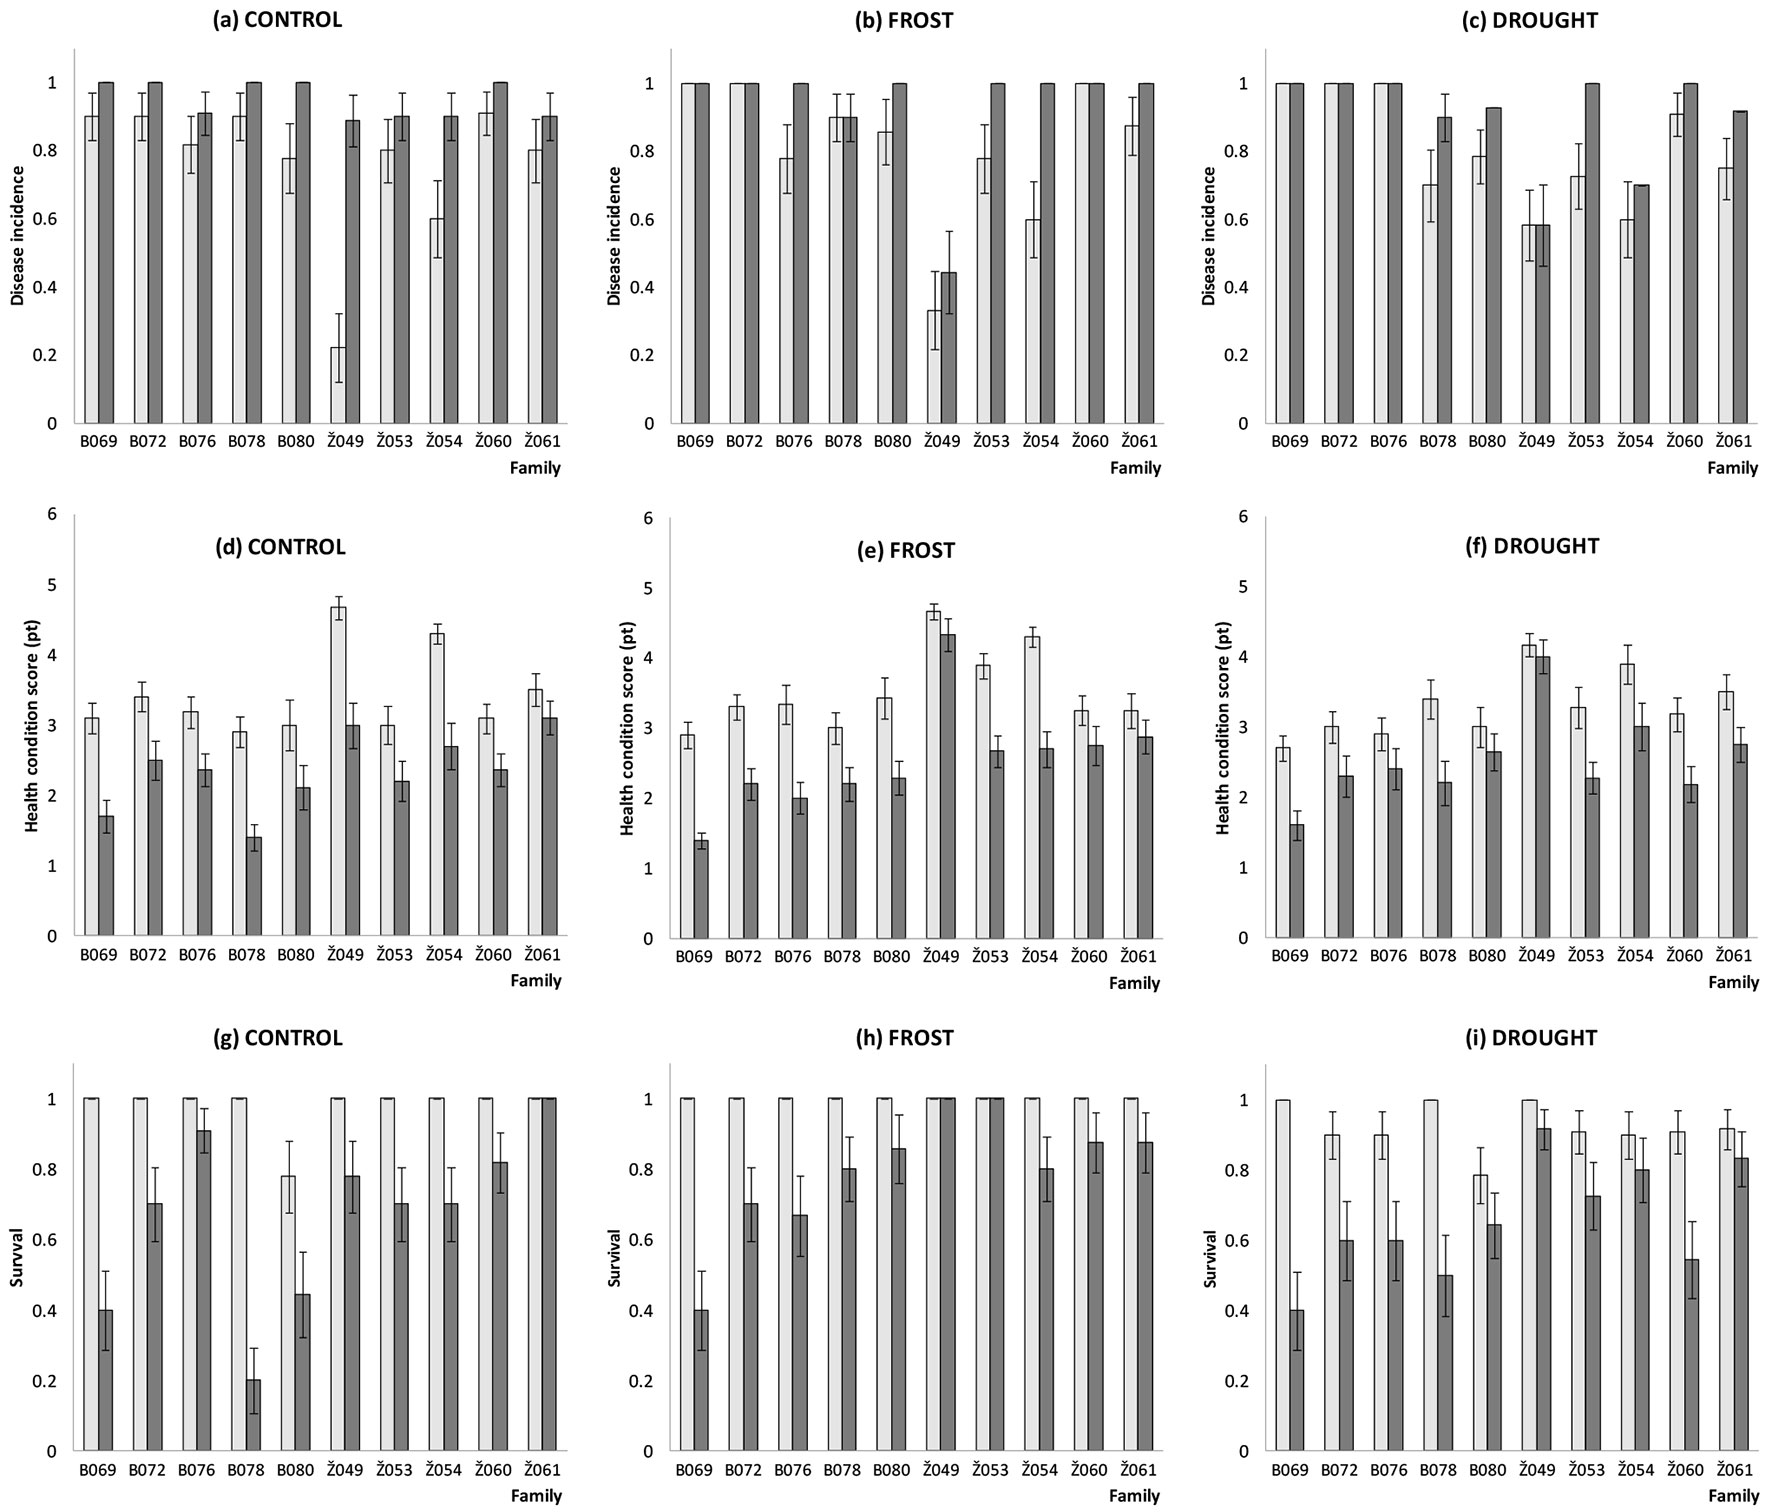
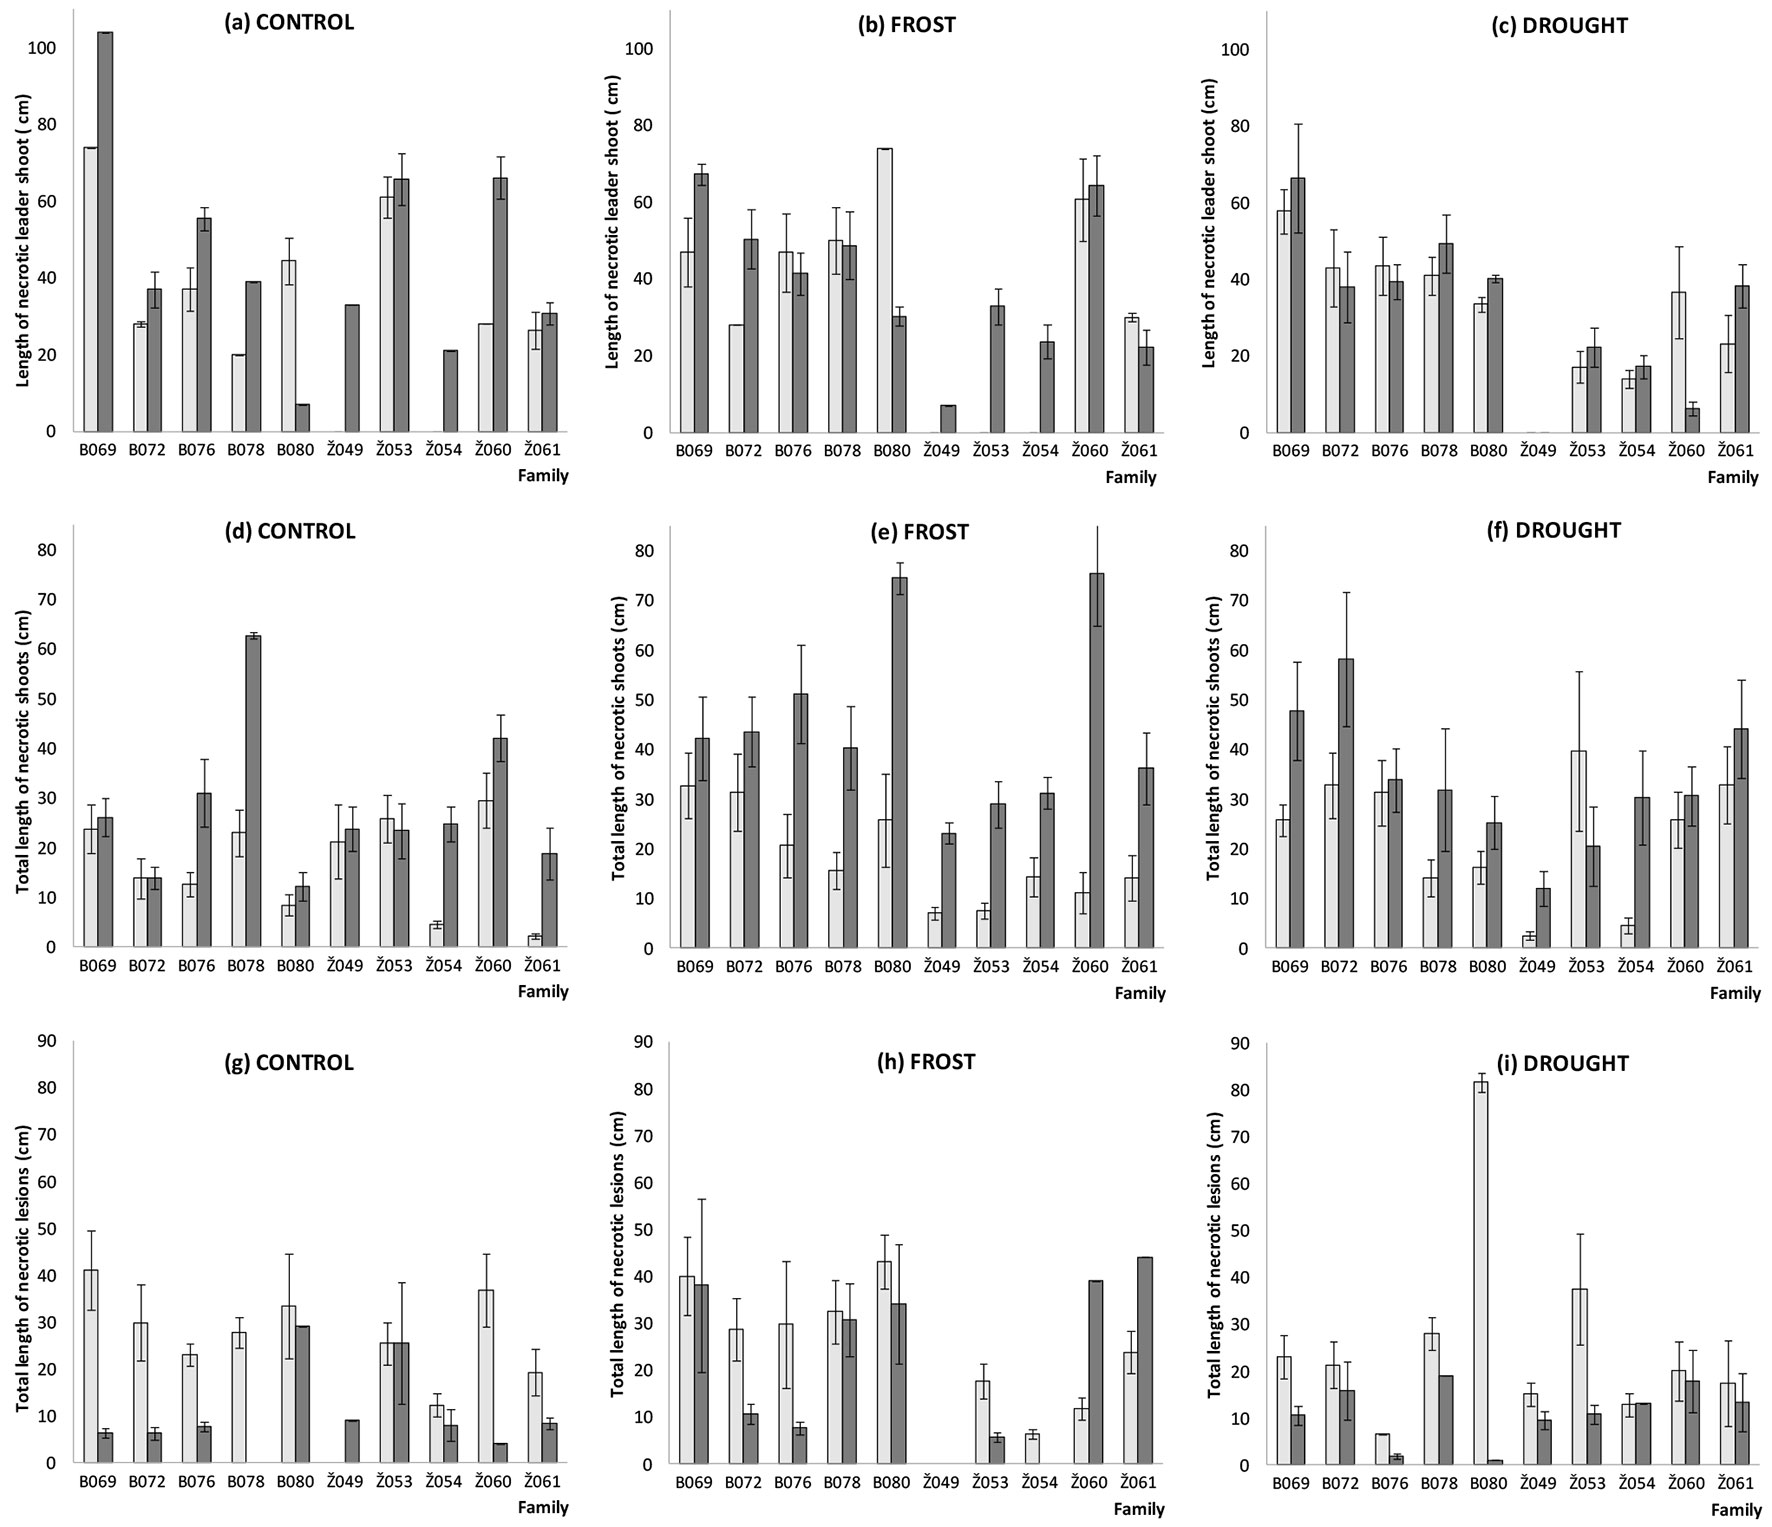
Fig. 2 - Length of necrotic leader shoot (a-c), total length of necrotic shoots (d-f) and total length of necrotic lesions (g-i) in ten tested Fraxinus excelsior families (for family name codes see Materials and methods) before (May 5, 2014, light bars) and after (September 3 2014, dark bars) spring frost, summer drought and control treatments. Bars are means ± standard error.
Mean disease incidence ratio in all three batches of ash seedlings was high (0.77-0.81) already before the treatments (assessed on May 5, 2014), and after the treatments (assessed on September 3, 2014) the disease incidence increased up to 0.90-0.95 (Fig. 1). Such a rapid decline in the number of asymptomatic ash seedlings is not surprising: similar results were obtained also in German trials, where disease incidence increased on average by 16.2% per year (increasing from 13% to 94% in five years - [7]). In the present study, the variation in disease incidence among families was rather small, with one exception: seedlings from family Z049 were far less frequently infected following spring frost (0.44 ± 0.12) and summer drought (0.58 ± 0.10) treatments as compared to other families, where disease incidence ratio following frost and drought treatments was very high and reached respective ratios of 0.90-1.00 and 0.70-1.00 (Tab. 1). ANOVA showed that family effects were statistically significant (Tab. 2). Moreover, for some families (B069, B072 and Z060), symptoms of H. fraxineus could be found on all seedlings irrespective of the applied treatment (Fig. 1, Tab. 1). On the other hand, disease symptoms were frequently observed (0.89-1.00) on non-treated (control) seedlings irrespective of their origin (Fig. 1, Tab. 1). Among families from Zeimelis populations, family Z054 had below average disease incidence in the summer drought and control treatments. No statistically significant difference (at P < 0.05) was found in mean disease incidence ratio (all three treatments combined) between Biržai and Zeimelis populations. Although the highest disease incidence ratio was generally observed in the control treatment (0.95 ± 0.02), it did not differ significantly (P > 0.05) from frost and drought treatments (0.93 ± 0.06 and 0.90 ± 0.05, respectively).
Tab. 1 - Mean values ± standard error of different trait estimates in ten tested Fraxinus excelsior families from Biržai and Zeimelis populations following spring frost, summer drought and control treatments (estimated on September 3, 2014). For definition of traits see Materials and methods.
| Family code |
Treatment | Disease incidence, ratio | Health condition score, points | Survival ratio |
Length of necrotic top shoot, cm | Length of necrotic lateral shoots, cm | Length of necrotic lesions, cm | Bud flushing phenology, pt | Tree height, cm |
|---|---|---|---|---|---|---|---|---|---|
| B069 | CONTROL | 1.00 ± 0.00 | 1.70 ± 0.23 | 0.40 ± 0.11 | 104.00 ± 0.00 | 26.13 ± 3.88 | 6.25 ± 1.01 | 1.30 ± 0.15 | 111.50 ± 2.37 |
| FROST | 1.00 ± 0.00 | 1.40 ± 0.11 | 0.40 ± 0.11 | 67.33 ± 2.74 | 42.25 ± 8.44 | 38.00 ± 18.48 | 1.30 ± 0.15 | 94.00 ± 3.04 | |
| DROUGHT | 1.00 ± 0.00 | 1.60 ± 0.21 | 0.40 ± 0.11 | 66.50 ± 14.15 | 47.75 ± 9.84 | 10.50 ± 2.02 | 2.20 ± 0.30 | 101.50 ± 3.95 | |
| B072 | CONTROL | 1.00 ± 0.00 | 2.50 ± 0.28 | 0.70 ± 0.11 | 37.00 ± 4.62 | 13.92 ± 2.24 | 6.25 ± 1.40 | 1.60 ± 0.28 | 102.00 ± 3.03 |
| FROST | 1.00 ± 0.00 | 2.20 ± 0.23 | 0.70 ± 0.11 | 50.38 ± 7.67 | 43.57 ± 7.06 | 10.63 ± 2.13 | 1.80 ± 0.25 | 98.14 ± 4.53 | |
| DROUGHT | 1.00 ± 0.00 | 2.30 ± 0.29 | 0.60 ± 0.11 | 38.00 ± 9.22 | 58.25 ± 13.56 | 15.71 ± 6.21 | 1.90 ± 0.24 | 93.83 ± 4.47 | |
| B076 | CONTROL | 0.91 ± 0.06 | 2.36 ± 0.23 | 0.91 ± 0.06 | 55.43 ± 3.11 | 30.97 ± 6.80 | 7.71 ± 1.01 | 2.55 ± 0.30 | 90.40 ± 2.48 |
| DROUGHT | 1.00 ± 0.00 | 2.40 ± 0.29 | 0.60 ± 0.11 | 39.33 ± 4.60 | 33.83 ± 6.43 | 1.83 ± 0.53 | 3.00 ± 0.34 | 97.17 ± 3.49 | |
| FROST | 1.00 ± 0.00 | 2.00 ± 0.23 | 0.67 ± 0.11 | 41.40 ± 5.60 | 51.17 ± 9.81 | 7.63 ± 1.32 | 3.00 ± 0.36 | 82.33 ± 6.06 | |
| B078 | CONTROL | 1.00 ± 0.00 | 1.40 ± 0.18 | 0.20 ± 0.09 | 39.00 ± 0.00 | 62.75 ± 0.72 | - | 1.80 ± 0.32 | 90.00 ± 1.73 |
| FROST | 0.90 ± 0.07 | 2.20 ± 0.25 | 0.80 ± 0.09 | 48.75 ± 8.74 | 40.29 ± 8.38 | 30.67 ± 7.68 | 2.00 ± 0.36 | 80.88 ± 4.28 | |
| DROUGHT | 0.90 ± 0.07 | 2.20 ± 0.32 | 0.50 ± 0.12 | 49.33 ± 7.59 | 31.83 ± 12.32 | 19.00 ± 0.00 | 1.80 ± 0.29 | 92.20 ± 4.14 | |
| B080 | CONTROL | 1.00 ± 0.00 | 2.11 ± 0.31 | 0.44 ± 0.12 | 7.00 ± 0.00 | 12.25 ± 2.88 | 29.00 ± 0.00 | 2.67 ± 0.38 | 89.50 ± 6.36 |
| DROUGHT | 0.93 ± 0.05 | 2.64 ± 0.27 | 0.64 ± 0.09 | 40.25 ± 1.01 | 25.25 ± 5.38 | 1.00 ± 0.00 | 3.14 ± 0.35 | 77.78 ± 4.08 | |
| FROST | 1.00 ± 0.00 | 2.29 ± 0.24 | 0.86 ± 0.10 | 30.25 ± 2.46 | 74.50 ± 3.18 | 34.00 ± 12.70 | 4.29 ± 0.19 | 78.50 ± 4.82 | |
| Z049 | CONTROL | 0.89 ± 0.08 | 3.00 ± 0.32 | 0.78 ± 0.10 | 33.00 ± 0.00 | 23.75 ± 4.50 | 9.00 ± 0.00 | 3.78 ± 0.30 | 92.43 ± 2.77 |
| FROST | 0.44 ± 0.12 | 4.33 ± 0.23 | 1.00 ± 0.00 | 7.00 ± 0.00 | 23.13 ± 2.15 | - | 3.33 ± 0.28 | 77.22 ± 2.67 | |
| DROUGHT | 0.58 ± 0.10 | 4.00 ± 0.24 | 0.92 ± 0.06 | - | 12.08 ± 3.53 | 9.50 ± 1.91 | 3.50 ± 0.32 | 93.63 ± 3.70 | |
| Z053 | CONTROL | 0.90 ± 0.07 | 2.20 ± 0.29 | 0.70 ± 0.11 | 65.75 ± 6.68 | 23.40 ± 5.55 | 25.50 ± 12.99 | 2.40 ± 0.29 | 88.57 ± 5.14 |
| FROST | 1.00 ± 0.00 | 2.67 ± 0.23 | 1.00 ± 0.00 | 32.88 ± 4.67 | 28.94 ± 4.61 | 5.75 ± 1.01 | 2.78 ± 0.32 | 90.89 ± 4.69 | |
| DROUGHT | 1.00 ± 0.00 | 2.27 ± 0.23 | 0.73 ± 0.10 | 22.20 ± 5.09 | 20.50 ± 8.08 | 10.75 ± 2.00 | 3.09 ± 0.39 | 74.00 ± 4.80 | |
| Z054 | CONTROL | 0.90 ± 0.07 | 2.70 ± 0.33 | 0.70 ± 0.11 | 21.00 ± 0.00 | 24.67 ± 3.52 | 8.00 ± 3.46 | 2.00 ± 0.31 | 80.43 ± 4.99 |
| FROST | 1.00 ± 0.00 | 2.70 ± 0.25 | 0.80 ± 0.09 | 23.67 ± 4.36 | 31.19 ± 3.20 | - | 2.80 ± 0.35 | 93.13 ± 5.08 | |
| DROUGHT | 0.70 ± 0.11 | 3.00 ± 0.34 | 0.80 ± 0.09 | 17.25 ± 3.03 | 30.30 ± 9.38 | 13.00 ± 0.00 | 2.80 ± 0.40 | 97.13 ± 4.09 | |
| Z060 | CONTROL | 1.00 ± 0.00 | 2.36 ± 0.23 | 0.82 ± 0.08 | 66.10 ± 5.49 | 42.11 ± 4.71 | 4.00 ± 0.00 | 3.36 ± 0.23 | 99.89 ± 5.80 |
| FROST | 1.00 ± 0.00 | 2.75 ± 0.28 | 0.88 ± 0.09 | 64.33 ± 7.81 | 75.35 ± 10.37 | 39.00 ± 0.00 | 2.88 ± 0.35 | 90.29 ± 3.78 | |
| DROUGHT | 1.00 ± 0.00 | 2.18 ± 0.26 | 0.55 ± 0.11 | 6.25 ± 1.88 | 30.63 ± 5.98 | 17.83 ± 6.56 | 2.27 ± 0.30 | 98.67 ± 2.48 | |
| Z061 | CONTROL | 0.90 ± 0.07 | 3.10 ± 0.24 | 1.00 ± 0.00 | 30.75 ± 2.77 | 18.86 ± 5.22 | 8.33 ± 1.17 | 3.30 ± 0.33 | 89.40 ± 5.04 |
| FROST | 1.00 ± 0.00 | 2.88 ± 0.24 | 0.88 ± 0.09 | 22.17 ± 4.49 | 36.21 ± 7.20 | 44.00 ± 0.00 | 3.50 ± 0.18 | 88.57 ± 4.46 | |
| DROUGHT | 0.92 ± 0.06 | 2.75 ± 0.24 | 0.83 ± 0.08 | 38.25 ± 5.62 | 44.11 ± 9.88 | 13.25 ± 6.21 | 3.58 ± 0.26 | 101.00 ± 4.03 |
Tab. 2 - Results from the mixed linear model (2) analysis of different traits in ten tested Fraxinus excelsior families from Biržai and Zeimelis populations (for definition of traits see Materials and methods) following spring frost, summer drought and control treatments: mean ± standard error, family variance component as percent of the total random variation (σ2f) ± standard error, coefficients of phenotypic (CVph) and additive genetic variation (CVa), coefficient of additive heritability (h2a) ± standard error. (*): statistically significant effects at P < 0.05; (ns): non-significant effects at P < 0.05.
| Trait | Treatment | Mean ± se | Family variance component | CVph, % | CVa, % | h2a± se |
|
|---|---|---|---|---|---|---|---|
σ2f (%) ± se |
P | ||||||
| Disease incidence ratio before treatment | CONTROL | 0.77 ± 0.03 | 19.81 ± 11.38 | * | 54.79 | 42.86 | 0.59 ± 0.28 |
| FROST | 0.81 ± 0.03 | 24.02 ± 13.28 | * | 48.39 | 41.47 | 0.72 ± 0.31 | |
| DROUGHT | 0.80 ± 0.03 | 11.73 ± 7.53 | ns | 50.11 | 29.95 | 0.35 ± 0.20 | |
| Disease incidence ratio after treatment | CONTROL | 0.95 ± 0.02 | 0.89 ± 2.81 | ns | 23.00 | 3.76 | 0.03 ± 0.08 |
| FROST | 0.93 ± 0.02 | 43.77 ± 22.10 | * | 26.80 | 31.38 | 1.00 ± 0.38 | |
| DROUGHT | 0.90 ± 0.02 | 19.58 ± 10.94 | * | 33.41 | 25.82 | 0.59 ± 0.27 | |
| Health condition score before treatment, points | CONTROL | 3.40 ± 0.08 | 21.90 ± 12.27 | * | 33.88 | 27.87 | 0.66 ± 0.29 |
| FROST | 3.53 ± 0.08 | 26.86 ± 14.51 | * | 29.07 | 26.31 | 0.81 ± 0.33 | |
| DROUGHT | 3.31 ± 0.08 | 9.57 ± 6.46 | ns | 37.15 | 20.00 | 0.29 ± 0.18 | |
| Health condition score after treatment, points | CONTROL | 2.34 ± 0.09 | 12.92 ± 8.20 | ns | 53.93 | 33.81 | 0.39 ± 0.22 |
| FROST | 2.54 ± 0.09 | 35.98 ± 18.60 | * | 47.87 | 50.41 | 1.00 ± 0.37 | |
| DROUGHT | 2.53 ± 0.09 | 17.29 ± 9.90 | * | 54.15 | 39.28 | 0.52 ± 0.25 | |
| Survival ratio before treatment | CONTROL | 0.98 ± 0.01 | - | - | - | - | - |
| FROST | 1.00 ± 0.00 | - | - | - | - | - | |
| DROUGHT | 0.91 ± 0.02 | - | - | - | - | - | |
| Survival ratio after treatment | CONTROL | 0.67 ± 0.03 | 22.93 ± 12.63 | * | 70.36 | 58.98 | 0.69 ± 0.30 |
| FROST | 0.79 ± 0.03 | 14.34 ± 8.90 | ns | 51.87 | 34.17 | 0.43 ± 0.24 | |
| DROUGHT | 0.66 ± 0.03 | 7.21 ± 5.42 | ns | 71.36 | 33.31 | 0.22 ± 0.15 | |
| Length of necroticleader shoot before treatment,cm | CONTROL | 42.33 ± 3.35 | 62.69 ± 40.61 | ns | 47.47 | 68.88 | 1.00 ± 0.46 |
| FROST | 48.31 ± 4.16 | - | - | 51.65 | - | - | |
| DROUGHT | 37.18 ± 2.93 | 22.61 ± 17.01 | ns | 64.01 | 53.4 | 0.68 ± 0.41 | |
| Length of necroticleader shoot after treatment,cm | CONTROL | 51.20 ± 3.14 | 79.36 ± 41.59 | * | 45.08 | 87.76 | 1.00 ± 0.27 |
| FROST | 40.18 ± 2.51 | 48.47 ± 28.41 | * | 54.50 | 71.59 | 1.00 ± 0.43 | |
| DROUGHT | 35.04 ± 2.89 | 44.25 ± 28.67 | ns | 61.81 | 76.26 | 1.00 ± 0.47 | |
| Length of necrotic lateral shoots before treatment, cm | CONTROL | 17.86 ± 1.61 | 20.07 ± 12.93 | ns | 99.70 | 78.17 | 0.60 ± 0.31 |
| FROST | 20.16 ± 2.16 | 9.28 ± 7.62 | ns | 117.43 | 62.04 | 0.28 ± 0.23 | |
| DROUGHT | 23.88 ± 2.09 | 15.88 ± 11.43 | ns | 101.05 | 70.94 | 0.48 ± 0.27 | |
| Length of necrotic lateral shoots after treatment, cm | CONTROL | 26.89 ± 1.93 | 29.31 ± 19.23 | ns | 77.14 | 75.69 | 0.88 ± 0.37 |
| FROST | 44.03 ± 2.57 | 29.98 ± 16.93 | * | 66.10 | 63.92 | 0.90 ± 0.36 | |
| DROUGHT | 33.24 ± 3.00 | 10.72 ± 8.59 | ns | 97.21 | 55.34 | 0.32 ± 0.24 | |
| Length of necroticlesions before treatment, cm | CONTROL | 23.05 ± 1.98 | 7.39 ± 8.75 | ns | 78.74 | 37.23 | 0.22 ± 0.26 |
| FROST | 22.54 ± 2.74 | 8.05 ± 9.32 | ns | 105.85 | 52.2 | 0.24 ± 0.28 | |
| DROUGHT | 18.38 ± 1.92 | - | - | - | - | - | |
| Length of necroticlesions after treatment, cm | CONTROL | 6.88 ± 0.61 | 1.45 ± 11.94 | ns | 50.56 | 10.55 | 0.04 ± 0.63 |
| FROST | 7.25 ± 0.75 | 41.12 ± 45.63 | ns | 46.10 | 55.42 | 1.00 ± 0.99 | |
| DROUGHT | 9.00 ± 1.19 | 24.49 ± 24.33 | ns | 85.43 | 75.33 | 0.73 ± 0.53 | |
A similar trend was observed also for the damage of individual trees and tree survival ratio within the tested families: rather low health condition scores recorded before the treatments (on May 5, 2014) further declined (mostly due to a large number of seedlings that died) following the treatments (by September 3, 2014 - Fig. 1, Tab. 2). In general, the health condition score of tested trees was low, although it had a tendency to be higher in the spring frost and summer drought treatments than in control (2.52 ± 0.09, 2.56 ± 0.09 and 2.34 ± 0.09, respectively - Tab. 2). Seedling survival rate was higher following spring frost treatment than in the control or following summer drought treatments (0.78 ± 0.03, 0.67 ± 0.03 and 0.66 ± 0.03 respectively - Tab. 2). Seedling mortality was high (21-31% during one vegetation season) following all three treatments. Such high mortality rates corresponded well with the results obtained during our previous studies in Lithuanian ash progeny trials, where almost 90% of the trees died in five years following trial establishment ([33], [34]). Results of a F. excelsior clonal trial in Sweden ([47]) indicated lower mortality rates as compared to those found in our previous studies: 33% mortality recorded during five years at one site (trial established in 1992) and 7% mortality during two years at another site (trial established in 1995). However, trees in the Swedish trials were older (about 20-years-old at the time of the last assessment) compared to our study, which could have positively affected tree survival.
Good health condition (score = 4.33 and 4.00 points) and very high seedling survival rates (1.00 and 0.92) following respective spring frost and summer drought treatments again were found in family Z049 (Fig. 1, Tab. 1), indicating its good adaptability to environmental stress, higher disease resistance and potential for further breeding. In the control treatment, the best surviving family was Z061 (1.00 ± 0.00) which was among the best also following frost and drought treatments (Fig. 1). In contrast to disease incidence ratio, statistically significant differences (P < 0.001) were found between Zeimelis and Biržai populations (all three treatments combined) in mean tree health condition score (2.86 vs. 2.09) and mean survival ratio (0.83 vs. 0.59). This is not surprising since Zeimelis population was among those having the highest complex breeding value index (CBVIi) and the largest proportion of most healthy trees also in our previous studies ([34], [35]). Although there was a high variation in mean health condition scores and ratios of survival among the tested families, neither tree health condition, nor survival differed significantly (P < 0.05) among the treatments (Tab. 3 and Tab. 4), indicating a negligible effect of the simulated adverse conditions on health status and survival of the tested ash seedlings.
Tab. 3 - Results from joint mixed linear model (1) analysis of variance of traits in ten tested Fraxinus excelsior families from Biržai and Zeimelis populations (for definition of traits see Materials and methods) following frost and control treatments: family and family by treatment interaction variance components and their standard errors for random effects as percent of the total random variation, and F-criteria and probabilities (P) of the fixed effects. (*): statistically significant effects at P < 0.05; (ns): non-significant effects at P < 0.05.
| Trait | Random effects | Fixed effects | ||||
|---|---|---|---|---|---|---|
| Families | Families × treatment | Treatment | ||||
σ2f·t (%) ± se |
P | σ2f·t (%) ± se |
P | F | P | |
| Disease incidence before treatment | 23.24 ± 11.93 | * | - | - | 1.61 | ns |
| Disease incidence after treatment | 5.59 ± 9.95 | ns | 19.64 ± 11.19 | * | 0.09 | ns |
| Health condition score before treatment | 23.51 ± 12.19 | * | 0.44 ± 2.15 | ns | 1.19 | ns |
| Health condition score after treatment | 17.89 ± 11.02 | ns | 5.86 ± 4.68 | ns | 1.20 | ns |
| Survival ratio before treatment | - | - | - | - | - | - |
| Survival ratio after treatment | 7.03 ± 8.02 | ns | 12.20 ± 7.76 | * | 2.57 | ns |
| Length of necrotic leader shoot before treatment | 16.11 ± 21.14 | ns | 9.82 ± 21.69 | ns | 1.81 | ns |
| Length of necrotic leader shoot after treatment | 46.34 ± 28.55 | ns | 17.39 ± 12.08 | * | 1.59 | ns |
| Length of necrotic lateral shoots before treatment | - | - | 13.02 ± 6.73 | * | 0.19 | ns |
| Length of necrotic lateral shoots after treatment | 3.85 ± 11.82 | ns | 25.48 ± 15.71 | * | 7.01 | * |
| Length of necrotic lesions before treatment | 3.01 ± 7.13 | ns | 5.03 ± 7.94 | ns | 0.04 | ns |
| Length of necrotic lesions after treatment | 20.57 ± 23.74 | ns | - | - | 0.21 | ns |
| Tree height after treatment | 5.81 ± 6.85 | ns | 6.09 ± 5.97 | ns | 3.77 | ns |
Tab. 4 - Results from the joint mixed linear model (1) analysis of variance of traits in ten tested Fraxinus excelsior families from Biržai and Zeimelis populations (for the definition of traits and the list of tested families, see Materials and methods) following drought and control treatments: family and family by treatment interaction variance components and their standard errors for random effects as percent of the total random variation, and F-criteria and probabilities (P) of the fixed effects. (*): statistically significant effects at P < 0.05; (ns): non-significant effects at P < 0.05.
| Trait | Random effects | Fixed effects | ||||
|---|---|---|---|---|---|---|
| Families | Families × treatment | Treatment | ||||
| (%) ± se | P | (%) ± se | P | F | P | |
| Disease incidence before treatment | 13.17 ± 7.84 | * | 2.41 ± 3.09 | ns | 0.75 | ns |
| Disease incidence after treatment | 5.81 ± 6.25 | ns | 7.55 ± 5.55 | ns | 1.35 | ns |
| Health condition score before treatment | 15.02 ± 8.05 | * | - | - | 0.95 | ns |
| Health condition score after treatment | 13.74 ± 8.04 | * | 1.84 ± 2.79 | ns | 1.75 | ns |
| Survival ratio before treatment | - | - | - | - | - | - |
| Survival ratio after treatment | 10.01 ± 7.16 | ns | 4.91 ± 4.23 | ns | 0.02 | ns |
| Length of necrotic leader shoot before treatment | 3.20 ± 17.91 | ns | 29.33 ± 21.93 | ns | 0.46 | ns |
| Length of necrotic leader shoot after treatment | 13.54 ± 25.71 | ns | 51.49 ± 29.02 | * | 1.53 | ns |
| Length of necrotic lateral shoots before treatment | 2.98 ± 9.03 | ns | 14.29 ± 10.74 | ns | 1.87 | ns |
| Length of necrotic lateral shoots after treatment | - | - | 14.92 ± 7.89 | * | 1.21 | ns |
| Length of necrotic lesions before treatment | 0.66 ± 6.83 | ns | 4.10 ± 8.62 | ns | 1.50 | ns |
| Length of necrotic lesions after treatment | - | - | 21.98 ± 17.70 | ns | 1.72 | ns |
| Tree height after treatment | 7.20 ± 9.07 | ns | 11.86 ± 8.32 | ns | 0.03 | ns |
It must be pointed out that the two most resistant families, Z049 and Z061, had the earliest bud flushing in spring 2014 (mean family scores = 3.54 and 3.46, respectively), while the latest flushing families B069 and B072 (mean family scores = 1.60 and 1.77, respectively) were of comparably low resistance (Fig. 1, Tab. 1). In general, health condition scores and seedling survival ratio showed rather strong positive Pearson’s correlation (R = 0.588, P = 0.001 and R = 0.645, P < 0.001, respectively) with the bud flushing phenology scores indicating that early-flushing clones are less susceptible to infections by H. fraxineus. It can be hypothesized that this correlation between health condition and bud flushing phenology might be attributed to the disease development within a tree during the winter period, that is restrained by earlier cambium activity in spring, or to the reallocation of resources between growth and defense. Timing of reallocation of resources between growth and defense with timing of disease infections was hypothesized as an explanation of the correlation between spring phenology and resistance to DED in Ulmus ([37], [14]). Other studies have also shown that bud flushing and (or) leaf senescence phenology exhibit a moderate to strong correlation with dieback susceptibility ([33], [30], [23], [2], [34], [35]). Yet these relationships were not consistent in all studies ([23]). Interestingly, bud flushing phenology score moderately negatively correlated with mean seedling height (R = -0.376, P = 0.041).
Significant effects (P < 0.01) of the applied treatments were observed for the total length of necrotic lateral shoots, which characterize the spread rate of the disease within a tree and an extent of damage, while this fixed effect was not significant for other studied traits (Tab. 3 and Tab. 4). Following spring frost and summer drought treatments, the total length of necroses in lateral shoots (measured in September 2014) was significantly larger (P < 0.01) than in the control treatment (Tab. 3). In control, mean length of necrotic leader shoots of new vegetation season was higher than on previous year’s leader shoots (42.33 ± 3.35 vs. 51.20 ± 3.14 cm). However, following spring frost and summer drought treatments length of necrotic leader shoots of new vegetation season was lower (Tab. 2). Following treatments mean length of necrotic leader shoots tended to be lower than in control environment. This mean that treatments reduces the disease damage or the spread of disease within a tree.
The total length of necrotic lesions on ash seedlings has decreased following frost and drought treatments; it has decreased also in non-treated (control) seedlings (Tab. 2). This decrease could be explained by the fact that lesions which have caused shoot dieback were further regarded and measured as necrotic leader or lateral shoots, i.e., lesions were merged with the necrotic shoots. When considering the length of necroses in leader and lateral shoots, families Z049, Z054 and Z053 from the Zeimelis population were among the least damaged after spring frost and summer drought treatments (Fig. 2, Tab. 1), while in the control environment, the smallest length of necrotic leader and lateral shoots was observed in families B080, B072, Z054 and Z061, which would also suggest that these families are also quite tolerant (Fig. 2).
As two different aspects of resistance have to be estimated, resistance to infection and resistance to disease spread/development within a tree after infection, for the evaluation of genetic resistance to disease of each tested family or clone at juvenile age in tree breeding we would recommend to compute breeding index composed from indexes of disease incidence (to characterize the resistance to infection) and indexes of length of necrotic lesions and length of dry leader and lateral shoots (to characterize the resistance to disease spread within trees after the infection occurs), as well as index of survival rate. This would be a more correct and precise alternative to visual scoring of health condition.
Despite the observed between-population differences in disease resistance traits, joint ANOVA of individual tree data has not revealed a significant population effect for any of the traits studied (data not presented). This is in a good agreement with results reported by Olrik et al. ([32]), Stener ([46]), McKinney et al. ([30]) and Pliura et al. ([35]), where weak and non-significant population effects on resistance to H. fraxineus have been found. The absence of a significant population effect in the present study could be due to a high among-family variation within the tested populations and a low number of tested populations. In contrast, the results of our previous study on resistance of 340 F. excelsior half-sib families from ten Lithuanian and fourteen west European populations showed significant population effects on disease resistance traits ([34]).
Joint ANOVA revealed significant family effects (P < 0.05) for disease incidence and health condition (both assessed before the treatments) in the ash seedling batch assigned for the spring frost treatment (Tab. 3). Similarly, significant family effects were detected for disease incidence (assessed before the treatments) and health condition (assessed both before and after the treatments) in the seedling batch assigned for the summer drought treatment (Tab. 4). The lack of significant family effects on the rest of the assessed traits may be attributed to the presence of a family by environment (G×E) interaction. Following spring frost treatment, this interaction was found to be significant (P < 0.05) for disease incidence, seedling survival ratio and length of necrotic leader and lateral shoots, while before the treatments, a significant interaction was found only for total length of necrotic lateral shoots (Tab. 3). This G×E interaction indicates genetic variation in plasticity and reaction norms of families across environments (treatments), providing that resistance of ash families to the dieback disease unequally depends on environmental conditions. Studies performed with F. excelsior clones in Denmark ([30]) and Sweden ([47]) showed weak G×E interaction, although each of those studies covered only two clonal trials growing in rather similar environments. In our previous study on resistance of F. excelsior half-sib families, G×E was also weak and non-significant ([34]). The lack of G×E for resistance traits can be due to differences in natural environment conditions of progeny field trials that were not sufficiently pronounced to facilitate differing performance of families across environments.
ANOVA performed on data separately for each treatment (Tab. 2) showed much stronger family effects than in joint ANOVA (Tab. 3 and Tab. 4). The family variance component in health condition was significant (P < 0.05) and increased substantially following spring frost (from 26.86 ± 14.51 to 35.98 ± 18.60%) and summer drought (from 9.57 ± 6.46 to 17.29 ± 9.90% - Tab. 2). The coefficients of additive genetic variation (CVa) and heritability (ha2) also increased following both treatments compared to control (Tab. 2), showing that the induced stress has contributed to the expression of differences in disease resistance traits among the tested families. Despite much smaller amount of the genetic material tested in the present study, CVa coefficients were within a range of values obtained in progeny studies performed in Denmark (CVa = 37-61% - [25]) and Lithuania (CVa = 30-39% - [34]). High CVa values calculated for ash health condition under stressful conditions show good possibilities for resistant families’ selection. High heritability coefficients in turn indicate that the most precise detection of resistant tree genotypes by their phenotype can indeed be done under stressful environmental conditions.
For disease incidence trait, family variance components also largely increased following spring frost and summer drought treatments, although CVa values decreased due to the increase of mean disease incidence rate (Tab. 2). Heritability of this trait also increased following both treatments (Tab. 2). Meanwhile, in the control treatment, the family effect for disease incidence became insignificant in autumn 2014 (after the treatments), as all families had equally high infection (Fig. 1, Tab. 1). In general, significant additive genetic control, which is characterized by CVa and ha2 of resistance traits obtained in this study, corresponded well to the results of recent studies performed in Lithuania, Denmark and Sweden at a family level, where narrow-sense heritabilities ranged between 0.40-0.49 ([34]) and between 0.37-0.52 ([25]), and broad-sense heritabilities obtained in clonal studies ranged from moderate to high ([46], [47], [32], [30], [35]).
Family variance components for the length of necrotic part of leader shoot increased also both following spring frost and summer drought treatments from low and non-significant estimates before treatments to very high estimates after treatments (Tab. 2). Coefficients of additive genetic variation and heritability also became very high (Tab. 2). It can be noticed that family variance components, CVa and ha2 for this trait increased in the control environment as well. Therefore the increase of genetic parameters for the length of necrotic part of leader shoots cannot be attributed to the impact of stressors (i.e., spring frost or summer drought), but rather to the general development of disease in all the environments studied.
Genetic parameters for the total length of necrotic lateral shoots increased (by September 2014) in the control environment and following spring frost treatment, while they decreased following summer drought treatment (Tab. 2). Family variance components and other genetic parameters for the total length of necrotic lesions increased following treatments (by September 2014), although remained non-significant probably due to the low number of observations for this trait.
B-Type genetic correlations among family means of health condition scores recorded following all treatments (assessed on September 3, 2014) were moderate to high (Tab. 5), indicating that both stress environments had a similar impact on seedling health condition, which was generally better in frost- and drought-treated seedlings than in the control. B-Type genetic correlations between length of necrotic shoots across treatments were very low and non-significant, thus indicating that G×E interaction plays an important role in the variation of disease damage expression (Tab. 5).
Tab. 5 - B-Type genetic correlations between health condition scores and total lengths of necrotic shoots estimated following spring frost, summer drought and control treatments (estimates made in September 3, 2014) of the ten tested Fraxinus excelsior families. For the definition of traits, see Materials and methods.
| Trait | Treatment | FROST | DROUGHT |
|---|---|---|---|
| Health condition score |
CONTROL | 0.447 ± 0.118 | 0.642 ± 0.096 |
| FROST | - | 0.933 ± 0.017 | |
| Length of necrotic lateral shoots | CONTROL | 0.096 ± 0.162 | -0.193 ± 0.183 |
| FROST | - | -0.111 ± 0.169 |
Even though the low family by treatment interaction (G×E) variance component in the variation of health condition score and significant B-type genetic correlations showed that performance of the tested ash families across treatments was rather stable, four out of ten tested families (B078, Z049, Z060 and Z061) had significant (P < 0.05) Shukla stability variances, thus significantly contributed to G×E interaction with Wricke ecovalences (Tab. 6). The highest ecovalence values were obtained for the second most damaged family B078 (29.84%) and for the second healthiest family Z061 (20.48%). The best performing family Z049 showed moderate ecovalence (13.30%), and the most heavily damaged family B069 showed very low and non-significant ecovalence (0.63% - Tab. 6). The characteristics of reaction norms and ecovalence estimates of families were not always interrelated, e.g., family B078 with the highest ecovalence and phenotypic plasticity values had the lowest slope coefficient of linear regression, meanwhile family Z061 having the second highest ecovalence value had the highest slope coefficient (Tab. 6).
Tab. 6 - Stability characteristics (for the definition see Materials and methods) of the ten tested Fraxinus excelsior families from Biržai and Zeimelis populations driven from tree health condition scores (assessed on September 3, 2014) following spring frost, summer drought and control treatments.
| Family code | Total Lsmean deviation |
Treatments’ Lsmeans deviations | Phenotypic plasticity |
Wricke ecovalence (we,%) |
Shukla stability variance | Finlay-Wilkinson parameters | |||||||
|---|---|---|---|---|---|---|---|---|---|---|---|---|---|
| Control | Frost | Drought | Variance | F | P | Intercept | Slope coefficient | Residual | R 2 | ||||
| B078 | -0.626 | -1.238 | -0.264 | -0.376 | 0.974 | 29.85 | 0.342 | 10.40 | 0.000 | 1.752 | 0.086 | 0.134 | 0.030 |
| Z061 | 0.494 | 1.001 | 0.289 | 0.193 | 0.808 | 20.48 | 0.230 | 7.01 | 0.001 | -1.197 | 1.650 | 0.170 | 0.890 |
| Z049 | 1.280 | 0.869 | 1.484 | 1.486 | 0.617 | 13.30 | 0.145 | 4.41 | 0.012 | 2.762 | 0.430 | 0.084 | 0.530 |
| Z060 | -0.059 | 0.031 | 0.187 | -0.395 | 0.582 | 9.54 | 0.100 | 3.05 | 0.047 | 0.468 | 0.797 | 0.160 | 0.670 |
| B072 | -0.109 | 0.211 | -0.264 | -0.273 | 0.483 | 8.08 | 0.082 | 2.51 | 0.081 | -1.251 | 1.439 | 0.053 | 0.950 |
| B076 | -0.189 | 0.031 | -0.428 | -0.169 | 0.459 | 5.57 | 0.053 | 1.61 | 0.199 | -1.363 | 1.452 | 0.000 | 1.000 |
| Z053 | -0.122 | -0.184 | 0.118 | -0.301 | 0.419 | 4.93 | 0.045 | 1.38 | 0.251 | 0.717 | 0.677 | 0.040 | 0.860 |
| B080 | -0.138 | -0.301 | -0.194 | 0.082 | 0.383 | 4.11 | 0.036 | 1.09 | 0.338 | 0.050 | 0.928 | 0.076 | 0.860 |
| Z054 | 0.357 | 0.474 | 0.146 | 0.451 | 0.328 | 3.54 | 0.029 | 0.88 | 0.416 | -0.515 | 1.335 | 0.009 | 0.990 |
| B069 | -0.920 | -0.843 | -0.920 | -0.997 | 0.154 | 0.63 | -0.006 | -0.18 | - | -1.085 | 1.063 | 0.010 | 0.980 |
Significant (P < 0.05) G×E interaction variance component in the variation of length of necrotic shoots and the absence of significant B-type genetic correlations showed that disease damage in families across environments (treatments) was quite variable. Seven out of ten tested families significantly contributed (P < 0.001) to G×E interaction, with Wricke ecovalences ranging from 5.27 to 26.08% (Tab. 7). It can be noticed that the slope coefficient of linear regression for the tested families was very different, which indicates different family behavior across treatments.
Tab. 7 - Stability characteristics (for the definition see Materials and methods) of the ten tested Fraxinus excelsior families from Biržai and Zeimelis populations driven from total length of necrotic shoots (measured on September 3, 2014) following spring frost, summer drought and control treatments
| Family code | Total Lsmean deviation |
Treatments’ Lsmeans deviations | Phenotypic plasticity |
Wricke ecovalence (we,%) |
Shukla stability variance | Finlay-Wilkinson parameters | |||||||
|---|---|---|---|---|---|---|---|---|---|---|---|---|---|
| Control | Frost | Drought | Variance | F | P | Intercept | Slope coefficient | Residual | R 2 | ||||
| B078 | 11.74 | 39.98 | -3.02 | -1.74 | 43.00 | 26.08 | 716.2 | 19.53 | 0.000 | 146.14 | -2.786 | 325.95 | 0.590 |
| B072 | 5.34 | -14.47 | -0.37 | 30.85 | 45.32 | 23.43 | 640.4 | 27.65 | 0.000 | -140.55 | 5.110 | 49.28 | 0.970 |
| B080 | -0.54 | -16.32 | 24.56 | -9.86 | 40.89 | 21.05 | 571.9 | 23.40 | 0.000 | -21.48 | 1.590 | 945.04 | 0.140 |
| Z060 | 12.99 | 16.97 | 25.25 | -3.23 | 28.48 | 9.35 | 236.3 | 10.21 | 0.000 | 77.97 | -0.830 | 225.56 | 0.160 |
| Z061 | -0.62 | -8.96 | -6.30 | 13.41 | 22.37 | 6.51 | 154.8 | 8.09 | 0.000 | -72.61 | 3.028 | 48.69 | 0.920 |
| Z049 | -15.49 | -3.50 | -16.86 | -26.10 | 22.59 | 5.62 | 129.5 | 4.71 | 0.009 | 57.28 | -1.050 | 2.77 | 0.960 |
| B069 | 5.20 | -0.85 | -1.44 | 17.89 | 19.33 | 5.27 | 119.3 | 3.25 | 0.039 | -55.15 | 2.700 | 66.30 | 0.870 |
| Z053 | -10.59 | -3.89 | -12.17 | -15.72 | 11.83 | 1.60 | 14.1 | 0.67 | 0.509 | 27.49 | -0.073 | 3.69 | 0.080 |
| Z054 | -5.49 | -2.48 | -10.36 | -3.63 | 7.88 | 0.78 | -9.3 | -0.40 | - | -1.77 | 0.895 | 35.54 | 0.580 |
| B076 | 3.68 | 4.54 | 5.75 | 0.73 | 5.02 | 0.30 | -23.3 | -1.11 | - | 15.94 | 0.654 | 6.48 | 0.800 |
No generalizations can be made on general plasticity of families, as their performance in terms of different disease damage traits was quite different. In general, high plasticity in disease resistance traits should be considered non-adaptive as it reflects a deterioration in plant health condition and fitness. Eriksson ([9]) emphasized that high phenotypic plasticity in adaptive traits may be useful under changing conditions in a short-time period, but it may be detrimental in the long-term, since natural selection is misguided and cannot be fully efficient. In the case of F. excelsior, high phenotypic plasticity would aid natural selection in eradicating the least resistant genotypes. This contradicts the conclusion by Ghalambor et al. ([13]), who claimed that only plasticity that enhances fitness can facilitate adaptive evolution. In some cases, when environmental conditions are not favorable for disease development, natural selection in such an environment may be misguided, and genotypes of high or average plasticity (e.g., family Z060) would probably survive and show similar resistance (damage levels) as in the most resistant genotypes (e.g., families Z049 and Z054) with low phenotypic plasticity.
Concluding remarks
None of the tested F. excelsior families were completely resistant to H. fraxineus, although the significant among-family variation detected in disease incidence and health condition in each treatment points to the additive mode of gene action, thus to a quantitative resistance to the disease. Such a resistance might be durable in long-term as it combines different plant defense mechanisms, thereby diminishing the probability of breaking the resistance due to mutation or adaptation of a pathogen. Neither disease incidence rates, tree health condition scores, nor survival rates differed significantly among the applied treatments (including control), indicating a negligible effect of the simulated adverse conditions on health status of F. excelsior. However, the presence of significant genotype by environment (family × treatment) interactions for disease incidence, total length of necrotic shoots and seedling survival ratios implies that susceptibility of ash families to the dieback disease unequally depends on environmental conditions. This indicates the presence of genetic variation in plasticity and reaction norms across different environments (treatments). Different levels of damage among the ten tested families in two stress-induced events (spring frost and summer drought treatments) and control indicated variable adaptive potential of different families, and warrants testing of material across range of environments in tree breeding for resistance. In general, the plasticity in disease resistance traits should be considered as non-adaptive as it reflects a deterioration of plant health condition and fitness, and adaptive significance of plasticity will depend upon reaction norms and performance of families under certain environmental conditions.
In general, health condition scores and seedling survival ratio showed rather strong positive correlations with the bud flushing phenology scores, in that early-flushing clones are less susceptible to disease caused by H. fraxineus.
Simulated stress conditions may noticeably contribute to expression of the tree traits which are used to rank tested ash individuals, families or populations for their susceptibility to the dieback. Subsequently, this should enable a better evaluation of the performance of different families, effective family selection, and achievement of a marked genetic gain. High heritability coefficients obtained indicate that stressed environment conditions aid in the detection of resistant tree genotypes by their phenotype for recruiting individuals within families for crossing.
Acknowledgments
The study was financially supported by the Research Council of Lithuania (project No. MIP-040/2012 - UOSIS 2012-2014). Sincere thanks to nursery staff of the Dubrava Experimental-Educational State Forest Enterprise for assistance in raising seedlings. We are grateful to anonymous reviewers for their comments and constructive advices.
References
Gscholar
CrossRef | Gscholar
Gscholar
Gscholar
Gscholar
Gscholar
Gscholar
Online | Gscholar
Gscholar
Gscholar
Gscholar
Authors’ Info
Authors’ Affiliation
Diana Marčiulyniene
Vytautas Suchockas
Remigijus Bakys
Institute of Forestry, Lithuanian Research Centre for Agriculture and Forestry, Liepu str. 1, LT-53101 Girionys, Kaunas reg. (Lithuania)
Vytautas Suchockas
Aleksandras Stulginskis University, Studentu str. 13, LT-53361 Akademija - Kaunas (Lithuania)
Institute of Botany of Nature Research Centre, Zaliuju Ežeru str. 49, LT-08406 Vilnius (Lithuania)
Corresponding author
Paper Info
Citation
Pliura A, Lygis V, Marčiulyniene D, Suchockas V, Bakys R (2015). Genetic variation of Fraxinus excelsior half-sib families in response to ash dieback disease following simulated spring frost and summer drought treatments. iForest 9: 12-22. - doi: 10.3832/ifor1514-008
Academic Editor
Alberto Santini
Paper history
Received: Nov 26, 2014
Accepted: Jul 24, 2015
First online: Sep 08, 2015
Publication Date: Feb 21, 2016
Publication Time: 1.53 months
Copyright Information
© SISEF - The Italian Society of Silviculture and Forest Ecology 2015
Open Access
This article is distributed under the terms of the Creative Commons Attribution-Non Commercial 4.0 International (https://creativecommons.org/licenses/by-nc/4.0/), which permits unrestricted use, distribution, and reproduction in any medium, provided you give appropriate credit to the original author(s) and the source, provide a link to the Creative Commons license, and indicate if changes were made.

Web Metrics
Breakdown by View Type
Article Usage
Total Article Views: 54731
(from publication date up to now)
Breakdown by View Type
HTML Page Views: 43904
Abstract Page Views: 4660
PDF Downloads: 4733
Citation/Reference Downloads: 34
XML Downloads: 1400
Web Metrics
Days since publication: 3961
Overall contacts: 54731
Avg. contacts per week: 96.72
Article Citations
Article citations are based on data periodically collected from the Clarivate Web of Science web site
(last update: Mar 2025)
Total number of cites (since 2016): 23
Average cites per year: 2.30
Publication Metrics
by Dimensions ©
Articles citing this article
List of the papers citing this article based on CrossRef Cited-by.
Related Contents
iForest Similar Articles
Research Articles
Genetic variation and heritability estimates of Ulmus minor and Ulmus pumila hybrids for budburst, growth and tolerance to Ophiostoma novo-ulmi
vol. 8, pp. 422-430 (online: 15 December 2014)
Research Articles
Seedling emergence capacity and morphological traits are under strong genetic control in the resin tree Pinus oocarpa
vol. 17, pp. 245-251 (online: 16 August 2024)
Research Articles
Comparison of genetic parameters between optimal and marginal populations of oriental sweet gum on adaptive traits
vol. 11, pp. 510-516 (online: 18 July 2018)
Research Articles
Patterns of genetic variation in bud flushing of Abies alba populations
vol. 11, pp. 284-290 (online: 13 April 2018)
Research Articles
Comparison of range-wide chloroplast microsatellite and needle trait variation patterns in Pinus mugo Turra (dwarf mountain pine)
vol. 10, pp. 250-258 (online: 11 February 2017)
Research Articles
Application of fungicides and urea for control of ash dieback
vol. 8, pp. 165-171 (online: 13 August 2014)
Research Articles
Age trends in genetic parameters for growth and quality traits in Abies alba
vol. 9, pp. 954-959 (online: 07 July 2016)
Research Articles
Genetic control of intra-annual height growth in 6-year-old Norway spruce progenies in Latvia
vol. 12, pp. 214-219 (online: 25 April 2019)
Research Articles
A comparative study of growth and leaf trait variation in twenty Cornus wilsoniana W. families in southeastern China
vol. 10, pp. 759-765 (online: 02 September 2017)
Review Papers
Indicators of drought effects in Pinus sylvestris: genetic analyses to corroborate the results of empirical methods
vol. 3, pp. 89-91 (online: 15 July 2010)
iForest Database Search
Google Scholar Search
Citing Articles
Search By Author
Search By Keywords
PubMed Search
Search By Author
Search By Keyword


