
Local adaptation at a small geographic scale observed in Juniperus excelsa populations in southern Turkey
iForest - Biogeosciences and Forestry, Volume 14, Issue 6, Pages 531-539 (2021)
doi: https://doi.org/10.3832/ifor3769-014
Published: Nov 24, 2021 - Copyright © 2021 SISEF
Research Articles
Abstract
Juniperus excelsa is one of the most common tree species and has a wide geographical and altitudinal distribution in Turkey. It is also resistant to drought and frost damages and can cope with poor soils. In this study, we explore whether there are any differences among eight J. excelsa populations from a narrow geographic region grown in a common garden test site in terms of growth and contents of photosynthetic pigments, proline and nutrients of their 10-year-old saplings. Phenotypic trait differentiation (QST) at all traits, FST at neutral SSRs among six of the populations and associations of traits with environmental conditions at provenance regions were also analysed to test for patterns of local adaptation. Sapling traits of eight J. excelsa populations of from Lakes District in Turkey at the test site showed that populations significantly differed for growth, photosynthetic pigments, proline and nutrient contents. The mean height and diameter of 10-year-old saplings were found as 94.5 cm and 41.6 mm, respectively. Egirdir-Barla and Sütçüler-Tota populations showed the highest performance for the majority of traits at age 10 compared to all other populations. Nutrient contents in leaves were generally in the sufficiency range reported for plant growth. Considering photosynthetic pigments and proline, it could be concluded that the populations were not exposed to severe stress. Among the environmental variables, the best predictors of growth were annual mean minimum temperature and soil texture at the populations’ origin, accounting for 49% of the variation in height and diameter, respectively. Also, higher phenotypic trait differentiation for most traits than genetic differentiation at neutral genetic markers suggests local adaptation at a small geographic scale. The present study revealed adaptive divergence between populations at a small geographic scale. However, environmental similarity between region of origin and test site was not a good indicator of growth-related traits. The results can be used in the early selection of provenances for J. excelsa for plantation establishment.
Keywords
Juniperus excelsa, Chlorophyll, Proline, Phenotypic Trait Differentiation, Local Adaptation
Introduction
Understanding how tree species and populations will respond to climatic changes is crucial for the sustainability of forest management ([48]). This issue requires understanding the pattern and scale of local adaptation ([32]), because genetic variation among populations of forest trees at traits highly fluctuates depending on the climate and environmental adaptation ([4]). Common garden experiments are used to study genetic differentiation at phenotypic traits to detect patterns of local adaptation ([29], [48]).
For example, common garden tests play an important role in investigating adaptive responses to climate variation ([39]). Common gardens generally involve the cultivation of tree populations from different geographic regions with different environmental conditions in several common garden experiments established in different environments ([7]). In each common garden experiment, saplings are planted using a randomized design (e.g., Randomized Complete Block Design) to minimize local environmental differences and separate between genetic and environmental effects on trait expression ([42]). Common gardens were set up to identify the best populations for plantation programs under different environmental conditions ([39]).
Growth traits are strongly affected by the interaction between genotype and environmental resources such as water, soil fertility, etc. ([29]). Therefore, it is advisable to conduct the measurements of growth traits in combination with the assessment of other traits in order to decrease the risks associated with sapling transfer ([21]). Chlorophylls, carotenoids and proline play crucial roles for example in preventing various diseases associated with oxidative stress ([43]) and are good proxies for the general health of forests ([36]). Macro- and trace elements such as sodium, magnesium, aluminium, phosphorus, potassium, calcium, iron, copper and zinc are critical components of different biochemical processes in plants. For this reason, concentrations of these elements in leaves should be sustained within a certain range since their deficiency prevents growth and their excess can cause a toxic effect ([44]).
Junipers are keystone species in ecosystems of arid regions worldwide because they grow in many harsh environments and are often used for ecological restoration across arid and continental regions. In this regard, J. excelsa is one of the most common tree species and has a wide geographical and altitudinal distribution in Turkey ([50]). As it is resistant to drought and frost damages and can cope with poor soils ([50]), it grows at the boundaries of steppe in the interior parts of the mountains ([11], [50]).
Up to now, there are studies conducted on genetic variation within and among populations of J. excelsa based on phenotypic traits measured in the nursery ([51]) and natural populations ([12]), isozymes ([20]), chloroplast DNA ([18]) and nuclear microsatellite markers ([11], [50]). However, there have been no previous studies on local adaptation to different micro-environments at a small geographic in a mountainous region. In the present study, we assessed the variability in growth and contents of photosynthetic pigments, proline and nutrients of neighbouring J. excelsa populations from distinct environments grown at a common garden test site. Specifically it will be tested: (1) whether there are substantial differences in survival rates across eight J. excelsa populations at the test site; (2) whether there are significant differences in growth and contents of photosynthetic pigments, proline and nutrient among the eight populations at the test site; (3) whether there are correlations between the pairs of traits and of environmental variables at the regions of populations’ origin with both growth and contents of photosynthetic pigments, proline and nutrient at the test site; (4) whether there is a pattern of local adaptation by comparing phenotypic trait differentiation (QST) in the current study and FST at neutral SSRs in an earlier study ([50]) among six of the populations at the same test site, as higher phenotypic differentiation than differentiation at neutral genetic markers could indicate divergent selection on the traits.
Materials and methods
Planting material and experimental site
One-year-old containerized saplings of eight Juniperus excelsa populations from the Lakes District of Turkey were planted at a common garden test site in the northwestern part of Davraz Mountain (37° 46′ N, 30° 41′ E; 1500 m a.s.l.) located about 25 km away from Isparta, Turkey, in early March 2009 (Fig. 1, Tab. 1). Parent trees were between 130 and 140 years old based on tree ring countings using a Pressler increment borer.
Fig. 1 - Location of populations planted in Davraz Common Garden (DCG) test site.
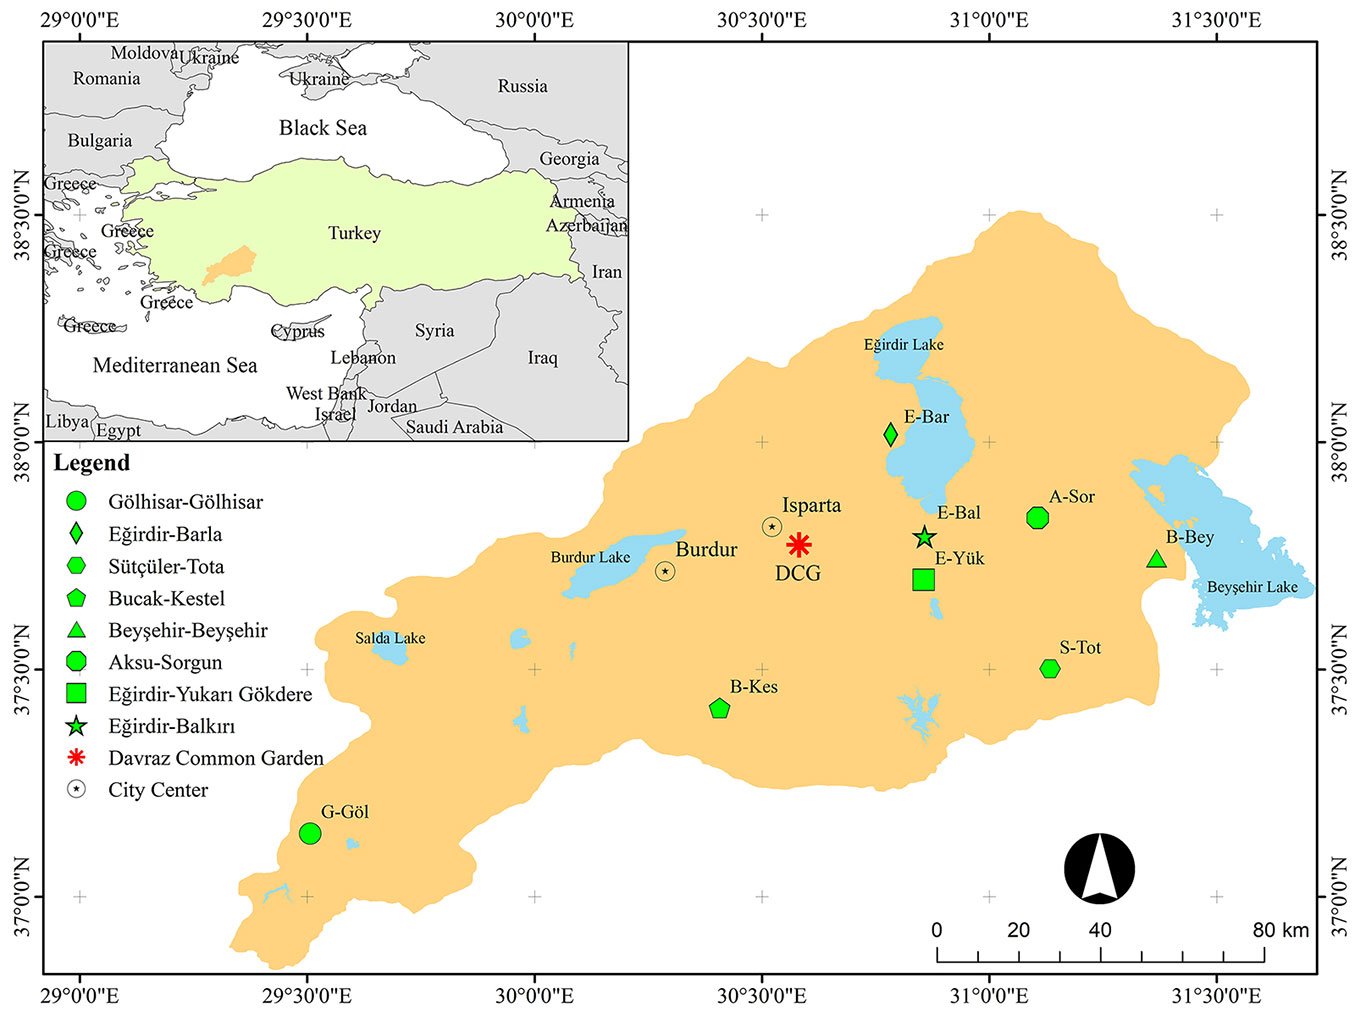
Tab. 1 - Geographic positions, environmental and climatic features of Davraz common garden and the eight Juniperus excelsa populations used in the present study (modified from [50]). (TAP): total annual precipitation; (MAT): mean annual temperature; (MATmax): mean annual maximum temperature; (MATmin): mean annual minimum temperature; (PEI): precipitation effectiveness index; (TWI): topographic wetness index.
| Population (test site) |
Altitude (m a.s.l.) |
Aspect | Coords | Soil Texture |
TAP (mm) |
MAT (°C) |
MATmax (°C) |
MATmin (°C) |
PEI | Climate | TWI |
|---|---|---|---|---|---|---|---|---|---|---|---|
| Gölhisar-Gölhisar (G-Göl) | 1413 | SE | 36°57.115′ N 29°27.236′ E |
Sandy loam | 510.7 | 11.2 | 24.2 | -0.1 | 21.1 | Semi-arid | 6.6 |
| Egirdir-Barla (E-Bar) | 1027 | SE | 37°58.162′ N 30°46.289′ E |
Sandy clay | 542.2 | 13.8 | 23.8 | 4.5 | 22.8 | Semi-arid | 5.7 |
| Sütçüler-Tota (S-Tot) | 1546 | NE | 37°34.678′ N 31°04.306′ E |
Sandy clay | 1407.2 | 11.2 | 23.3 | 1.2 | 60.4 | Much humid | 7.7 |
| Bucak-Kestel (B-Kes) | 1197 | SE | 37°24.863′ N 30°21.036′ E |
Sandy loam | 745.8 | 13.2 | 25.7 | 1.9 | 29.0 | Semi-humid | 13.4 |
| Beysehir-Beysehir (B-Bey) | 1151 | NE | 37°39.043′ N 31°42.058′ E |
Sandy clay | 483.4 | 11.1 | 23.3 | -1.3 | 20.8 | Semi-arid | 7.1 |
| Aksu-Sorgun (A-Sor) | 1416 | NE | 37°50.488′ N 31°05.782′ E |
Sandy clay | 964.5 | 11.0 | 23.2 | -2.0 | 41.6 | Humid | 6.4 |
| Egirdir-Yukari Gökdere (E-Yuk) | 1150 | SE | 37°40.558′ N 30°50.570′ E |
Sandy clay | 918.9 | 11.8 | 22.3 | 1.4 | 41.2 | Humid | 8.5 |
| Egirdir-Balkiri (E-Bal) | 1493 | E | 37°47.101′ N 30°48.981′ E |
Sandy loam | 1104.1 | 10.0 | 20.5 | -0.4 | 53.9 | Humid | 9.8 |
| Davraz Common Garden (DCG) | 1500 | NW | 37°46.103′ N 30°41.285′ E |
Sandy | 843.8 | 9.8 | 20.0 | -0.6 | 42.2 | Humid | 8.6 |
The test site was established on a northwestern slope. According to the results of the soil analysis conducted in the Soil Science and Ecology Institute, Çankiri Karatekin University, the soil at test site was sandy, stony and shallow, and was composed by low organic matter component, calcareous (1.8%), no salt (0.11%), too much nitrogen (0.44%), much potassium (411 mg kg-1), much iron (18 mg kg-1), adequate phosphorus (9 mg kg-1), adequate magnesium (0.02%), adequate manganese (22.7 mg kg-1), adequate zinc (0.8 mg kg-1), adequate copper (1.6 mg kg-1) contents, and with slightly alkaline pH (7.5). The identification of adequacy in soil properties was made based on Sillanpaeae ([45]). A soil cultivation with ripper was done at the test site. The annual average precipitation was 581 mm and the annual average temperature was 12 °C ([1]).
Experimental design
The layout of the experiment was a randomized complete block design with three replications. Sufficient homogeneity was achieved within the blocks extending from uphill to downhill, and environmental differences among populations were minimized. Spacing between saplings was 2 × 3 m. Each population was represented by 30 saplings (10 saplings per block) grown from seeds in Egirdir Forest Nursery ([51]). The total number of seedlings planted was 240.
Sampling strategy
Height, diameter and volume were determined for all the 30×8 saplings. For the plant nutrient, photosynthetic pigment and proline analyses, five saplings from each of the eight populations (at least one sapling from each block) were randomly sampled (a subset of 5×8 saplings). About 2 g leaf samples from each of the saplings were collected in August of 2018 to use as fresh material. They were immediately wrapped in aluminium foil and put on dry ice at the test site. Then, these samples were taken to the Department of Landscape Architecture, Çankiri Karatekin University without breaking the cold chain. Fresh leaf samples were kept at -20 °C until the day of analysis. Also, about 100 g leaf samples from each of the saplings were collected in late September of 2018 to use as dry material. After collecting, these samples were immediately dried at 70 °C in an oven for five days in the laboratory of Burdur Mehmet Akif Ersoy University and then dried samples were taken to the Department of Landscape Architecture, Çankiri Karatekin University.
Plant analyses
The dried leaf samples were digested using the dry-ashing method in a muffle furnace at 500 °C for 6 hours, later dissolved in 10 N nitric acid (HNO3), and finally extracts were filtered and stored in plastic sample jars until the day of analysis of mineral nutrients ([33]). The concentrations of P, K, Ca, Mg, Na, Cu, Mn, Fe and Zn were determined by ICP-OES (Optima® 2100 DV, Perkin-Elmer ,Waltham, MA, USA). Nitrogen concentration was determined through the method developed by Kjeldahl ([25]).
Photosynthetic pigment analysis
The fresh leaf samples (250 mg) were cut into small pieces and homogenized in 10 mL of acetone (90%, v/v). The extract was then filtered and the absorbance of the extract was measured at 645, 652, 663 and 470 nm using a spectrophotometer (UV/VIS-1201, Shimadzu Corp., Kyoto, Japan). The concentrations of chlorophylls (chl) and carotenoid (car) were calculated based on Lichtenthaler ([31]).
Proline analysis
Free proline was extracted with 3% sulphosalicylic acid from fresh leaves (0.5 g) and determined according to the method of Bates et al. ([5]). Extracts (2 mL) were maintained for 1 h in boiling water with the addition of 2 mL ninhydrin and 2 mL glacial acetic acid. Cold toluene (4 mL) was added afterwards and shaken with a vortex. Finally, absorbance was read at 520 nm. The proline concentration was determined from a standard curve using L-Proline and expressed in mmol kg-1 FW.
Growth analysis
For the growth analysis, height (cm) and diameter (mm) of 30 saplings from each of the populations were measured in late September of 2018 using a tape measurer and a digital calliper, respectively. Furthermore, volumes of saplings were calculated using the equation developed for J. excelsa by Eler ([13]) as follows (eqn. 1):
where V is the volume (cm3), d is the diameter and h the height of saplings.
Environmental variables
Soil texture for the region of origin of each of the eight populations was determined by using the feel method ([15]). Accordingly, sandy, sandy loam and sand clay contained <10% (=1), 10-30% (=2) and 35-55% clay (=3), respectively.
Data of total annual precipitation (mm), annual mean temperature (°C), annual mean maximum and minimum temperatures (°C) in the eight meteorological stations (ms), that were the closest to the studied populations and common garden test site, were provided from Turkish State Meteorological Service. Then, total annual precipitation of populations (p) were interpolated using the formula of Schreiber ([40]) as follows (eqn. 2):
where Pp and Pms are the total annual precipitations of populations and meteorological stations (mm), hp and hms are altitudes of populations and meteorological stations (m), 54/100 is a constant showing 54 mm of precipitation increases at every 100 meters. Annual mean temperature, annual mean maximum and minimum temperatures of populations were interpreted using the lapse rate formula as follows (eqn. 3):
where Tp and Tms are the temperatures of populations and meteorological stations (°C), 0.005 is a constant ([24]).
Precipitation effectiveness index was calculated by taking the ratio of total annual precipitation to the annual mean maximum temperature, and then this index was used to determine the climate type for each population ([14]).
Topographic wetness index was calculated as follows (eqn. 4):
where αs is the specific catchment area (m2), tan β is the local slope ([37]). Calculations were made using ArcMap® v. 10.4.1 (ESRI, Redlands, CA, USA). Artificial digital elevation models with a series of resolutions finer than 25 m were used to evaluate TWI quantitatively.
Statistical analysis
Normal distribution of the data in height, diameter and volume was tested through a Kolmogorov-Smirnov test. Parametric tests were performed as residuals of the model were homoscedastic. Mean, standard deviation, F ratio and probability (P-value) of all the traits were calculated and compared among populations through analysis of variance (ANOVA) and adjusted Duncan’s multiple range tests (p < 0.05). The means of height and diameter were compared between soil textures using a t-test. Quantitative trait differentiation ([46]) among populations was estimated for all traits as follows (eqn. 5):
where σ2G(among) is the variance among populations and σ2G(within) the variance within populations. QST were calculated not only for the six populations for which FST values were available, but also for all eight populations. QST describes the genetic differentiation at traits among provenances in the common garden test in which the environmental variance is minimized. Since we had no pedigree information we estimated broad-sense QST which can include components of non-additive genetic components (dominance, epistasis, maternal effects). However, genetic variance for complex traits has been reported to be additive in most cases ([19]). In addition, the correlations of both nutrient contents and environmental variables (total annual precipitation, annual mean temperature, annual mean maximum and minimum temperatures, precipitation effectiveness index, topographic wetness index and soil texture) at the populations’ regions of origin with growth, photosynthetic pigments and proline were performed using Pearson’s correlation coefficients. Differences among populations were visualized using a dendrogram from hierarchical cluster analyses based on growth, photosynthetic pigments, proline and nutrient contents. All statistical analyses were conducted using SPSS® v. 25 (IBM, Armonk, NY, USA).
Results
We found very few saplings with damaged crown, but the survival rate of all populations was 100%.
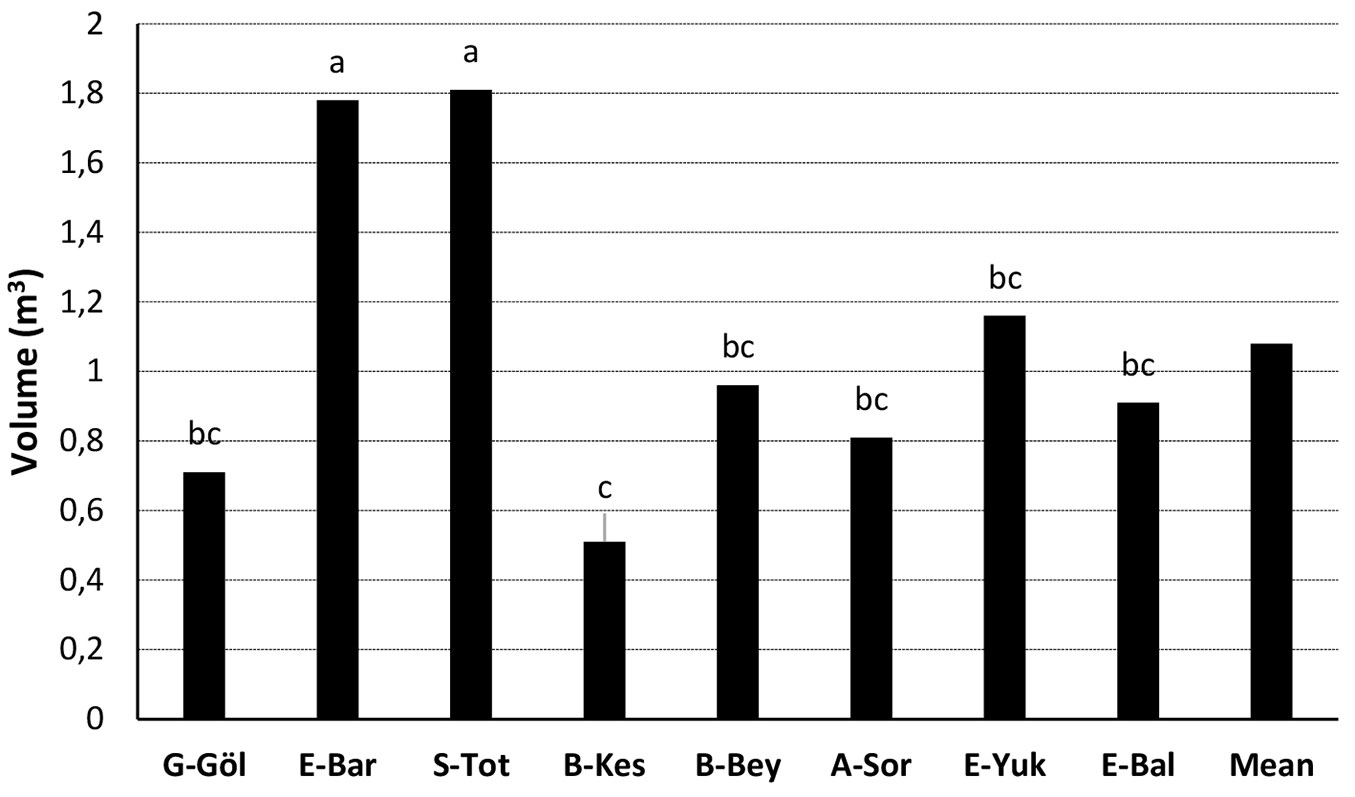
The distribution of height and diameter for 10-year-old saplings of eight J. excelsa populations are presented in Fig. 2. The ANOVA showed significant differences among populations for height and diameter (p < 0.001). E-Bar and G-Göl populations showed the highest (115.06 cm) and lowest (78.08 cm) performances in height, while S-Tot and B-Kes populations showed the best (50.8 mm) and worst (32.5 mm) performances in diameter. The mean height and diameter were 94.47 cm and 41.6 mm, respectively (Fig. 2). The differences (%) of the populations with the highest height and diameter from the grand mean of the populations in the current study were 22%. The differences between the populations with the highest (E-Bar and S-Tot) and lowest (G-Göl and B-Kes) heights and diameters were 47% and 56%, respectively. The highest mean volumes were 52.07 cm3 and 51.13 cm3 in S-Tot and E-Bar populations, respectively. Besides, B-Kes population had the lowest mean volume (14.82 cm3 - Fig. 3). Overall, sapling materials from E-Bar, S-Tot and E-Yuk were above the general averages of height, diameter and volume compared to the other populations (Fig. 2, Fig. 3). The regions of these populations also had relatively high annual mean minimum temperatures as compared to the other populations, but the same soil texture (Tab. 1).
Fig. 2 - Boxplot diagrams of height (a) and diameter (b) of 10-years-old saplings from eight J. excelsa populations grown at the common garden test site (Fheight = 8.429, p<0.001; Fdiamater = 8.357, p<0.001). In both panels, different letters indicate significant differences (p<0.05) between the mean of the populations. Blue lines show the grand means of height (94.47 cm) and diameter (41.6 mm).
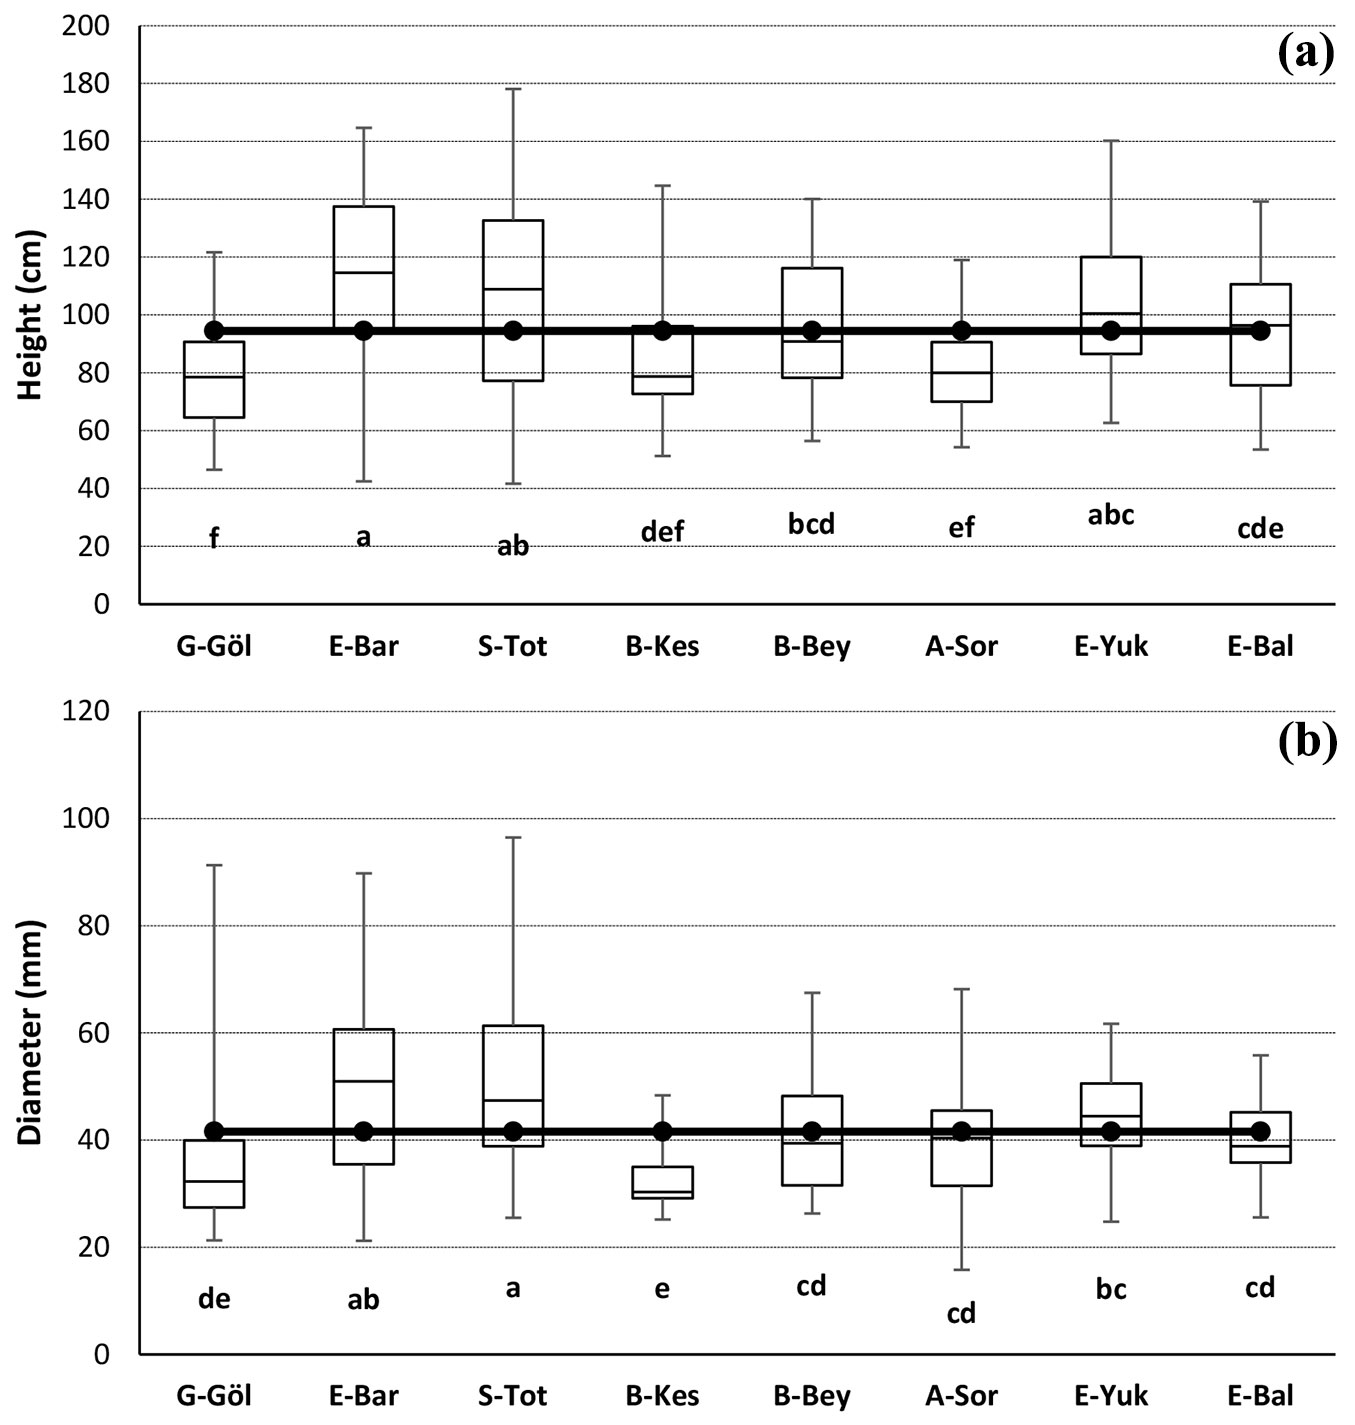
Fig. 3 - Mean volumes of 10-years-old saplings from eight J. excelsa populations grown at the common garden test site (Fvolume = 8.229, p <0.001). Different letters indicate significant differences (p<0.05) between the mean of the populations.
ANOVA revealed significant differences among populations for all photosynthetic pigments and proline (p < 0.05). G-Göl population had the highest total chl (0.727 mg g-1 FW), chl a (0.405 mg g-1 FW) and chl a+b (0.567 mg g-1 FW), while E-Bar population had the highest chl b (0.167 mg g-1 FW) and car (0.192 mg g-1 FW). S-Tot population had the highest proline concentration (0.523 mmol kg-1 FW). The lowest total chl (0.394 mg g-1 FW), chl a (0.182 mg g-1 FW) and chl a+b (0.318 mg g-1 FW) were found in E-Bal population. The lowest chl b (0.111 mg g-1 FW) was determined in E-Yuk population. The lowest car (0.117 mg g-1 FW) and proline (0.358 mmol kg-1 FW) were found in B-Kes population. E-Bal population had significantly lower chl a than the other populations. B-Kes, E-Yuk and E-Bal populations were significantly different from other populations in terms of proline (Tab. 2).
Tab. 2 - Mean ± standard deviation, range, F ratio and significance (p) for photosynthetic pigments and proline of J. excelsa 10-year-old saplings. (Total chl): total chlorophyll; (chl a, b and a+b): Chlorophyll a, b and a+b; (car): carotenoid. Different letters in the columns indicate significant differences (p<0.05) between population means.
| Populations (Label) | Total chl (mg g-1 FW) |
chl a (mg g-1 FW) |
chl b (mg g-1 FW) |
chl a+b (mg g-1 FW) |
car (mg g-1 FW) |
Proline (mmol/kg FW) |
|---|---|---|---|---|---|---|
| Gölhisar-Gölhisar (G-Göl) | 0.727 ± 0.12 a | 0.405 ± 0.03 a | 0.162 ± 0.03 ab | 0.567 ± 0.05 a | 0.184 ± 0.02 ab | 0.475 ± 0.04 bc |
| Egirdir-Barla (E-Bar) | 0.657 ± 0.07 ab | 0.363 ± 0.04 ab | 0.167 ± 0.02 a | 0.529 ± 0.06 ab | 0.192 ± 0.02 a | 0.514 ± 0.03 ab |
| Sütçüler-Tota (S-Tot) | 0.610 ± 0.08 bc | 0.350 ± 0.04 b | 0.150 ± 0.01 abc | 0.500 ± 0.06 ab | 0.136 ± 0.07 bc | 0.523 ± 0.01 a |
| Bucak-Kestel (B-Kes) | 0.568 ± 0.13 bc | 0.328 ± 0.07 b | 0.134 ± 0.02 bcd | 0.462 ± 0.10 bc | 0.117 ± 0.06 c | 0.358 ± 0.01 d |
| Beysehir-Beysehir (B-Bey) | 0.500 ± 0.06 cd | 0.266 ± 0.04 c | 0.130 ± 0.01 cd | 0.396 ± 0.05 cd | 0.142 ± 0.02 bc | 0.517 ± 0.03 ab |
| Aksu-Sorgun (A-Sor) | 0.449 ± 0.02 d | 0.243 ± 0.01 c | 0.117 ± 0.01 d | 0.360 ± 0.02 de | 0.140 ± 0.01 bc | 0.439 ± 0.07 c |
| Egirdir-Yukari Gökdere (E-Yuk) | 0.417 ± 0.09 d | 0.239 ± 0.03 c | 0.111 ± 0.01 d | 0.349 ± 0.03 de | 0.139 ± 0.02 bc | 0.365 ± 0.01 d |
| Egirdir-Balkiri (E-Bal) | 0.394 ± 0.03 d | 0.182 ± 0.02 d | 0.136 ± 0.04 bcd | 0.318 ± 0.04 e | 0.122 ± 0.02 c | 0.377 ± 0.01 d |
| Mean | 0.540 ± 0.14 | 0.297 ± 0.08 | 0.138 ± 0.03 | 0.435 ± 0.10 | 0.147 ± 0.04 | 0.446 ± 0.07 |
| Range | 0.280 - 0.860 | 0.160 - 0.440 | 0.090 - 0.200 | 0.290 - 0.630 | 0.020 - 0.210 | 0.340 - 0.560 |
| F | 10.883 | 19.277 | 4.375 | 14.295 | 2.820 | 22.010 |
| p | <0.001 | <0.001 | 0.002 | <0.001 | 0.021 | <0.001 |
According to the ANOVA, there were significant differences between populations for nutrient contents (p < 0.05). The highest means of P (0.26%), K (73%), Mg (20%), Cu (9.15 mg kg-1) and Zn (21.29 mg kg-1) were found in S-Tot population. G-Göl population showed the highest means of N (1.35%) and Ca (1.62%). The highest means of Mn (42.12 mg kg-1) and Fe (76.75 mg kg-1) were determined in E-Bar and E-Bal populations, respectively. The lowest means of P (0.18%), K (62%) and Zn (13.46 mg kg-1) were found in G-Göl population. E-Yuk population revealed the lowest means of N (1.19%), Mg (0.12%) and Fe (51.19 mg kg-1). E-Bar population had the lowest means of Ca (1.34%) and Cu (6.14%). The lowest mean of Mn (28.85 mg kg-1) was found in B-Kes population. E-Yuk population had significantly lower Mg than the other populations. E-Bar and B-Bey populations had significantly higher and lower Mn then the other populations (Tab. 3).
Tab. 3 - Mean ± standard deviation, range, F ratio and significance (p) for the nutrient contents of J. excelsa 10-year-old saplings. (N): Nitrogen; (P): Phosphorous; (K): Potassium; (Ca): Calcium; (Mg): Magnesium; (Cu): Copper; (Mn): Manganese; (Fe): Iron; (Zn): Zinc. Different letters in the columns indicate significant differences (p<0.05) between the population means.
| Pop | N (%) |
P (%) |
K (%) |
Ca (%) |
M (%) |
Cu (mg kg-1) |
Mn (mg kg-1) |
Fe (mg kg-1) |
Zn (mg kg-1) |
|---|---|---|---|---|---|---|---|---|---|
| G-Göl | 1.35 ± 0.14 a | 0.18 ± 0.02 d | 0.62 ± 0.07 b | 1.62 ± 0.14 ab | 0.17 ± 0.01 c | 6.52 ± 0.76 bc | 37.15 ± 1.68 b | 54.79 ± 6.13 c | 13.46 ± 0.89 f |
| E-Bar | 1.33 ± 0.06 a | 0.24 ± 0.01 ab | 0.69 ± 0.03 ab | 1.34 ± 0.09 cd | 0.18 ± 0.04 abc | 6.14 ± 0.60 c | 42.12 ± 2.92 a | 58.00 ± 9.15 bc | 20.95 ± 0.60 a |
| S-Tot | 1.26 ± 0.05 ab | 0.26 ± 0.03 a | 0.73 ± 0.04 a | 1.54 ± 0.23 abcd | 0.20 ± 0.03 ab | 9.15 ± 1.22 a | 32.80 ± 3.89 bc | 72.28 ± 10.92 a | 21.29 ± 1.28 a |
| B-Kes | 1.26 ± 0.10 ab | 0.24 ± 0.01 ab | 0.69 ± 0.03 a | 1.43 ± 0.10 bcd | 0.17 ± 0.02 bc | 7.00 ± 0.45 bc | 28.85 ± 2.28 c | 65.85 ± 9.17 ab | 17.49 ± 1.46 cd |
| B-Bey | 1.27 ± 0.09 ab | 0.20 ± 0.02 cd | 0.74 ± 0.04 a | 1.33 ± 0.05 d | 0.21 ± 0.02 a | 7.66 ± 0.63 b | 21.27 ± 1.05 d | 51.05 ± 5.09 c | 14.98 ± 1.05 ef |
| A-Sor | 1.32 ± 0.09 a | 0.22 ± 0.01 bc | 0.73 ± 0.01 a | 1.57 ± 0.23 abc | 0.17 ± 0.01 bc | 7.37 ± 0.86 bc | 36.98 ± 6.72 b | 66.21 ± 5.68 ab | 18.73 ± 0.62 bc |
| E-Yuk | 1.19 ± 0.05 b | 0.21 ± 0.02 c | 0.66 ± 0.08 ab | 1.44 ± 0.11 bcd | 0.12 ± 0.01 d | 6.15 ± 1.06 c | 35.45 ± 2.02 b | 51.19 ± 2.16 c | 16.31 ± 2.12 de |
| E-Bal | 1.34 ± 0.08 a | 0.20 ± 0.02 cd | 0.67 ± 0.08 ab | 1.67 ± 0.19 a | 0.17 ± 0.01 bc | 6.25 ± 1.15 c | 30.90 ± 0.28 c | 76.75 ± 10.65 a | 19.71 ± 0.66 ab |
| Mean | 1.29 ± 0.09 | 0.22 ± 0.03 | 0.69 ± 0.06 | 1.49 ± 0.19 | 0.18 ± 0.03 | 7.03 ± 1.26 | 33.19 ± 6.67 | 62.01 ± 11.66 | 17.86 ± 2.88 |
| Range | 1.12 - 1.57 | 0.15 - 0.28 | 0.51 - 0.77 | 1.24 - 1.97 | 0.11 - 0.25 | 4.43 - 11.10 | 20.11 - 45.14 | 42.52 - 94.67 | 12.12 - 23.32 |
| F | 1.924 | 11.505 | 3.007 | 3.198 | 8.299 | 6.848 | 19.563 | 7.532 | 28.020 |
| p | 0.098 | <0.001 | 0.015 | 0.011 | <0.001 | <0.001 | <0.001 | <0.001 | <0.001 |
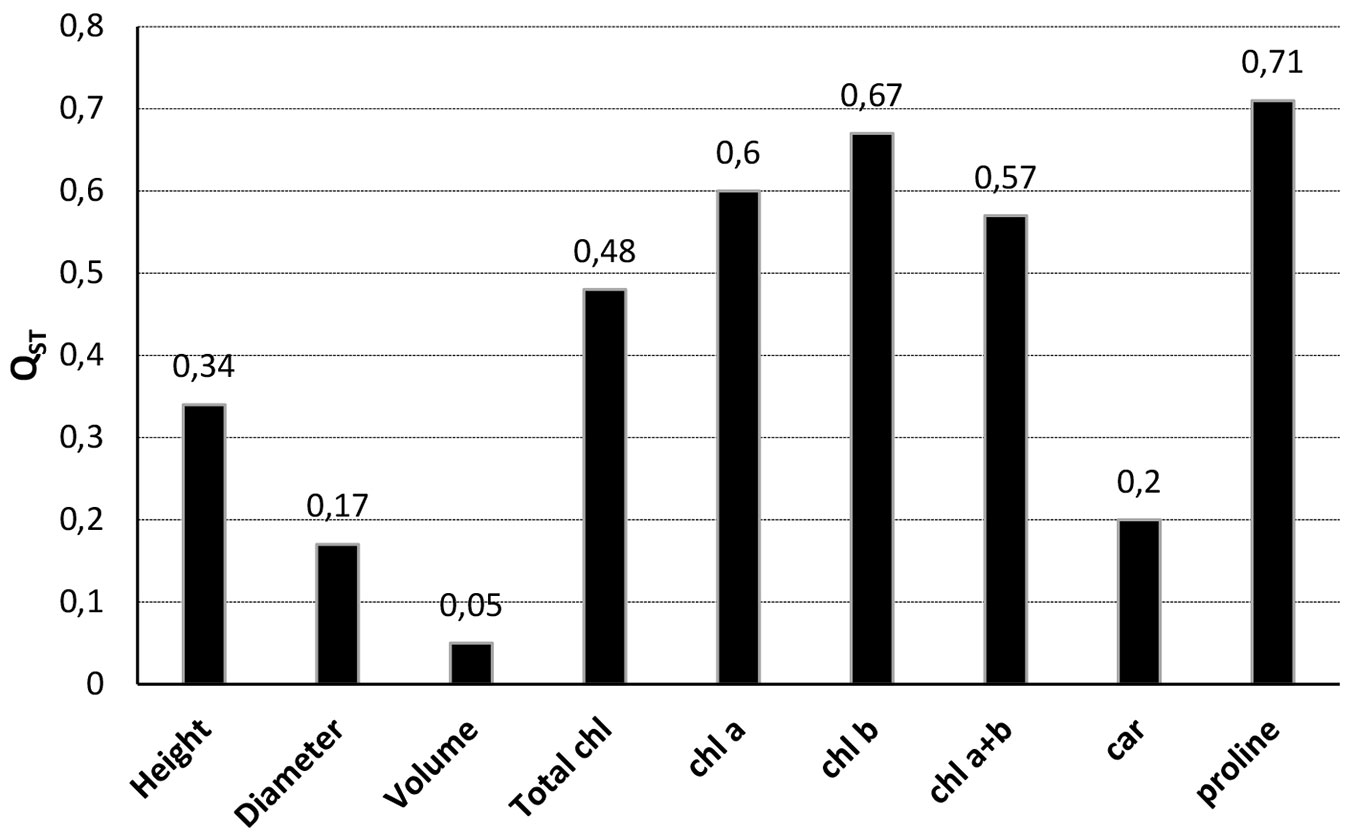
Proline (QST = 0.71), chl b (QST = 0.67), chl a (QST = 0.60) and chl a+b (QST = 0.57) had the highest QST values among J. excelsa populations, while volume (QST = 0.05) and diameter (QST = 0.17) had the lowest QST values (Fig. 4).
Fig. 4 - Phenotypic trait differentiation (QST) values among J. excelsa populations (except Egirdir-Barla and Egirdir-Yukarigökdere populations). (Total chl): total chlorophyll; (chl a, b and a+b): chlorophyll a, b and a+b; (car): carotenoid.
There were positive correlations between height and Zn, and between diameter and Fe. On the other hand, there were positive correlations of N with both total chl and chl b and of Mg with total chl, chl a and b, car and proline. There was no correlation between phenotypic and photosynthetic traits. While height was strongly correlated with diameter (R = 0.88) and volume (R = 0.90), diameter had a strong correlation with volume (R = 0.98, p < 0.05 - Tab. S1 in Supplementary material). However, there was no association between growth and distances of populations from the test site.
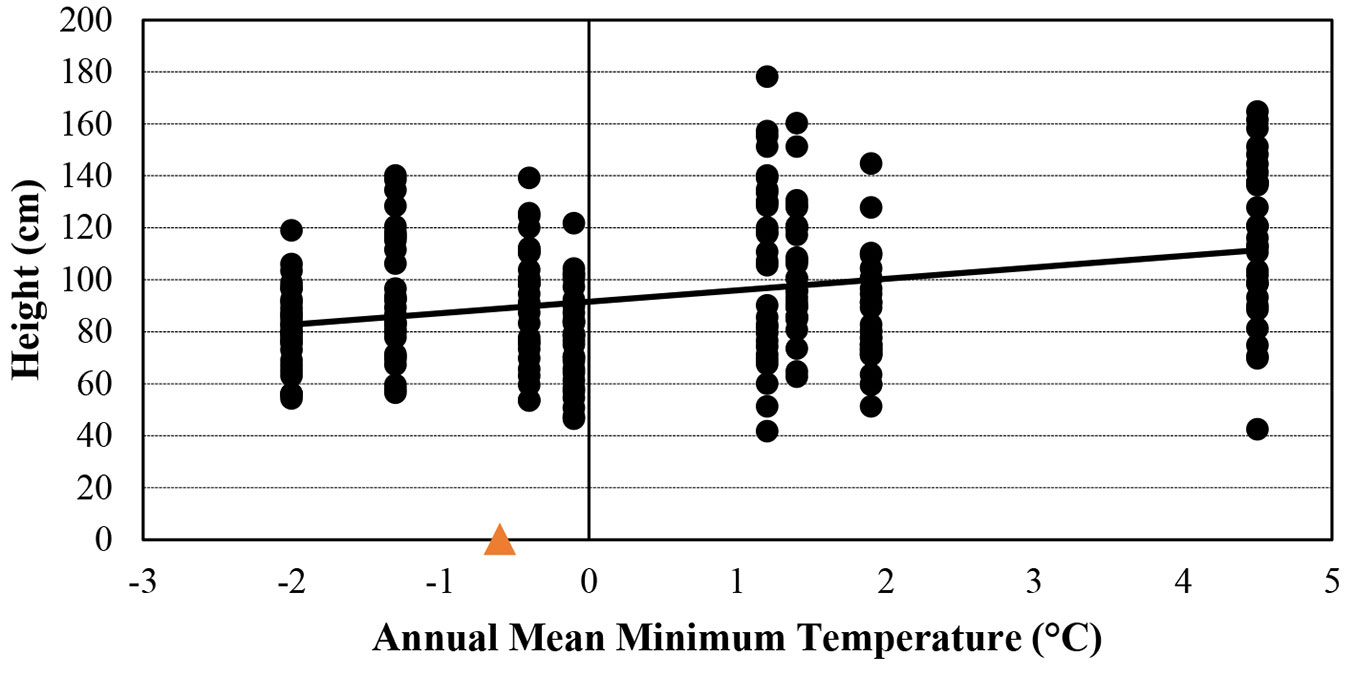
According to t-test results, saplings from populations with sandy clay had higher height and diameter than those from populations with sandy loam (theight = 4.549, p < 0.001; tdiameter = 5.453; p < 0.001). Annual mean maximum temperature was positively correlated with total chl (R = 0.67), chl a (R = 0.74) and chl a+b (R = 0.67, p < 0.05 - Fig. S1 in Supplementary material) and annual mean minimum temperature was positively correlated with height (R = 0.70, p < 0.05 - Fig. 5). Finally, topographic wetness index was negatively correlated with car (R = -0.73) and proline (R = -0.74 -Fig. S2). J. excelsa saplings originating from regions with sandy clay and higher annual mean minimum temperature grew faster than those from regions with sandy loam and lower annual mean temperature. Populations with similar environmental conditions (low annual mean minimum temperature and sandy loam) as at the test site showed a comparatively low height and diameter growth (Fig. 5).
Fig. 5 - Correlation between annual mean minimum temperature (°C) at populations’ origin and height of J. excelsa 10-year-old saplings. The orange triangle indicates the mean annual minimum temperature at the common garden (-0.6 °C).
Total mean precipitation, annual mean temperature, precipitation effectiveness index and altitude had no correlation with growth, photosynthetic pigments and proline (p > 0.05 - Tab. S2 in Supplementary material). No environmental variables were associated with leaf nutrient contents (Tab. S3).
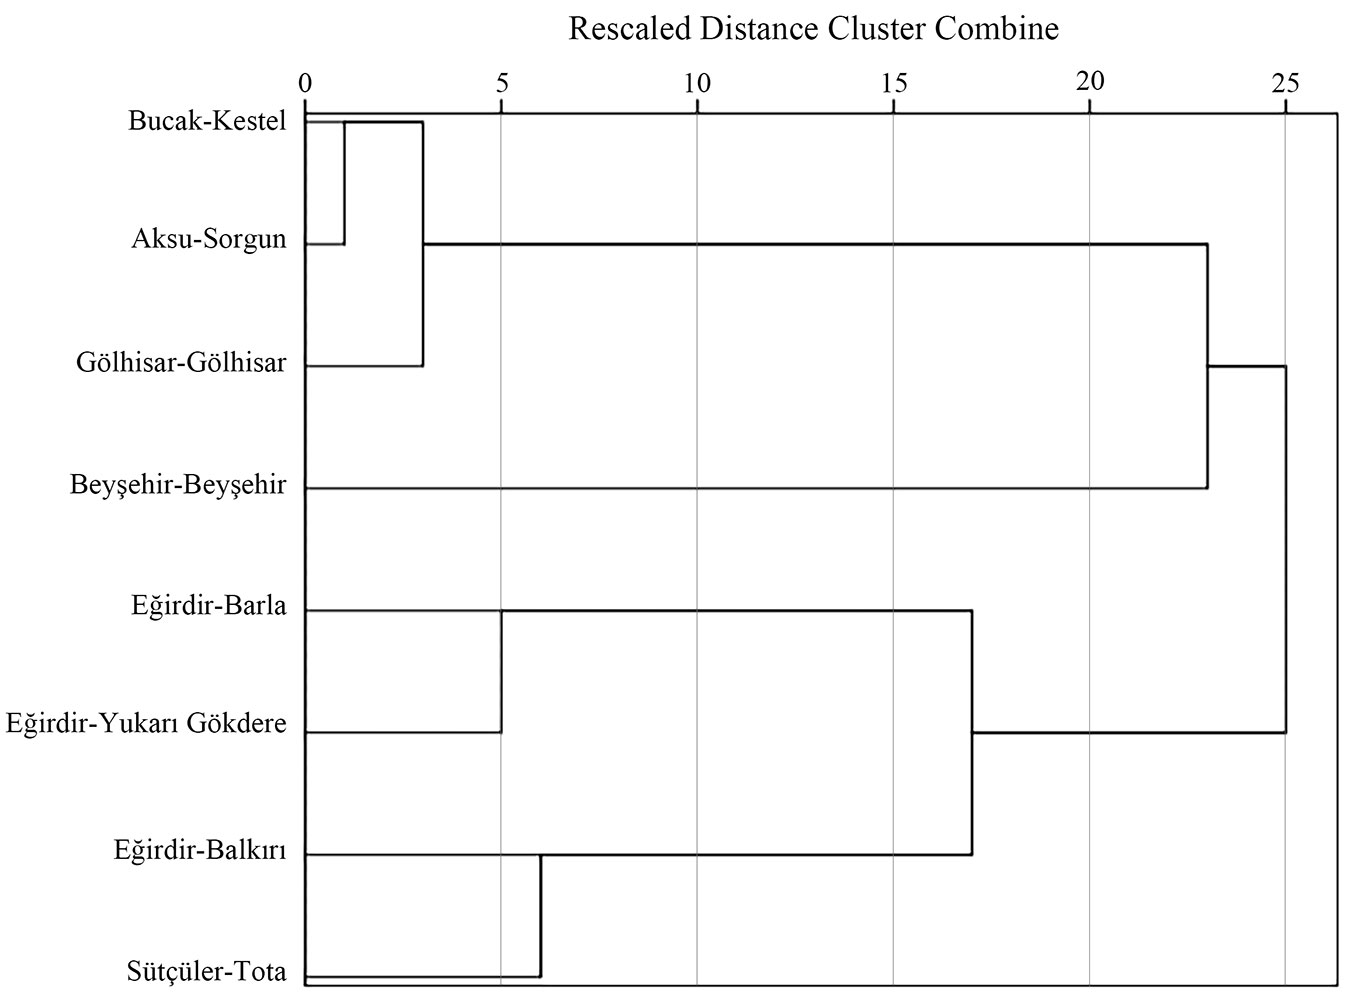
A hierarchical cluster analysis based on averages of all traits was performed to quantify similarities among the populations. This analysis distinguished two main groups at the 25 rescaled distance units, comprising E-Yuk and E-Bar populations in the first group, and A-Sor, G-Göl, B-Kes, E-Bal and S-Tot populations in the second group. The southwestern populations G-Göl and B-Kes grouped together in the hierarchical cluster analysis confirming a weak phylogeographic pattern (Fig. 6). This hierarchical clustering corresponded with the results of Duncan tests relating to photosynthetic pigments, proline and nutrient contents (Tab. 2, Tab. 3).
Fig. 6 - Dendrogram of hierarchical cluster analysis based on averages of all traits.
Discussion
Survival and growth
Survival rate plays an important role in assessing the genetic variability among populations of different geographic origins when facing new environmental conditions ([2]). In the present study, survival rate of all populations ten years after planting was determined as 100%. This value was higher than the findings of Ortel et al. ([35]) stating that one-year-old containerized saplings of J. excelsa obtained from only one population (Egirdir-Çamdag) had a survival rate of more than 82% in the third year of a field experiment in Yalvaç, Isparta that was 150 km away from test site in the current study. These results confirmed that J. excelsa would be successful in the afforestation of dry and cold environments.
In the present study, significant variation in height and diameter was found among eight populations of J. excelsa growing in the Davraz Common Garden test site. E-Bar, S-Tot and E-Yuk populations were above the general averages of height, diameter and volume at age 10 compared to all the other populations. The test site had no similarity in altitude and environmental variables with the E-Bar population but showed a similarity in altitude and climate type with S-Tot population. The mean values of height and diameter of J. excelsa saplings at age 10 were 94.47 cm and 41.6 mm, respectively. Previous studies reported that the mean height of the species’ saplings at age 8 in Burdur afforestation areas ranged from 80 to 151 cm ([10]), and the mean diameter at age 3 in Isparta-Yalvaç afforestation experiment was 8.86 mm ([35]). The reason for the lower height and diameter in the present study may be related to environmental differences between sites (north exposure, high altitude, shallow soil, steep slope at the test site).
E-Bal population (1493 m a.s.l.) can be considered as local population, as its origin was situated closer (about 10 km) to the test site (1500 m) as compared to the other populations, but surprisingly it showed lower growth compared to the mean of populations in terms of height and diameter at age 10. However, E-Bar population, located about 20 km from the test site, from lower altitude (1027 m a.s.l.) with higher annual mean temperature (13.8 °C), had the best performance at age 10 in terms of height, diameter and volume. On the contrary, the height and diameter of 10-year-old saplings from southwestern populations B-Kes and G-Göl (1197 and 1413 m a.s.l., respectively) were generally below the mean of populations at the test site. Boshier & Stewart ([6]) emphasized that as the use of highly fertile nursery soil largely affects differences in growth among provenances as compared to traditional provenance trials, it is hard to conclude on the extent of local adaptation until several years after planting out in the field. In this sense, the results of the current study, 10 years after the establishment of the test site, may potentially already show some patterns of local adaptation.
Due to the complex topography, no pattern of isolation by distance was detected. For example, populations B-Bey and A-Sor, phenotypically similar to each other as reflected in the dendrogram, were geographically close to the other northern populations (S-Tot, E-Bal, E-Bar and E-Yuk), but differentiated at phenotypic traits. Indeed, these two populations are separated by a mountain range (Dedegöl mountain) from the other northern populations and also have lower annual mean minimum temperature. The dendrogram in the present study is similar to that of the earlier study based on allele frequency differences at nuclear microsatellites ([50]). Similarly, Li et al. ([30]) stressed that the barrier effects of mountains contributed to shape population differentiation of Chinese fir (Cunninghamia konishii) in Taiwan.
While there was no correlation of altitude of populations with diameter and height in the current study, both growth traits of 2 and 7-year-old saplings of Picea abies (L.) Karst. in a common garden at 150 m elevation in southern Poland decreased sharply for provenances from higher altitudes ([34]). Similarly, Wilczynski & Kulej ([49]) stated that the mean height of 4-year-old saplings of Abies grandis (D. Don) Lindl. from North America in a provenance trial in Krynica (Polish Carpathian Mts., 700 m a.s.l.) decreased for provenances from higher altitudes. Adaptation to a combination of environmental factors including temperature (see below) is likely related to the observed differences in growth.
The present study revealed that J. excelsa saplings originating from regions with sandy clay and higher annual mean minimum temperature grew faster than those from regions with sandy loam and lower annual mean temperature than at the test site. As the temperature in the region of populations’ origin was higher and thus the vegetation period was longer, saplings from these regions were likely adapted to higher temperatures and a longer growing period might explain their faster growth. Similarly, earlier studies reported that 13-year-old saplings of Fraxinus americana, Betula alleghaniensis, Prunus serotina, Abies balsamea, Larix laricina, Picea glauca, Pinus banksiana and P. strobus ([8]) and 3-year-old saplings of Pseudotsuga menziesii ([28]) from regions with higher annual mean minimum temperature grew better than those from lower annual mean minimum temperature across test sites. Additionally, Chakraborty et al. ([9]) reported that in 24-year-old trees of P. menziesii there was a weak positive correlation between annual mean minimum temperature in the regions of origin of populations and growth.
However, populations from regions with similar environmental conditions (e.g., annual mean minimum temperature and soil texture) as at the test site showed comparatively low height and diameter growth. Likewise, no pattern of isolation by adaptation was detectable by plotting growth differences against environmental differences between the populations’ origins. Thus, it can be concluded from the present study that environmental similarity may not be a good indicator of growth-related traits and stress symptoms (proline and chlorophyll content).
Phytochemical analyses
In J. excelsa, photosynthetic pigments and proline of leaf varied significantly among populations for 10 year-old seedlings. The mean values of chl a (0.297 mg g-1 FW) and b (0.138 mg g-1 FW) in the present study were higher than those of chl a (0.231 mg g-1 FW) and b (0.79 mg g-1 FW) found by Keles & Everest ([23]) for J. excelsa naturally growing at 1500 m a.s.l. between Mersin and Anamur in the Middle Taurus Mountains, southern Turkey. Considering the results of photosynthetic pigments and proline as a whole, it can be concluded that populations were not exposed to severe stress factors at the test site.
In the current study, all nutrient contents of leaves varied among the populations of J. excelsa. Gülser et al. ([17]) also showed that there were significant differences in N, P, Ca, Fe, Mn, Zn, and Cu contents of their leaves (but not in K and Mg) among nine natural populations of J. excelsa in Gevas county in eastern Turkey. Turner et al. ([47]) reported that Mn was significantly different among eight provenances of Pseudotsuga menziesii (Mirb.) Franco in a test site, but no difference for the other nutrients (P, Al, Ca, Mg, K and Na). The nutrient concentration in the leaves of a species mostly relies on the inherent properties of the species and provenances rather than the quantity of nutrients in the soil in which they grow ([22]). The concentrations of N, P, Ca, Mn and Zn in J. excelsa leaves obtained from the present study were in accordance with those reported by Gülser et al. ([17]) in J. excelsa, but the concentrations of K, Mg, Cu and Fe were lower.
In the present study, Zn and Fe in leaves were positively correlated with height and diameter of saplings, respectively. Accordingly, E-Bar and S-Tot populations with the highest diameters also had the highest Zn concentration in their leaves because these nutrients are effective in the photosynthesis process ([52]). Accordingly, height growth was strongly and positively correlated with Zn in the needles of Pinus sylvestris L. ([41]). Although Rout & Sahoo ([38]) indicated that Fe and chlorophyll concentrations are often well correlated in green plants, such a correlation was not found in the present study. N and Mg are associated with chlorophyll biosynthesis, and a deficiency of these elements is responsible for a significant decrease in chlorophyll content in the leaves of Acacia nilotica ssp. indica ([27]). Similarly, the present study showed a positive correlation of chlorophyll content with N and Mg.
Total chl, chl a and chl a+b as an indicator of plant health was positively associated with annual mean maximum temperature at the populations’ origin. This result may result from the adaptations to drought stress of populations from warmer regions. However, Klein et al. ([26]) in Pinus halepensis stated that leaf chlorophyll concentration at the test site had no correlation with climatic conditions at the regions of provenances. These contrasting results may be explained by cardinal temperatures for each plant that control its growth and development ([16]). Proline content in the leaves of J. excelsa saplings from regions with high topographic wetness index was lower than for those with low topographic wetness index at the test site in the current study. Increased concentration of osmolytes such as proline prevents negative effects of dehydration as an adaptation to drought stress. Accordingly, plants for drier regions (low topographic wetness index) have a higher proline content as adaptation to water deprived environments ([3]). Furthermore, both photosynthetic pigments and nutrient contents had no correlation with altitude of populations in this study. In contrast, Keles & Everest ([23]) revealed that the contents of chl a and b decreased in leaves of natural J. excelsa populations from high altitude. Decrease in the contents of chlorophyll may be associated with reductions in photosynthesis at high altitudes as compared with lower altitudes.
Phenotypic differentiation vs. differentiation at neutral markers
Phenotypic differentiation (QST) among J. excelsa populations for growth, photosynthetic pigments and proline ranged from 5% (volume) to 71% (proline). Proline, chl a, chl b and chl a+b showed a very high QST value, potentially indicative of local adaptation. However, QST is possibly overestimated for photosynthetic pigments and proline since the number of samples per population is low due to the comparatively high costs for the phytochemical analyses. Also, the QST values estimated in the present study were considerably higher for most traits than the mean genetic differentiation (FST = 0.03) among J. excelsa populations observed at four randomly selected nuclear microsatellite loci ([50]) suggesting local adaptation across a small geographic scale. However, QST values for height and diameter growth were comparatively low (8% and 11%, respectively). High variation within populations (Fig. 2) indicates a phenotypic plastic response and potentially high genetic variation for growth related traits within populations. Common garden experiments at different sites are needed to evaluate phenotypic plasticity in response to different environments.
Conclusions
The present study is the first to provide variability in growth, photosynthetic pigments, proline and nutrient contents of different J. excelsa populations at a common garden test site. Sapling traits of eight J. excelsa populations from the Lakes District in Turkey at the test site showed that the origin of populations significantly influenced growth, photosynthetic pigments, proline and nutrient contents. E-Bar and S-Tot populations showed the highest performance for the majority of traits at age 10 compared to all other populations. Thus, they are likely the most suitable provenances to these harsh environmental conditions (low annual mean temperature, shallow soil depth, water deprivation, north exposure). Nutrient contents in leaves were generally in the sufficiency range reported for plant growth. QST values in the present study were considerably higher than the mean genetic differentiation among J. excelsa populations observed at four nuclear microsatellite loci, suggesting different local adaptations of populations at a small geographic scale. However, populations from regions with similar environmental conditions as at the test site did not show a faster growth. Thus, it can be concluded from the present study that environmental similarity may not be a good indicator of growth-related traits.
The results of the present study can be useful in the early selection of provenances for J. excelsa for plantation efforts. Further studies should be done in order to assess traits related to drought tolerance such as water use efficiency, photosynthesis rate and stomatal conductance of saplings in the same test site.
List of abbreviations
The following abbreviations have been used throughout the paper:
- QST: Phenotypic trait differentiation
- FST: Genetic differentiation
- Total chl: total chlorophyll
- chl a: chlorophyll a
- chl b: chlorophyll b
- chl a+b: Chlorophyll a+b
- car: carotenoid
- TWI: topographic wetness index
- N: Nitrogen
- P: Phosphorous
- K: Potassium
- Ca: Calcium
- Mg: Magnesium
- Cu: Copper
- Mn: Manganese
- Fe: Iron
- Zn: Zinc
Acknowledgments
We would like to express our thanks to Forest Engineer Suat Altinsoy for the assistance in the establishment of common garden test site, Mr. Ahmet Aydemir and Forest Engineer Sinan Yücedag for the assistance in the measurement of growth traits and in the collection of leaf samples.
References
CrossRef | Gscholar
Online | Gscholar
Gscholar
Gscholar
Gscholar
Gscholar
Gscholar
Gscholar
Gscholar
Gscholar
Gscholar
Gscholar
CrossRef | Gscholar
Authors’ Info
Authors’ Affiliation
Department of Landscape Architecture, University of Burdur Mehmet Akif Ersoy, 15030, Burdur (Turkey)
Department of Landscape Architecture, University of Cankiri Karatekin, Çankiri (Turkey)
Department of Forest Genetics and Forest Tree Breeding, University of Göttingen, Göttingen (Germany)
Center for Integrated Breeding Research (CiBreed), University of Göttingen, Göttingen (Germany)
Corresponding author
Paper Info
Citation
Yücedag C, Çiçek N, Gailing O (2021). Local adaptation at a small geographic scale observed in Juniperus excelsa populations in southern Turkey. iForest 14: 531-539. - doi: 10.3832/ifor3769-014
Academic Editor
Marco Borghetti
Paper history
Received: Jan 29, 2021
Accepted: Sep 21, 2021
First online: Nov 24, 2021
Publication Date: Dec 31, 2021
Publication Time: 2.13 months
Copyright Information
© SISEF - The Italian Society of Silviculture and Forest Ecology 2021
Open Access
This article is distributed under the terms of the Creative Commons Attribution-Non Commercial 4.0 International (https://creativecommons.org/licenses/by-nc/4.0/), which permits unrestricted use, distribution, and reproduction in any medium, provided you give appropriate credit to the original author(s) and the source, provide a link to the Creative Commons license, and indicate if changes were made.

Web Metrics
Breakdown by View Type
Article Usage
Total Article Views: 33024
(from publication date up to now)
Breakdown by View Type
HTML Page Views: 27340
Abstract Page Views: 2800
PDF Downloads: 2278
Citation/Reference Downloads: 3
XML Downloads: 603
Web Metrics
Days since publication: 1687
Overall contacts: 33024
Avg. contacts per week: 137.03
Article Citations
Article citations are based on data periodically collected from the Clarivate Web of Science web site
(last update: Mar 2025)
Total number of cites (since 2021): 5
Average cites per year: 1.00
Publication Metrics
by Dimensions ©
Articles citing this article
List of the papers citing this article based on CrossRef Cited-by.
Related Contents
iForest Similar Articles
Research Articles
Comparison of range-wide chloroplast microsatellite and needle trait variation patterns in Pinus mugo Turra (dwarf mountain pine)
vol. 10, pp. 250-258 (online: 11 February 2017)
Research Articles
Predicting the impacts of climate change on the distribution of Juniperus excelsa M. Bieb. in the central and eastern Alborz Mountains, Iran
vol. 11, pp. 643-650 (online: 04 October 2018)
Research Articles
Genetic diversity of core vs. peripheral Norway spruce native populations at a local scale in Slovenia
vol. 11, pp. 104-110 (online: 31 January 2018)
Research Articles
A comparative study of growth and leaf trait variation in twenty Cornus wilsoniana W. families in southeastern China
vol. 10, pp. 759-765 (online: 02 September 2017)
Research Articles
Genetic control of intra-annual height growth in 6-year-old Norway spruce progenies in Latvia
vol. 12, pp. 214-219 (online: 25 April 2019)
Research Articles
Juvenile growth response of European beech (Fagus sylvatica L.) to sudden change of climatic environment in SE European trials
vol. 2, pp. 213-220 (online: 22 December 2009)
Research Articles
Preliminary study on genetic variation of growth traits and wood properties and superior clones selection of Populus ussuriensis Kom.
vol. 12, pp. 459-466 (online: 29 September 2019)
Research Articles
Patterns of genetic variation in bud flushing of Abies alba populations
vol. 11, pp. 284-290 (online: 13 April 2018)
Research Articles
Seedling emergence capacity and morphological traits are under strong genetic control in the resin tree Pinus oocarpa
vol. 17, pp. 245-251 (online: 16 August 2024)
Research Articles
Genetic variation and heritability estimates of Ulmus minor and Ulmus pumila hybrids for budburst, growth and tolerance to Ophiostoma novo-ulmi
vol. 8, pp. 422-430 (online: 15 December 2014)
iForest Database Search
Search By Author
Search By Keyword
Google Scholar Search
Citing Articles
Search By Author
Search By Keywords
PubMed Search
Search By Author
Search By Keyword


