Evergreen species response to Mediterranean climate stress factors
iForest - Biogeosciences and Forestry, Volume 9, Issue 6, Pages 946-953 (2016)
doi: https://doi.org/10.3832/ifor1848-009
Published: Jul 07, 2016 - Copyright © 2016 SISEF
Research Articles
Collection/Special Issue: IUFRO RG7.01.00 - Nice (France 2015)
Global Challenges of Air Pollution and Climate Change to Forests
Guest Editors: Elena Paoletti, Pierre Sicard
Abstract
Recent climatic projections predict a decline in rainfall mainly during the summer period and an increase in air temperature for the Mediterranean basin, resulting in extended periods of soil water deficit. Mediterranean evergreen species attain drought resistance through different traits or combination of traits. The main objective of this research is to analyze the response of the evergreen species co-occurring in the Mediterranean maquis to variations in water availability and air temperature during the year. The results show that leaf structural traits significantly affect physiological traits as confirmed by the Partial Least Squares Regression analysis (PLS). In particular, the considered species have a similar leaf respiration (RL) trend during the year with the lowest rates in winter (mean 0.95 ± 0.44 µmol m-2 s-1) and the highest in drought (mean 3.05 ± 0.96 µmol m-2 s-1). Nevertheless, a different RL effect on gross photosynthesis (PG) during drought was observed. C. incanus, E. multiflora, R. officinalis and S. aspera have the highest RL/PG ratio (mean 0.54 ± 0.08), while Q. ilex, P. latifolia, P. lentiscus, A. unedo and E. arborea have the lowest (mean 0.22 ± 0.07). RL/PG ratio variations depend on the sensitivity of both the two parameters to drought. Considering the increase of the length and intensity of drought in the Mediterranean basin, and that the photosynthesis of Mediterranean evergreen species is frequently limited by sub-optimal conditions (i.e., water deficit, high light intensity and high air temperature), it is important to improve knowledge on RL, since it has a critical function in modulating carbon balance of Mediterranean species.
Keywords
Global Climate Change, Mediterranean Evergreen Species, Net Photosynthesis, Gross Photosynthesis, Leaf Respiration
Introduction
The projected global climate warming could affect a wide range of species and ecosystems ([25]). Considering that the implications of global climate change are characterized by strong latitudinal variations ([27]), regional studies are recommended to provide an essential tool for scientists and decision-makers ([18]). The Mediterranean basin is especially vulnerable to climate change ([19]). Due to its unique geographic location, this region is a transitional zone between the very hot and dry African climate in the South and the mild and humid European climate in the North ([19]). Recent climatic projections for the Mediterranean basin predict an air temperature increase and a decline in rainfall mainly during summer ([27]). Moreover, the Mediterranean basin undergoes more prolonged dry periods than in the past. This produces a negative soil water balance as the amount of water that evaporates overcomes the amount of water intercepted by soil through rainfall and summer humidity ([8], [33]). The Mediterranean basin is characterized by a high plant diversity of growth forms, habits and phenology ([17]). In particular, physiological adaptations involve regulation of the water status by stomatal control ([23]). Morphological and anatomical adaptations involve leaf protective structures (i.e., hairs, thick cuticle, sclerenchymatic cells), steep leaf inclination, low leaf surface area ([9], [29], [21]) and a high stomatal density of small size ([39], [23]). Such traits improve drought resistance by decreasing photochemical damage of the photosynthetic apparatus and limiting leaf transpiration ([9]). Among the Mediterranean species, the sclerophyllous have a high construction cost of their leaf protective structures (i.e., high leaf consistency) and a long leaf longevity ([20]), while the semi-deciduous species have a lower leaf consistency and a shorter leaf longevity. Moreover, they have leaf morphological and anatomical differences between summer and winter leaves ([10]). Leaf longevity may be a source of variation in the relationship among the different leaf traits ([37]). Nevertheless, if the dry season lasts too long, water deficit may negatively affect Mediterranean evergreen species carbon assimilation, as a result of the lowest photosynthetic rates and leaf surface areas produced ([35]). Thus, plant survival in Mediterranean environments depends largely upon their capacity to photosynthesize and keep water loses lower than the supply. It is important to take into account the key role of leaf respiration when plants experience intense drought periods, since it has a critical function in modulating carbon balance ([45]). The effects of leaf respiration on gross photosynthesis, particularly under drought conditions ([16]) may allow more reliable climate change scenarios of ecosystem functioning.
In this context, the main goal of our research was to analyze the response of the evergreen species co-occurring in the Mediterranean maquis to seasonal variations in water availability and air temperature during the year. In particular, the effects of leaf respiration on gross photosynthesis were considered. The Mediterranean maquis is largely distributed in areas around the Mediterranean Basin and its structure and composition is strongly influenced by air temperature and water availability ([24]).
Material and methods
Study area and plant materials
The study was carried out in the period January - December 2014 in the Mediterranean maquis inside the Presidential Estate of Castelporziano (SSW of Rome, Italy; 4° 45′ N, 12° 26′ E - ⇒ http://palazzo.quirinale.it/residenze/c_porziano_en.html).
The Presidential Estate of Castelporziano is included in the “Natura 2000’’ network and is classified as a ZPS (Special Protection Area, “Tenuta Presidenziale”, IT603 0084) and a SIC (Sites of Community Importance) with two areas: “Querceti igrofili” (IT6030028) and “Fascia costiera” (IT6030027). The maquis under study was characterized by the presence of the following species: Arbutus unedo L., Phillyrea latifolia L., Pistacia lentiscus L., Quercus ilex L. (typical sclerophyllous species), Cistus incanus L. (drought semi-deciduous species), Erica arborea L., Erica multiflora L., Rosmarinus officinalis L. (narrow-leaves species), and Smilax aspera L. (liana - [20]).
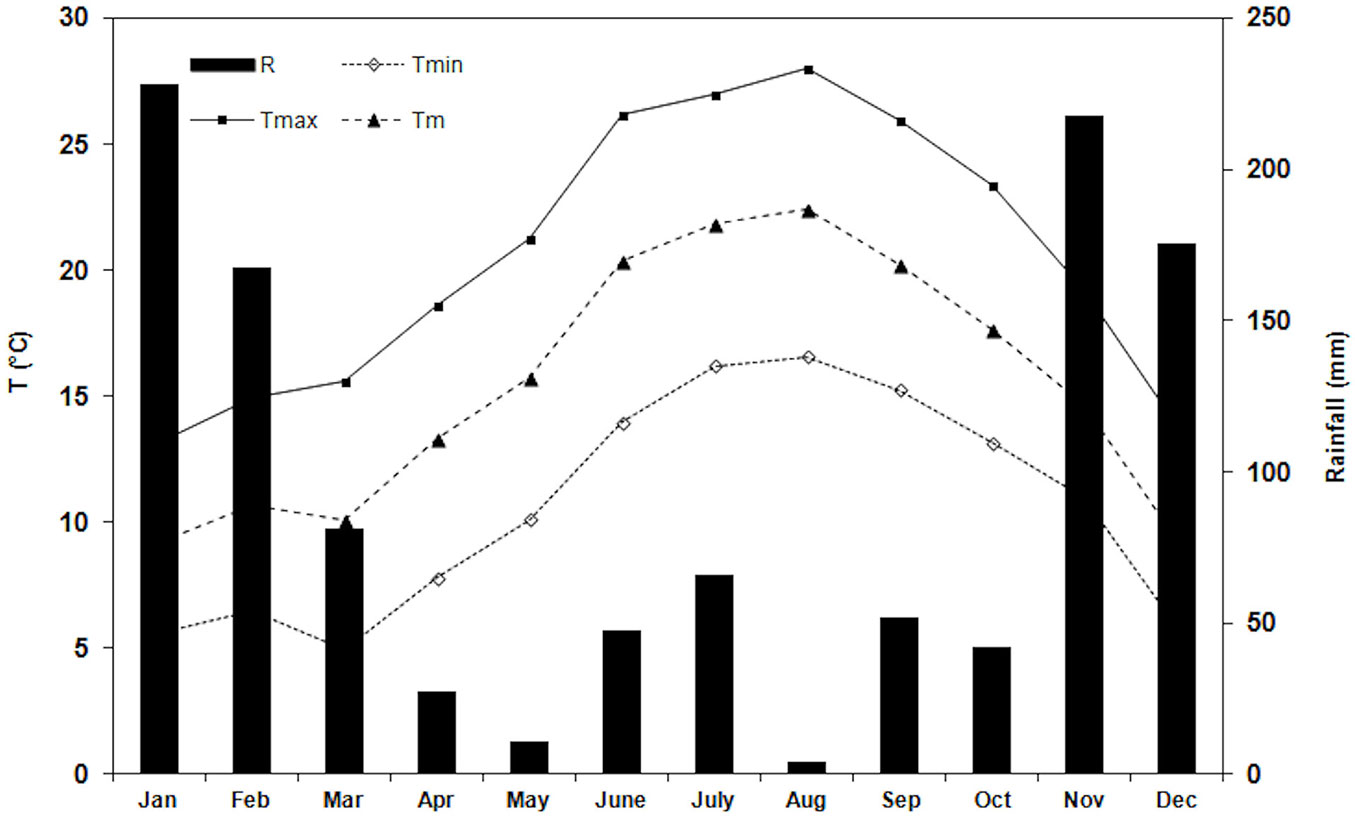
The climate of the area is Mediterranean, with the mean minimum air temperature (Tmin) of the coldest months (February) of 3.7 ± 1.8 °C (mean ± SD), the mean maximum air temperature (Tmax) of the hottest months (August) 30.3 ± 1.4°C, and the mean yearly air temperature (Tm) 15.6 ± 5.9 °C. Total annual rainfall is 738 mm, mainly occurring in autumn and winter. Drought period is from the end of May to the beginning of September (60 mm in the period). During the study period, Tmin of the coldest month (March) was 5.0 ± 2.1°C, Tmax of the hottest month (August) 28.0 ± 2.4°C and the total rainfall during the drought period (from the end of July to the end of August) was 15 mm (Fig. 1). Weather and climate data (1985-2014) were obtained from the Meteorological Station located inside the Estate.
Fig. 1 - Monthly trend of air temperatures and total monthly rainfall during the study period (January - December 2014); (R): total monthly rainfall (Tmin): minimum air temperature; (Tmax): maximum air temperature; (Tm): mean air temperature.
Structural, morphological, anatomical and physiological leaf traits were measured on twelve representative shrubs per each of the considered species, randomly distributed in three representative areas (100 m2 each). Mature leaves were detached from the southern, upper portion of each shrub at the end of May 2014 for measurements.
Structural shrubs traits
Measurements of shrub structure included total height (HS, defined as the maximum vertical distance from the ground to the highest point of the shrub), height of the shrub crown (Ch, defined as the vertical distance from the lowest leaf insertion to the highest point of the shrub), depth of the shrub crown (CD, excluding the central non-foliated branch portion, according to [41]), major axis (A) and minor axis (a, orthogonal to A) of the shrub crown. Shrub volume (VS) was derived from the measured traits, by assigning simple geometric solids to shrub form, such as cone, semisphere and ellipsoid which appeared to give the best fit of the natural shape of the crown, according to Sternberg & Shoshany ([43]); the volume of the shrub crown (Vcrown) was calculated excluding the central non-foliated branch portion of shrub. For S. aspera was measured the length (ls).
Anatomical leaf traits
The following parameters were considered for leaf anatomical measurements (n = 3 leaves per shrub per species): total leaf lamina thickness (LT); palisade and spongy thickness; thickness of the upper and lower cuticle and epidermis (CET, µm). Measurements were restricted to vein-free areas. The fraction of mesophyll volume occupied by the intercellular air spaces (fias, %) was calculated according to Syvertsen et al. ([42]) as follows (eqn. 1):
where Am is the cross-sectional area of the mesophyll cell, W the width of the measured section and l is the mesophyll thickness.
The following parameters were measured for stomata: guard cell length and width (LA and WB, respectively), according to Stojnić et al. ([44]), and the stomatal pore surface of stomata guard cell (SPSLAWB, µm2), according to Balasooriya et al. ([7]) as (eqn. 2):
The potential conductance index (PCI) was calculated according to Holland & Richardson ([26]), as follows (eqn. 3):
where SD is the stomatal density (stomata mm-2), measured from nail varnish impressions of the inferior lamina, according to Sack et al. ([40]), each of them 0.5 × 1.0 cm, obtained by a Zeiss Axiocam MRc 5® digital camera (Carl Zeiss, Jena, Germany), equipped with the software Axiovision AC® (release 4.5).
Morphological leaf traits
The following parameters were measured for leaf morphological measurements (n = 5 leaves per shrub per species): projected fresh leaf surface area excluding petioles (LA, cm2), obtained by the Image Analysis System® (Delta-T Devices, Burwell, UK) and leaf dry mass (DM, mg), drying leaves at 80 °C to constant mass.
Leaf mass per unit leaf area (LMA, mg cm-2) was calculated by the ratio of DM and LA and leaf tissue density (LTD, mg cm-3) by the ratio of LMA and total lamina thickness.
Gas exchange
Gas exchange measurements were carried out using an infrared gas analyzer (LCPro+®, ADC Bioscientific Ltd., Hoddesdon, UK) equipped with a conifer leaf chamber (PLC, Parkinson Leaf Chamber) for E. arborea, E. multiflora and R. officinalis, and with a broad leaf chamber (PLC) for Q. ilex, A.unedo, C. incanus, P. latifolia, P. lentiscus and S. aspera. Measurements were taken on fully expanded sun leaves (n = 6 per each sampling occasion for A. unedo, C. incanus, P. latifolia, P. lentiscus, Q. ilex, and S. aspera) and on sun apical shoots (n= 6 per each sampling occasion for E. arborea, E. multiflora and R. officinalis). Net photosynthetic rate (PN, µmol CO2 m-2 s-1), stomatal conductance (gs, mol H2O m-2 s-1), leaf transpiration (E, mmol H2O m-2 s-1), sub-stomatal CO2 concentration (Ci, μmol CO2 mol-1 air), leaf temperature (Tl, °C) and photosynthetic photon flux density (PPFD, µmol photons m-2 s-1) were measured from 9.00 to 11.00 a.m., under natural conditions, on cloud-free days (PPFD > 1000 µmol m-2 s-1, saturating level) to ensure that the near maximum daily photosynthetic rates were measured ([38]). The apparent carboxylation efficiency of Rubisco (PN/Ci, mol CO2 m-2 s-1) was determined according to Arena et al. ([2]).
Leaf dark respiration rate (RL, µmol CO2 m-2 s-1) measurements were carried out contemporary to photosynthesis measurements, by darkening the leaf chamber with a black paper for 30 min prior to each measurement to avoid transient post-illumination bursts of CO2 releasing. Measurements were carried out in four sampling days with the same weather conditions for each month.
Gross photosynthetic rates (PG, µmol CO2 m-2 s-1) were calculated as the sum of the average values for PN, photorespiration and RL, based on the assumption that RL (excluding photorespiration) were similar in the light and in the dark ([46]). Photorespiration rates (Pr, µmol CO2 m-2 s-1) were evaluated considering that under natural conditions C3 plants lose about 20% of the photosynthetically acquired CO2 in the form of photorespiratory CO2 ([30]). Total yearly PN and RL (PNy and RLy, respectively) were calculated on the basis of the daily photosynthetic and respiratory activity, according to Van Iersel ([46]), extending data over the whole year. The ratio RL/PG was calculated according to Chastain et al. ([14]). Total yearly PG (PGy) and the fraction of total yearly RLy on PGy (RLy/PGy) were also calculated.
Leaf water status
Leaf water potential at pre-dawn (Ψpd) was measured on leaves of A. unedo, C. incanus, P. latifolia, P. lentiscus, Q. ilex, and S. aspera and on shoots of E. arborea, E. multiflora, R. officinalis (five leaves and five apical shoots per species, respectively, per each sampling occasion). Ψ measurements were carried out using a portable pressure chamber (SKPM 1400®, Skye Instruments, Llandrindod Wells, Powys, UK). Relative water content at pre-dawn (RWCpd) was calculated at the same time and on the same leaves used for Ψ measurements as (eqn. 4):
where FM is the leaf fresh mass, DM the leaf mass after drying at 90 °C until constant mass was reached, and TM the leaf mass after rehydration until saturation for 48 h at 5 °C in the darkness ([6]). Ψpd and RWCpd measurements were carried out in April and May (during the favorable period) and in August (during drought), simultaneously with gas exchange measurements.
Statistical analysis
All statistical tests were performed using the software package Statistica® v. 10.0 (Statsoft Inc., Tulsa, OK, USA).
The differences in physiological leaf traits were determined by the analysis of variance (ANOVA) and the post-hoc Tukey’s test for multiple comparisons (α ≤ 0.05). Data were tested for normality and homogeneity of variances before carrying out the statistical analysis, with α ≤ 0.05.
A Partial Least Squares Regression analysis (PLS) was carried out to explore the pattern of co-variation between morphological and physiological leaf traits and to establish the order of the variable importance (i.e. VIP). PLS was carried out using the structural leaf traits (LMA, LTD, LT, CET, PCI and fias) as predictor variables and physiological traits (PN, RL, RL/PG, Ψ and RWC) as the response variables.
Results
Structural shrub traits
Structural shrub traits of the considered species are shown in Tab. 1. In particular, among the species analyzed, E. arborea showed the highest HS (1.72 ± 0.24 m) and C. incanus the lowest (0.76 ± 0.11 m). Q. ilex was the species with the highest VS and Vcrown values (7.16 ± 5.20 m3 and 2.72 ± 1.24 m3, respectively), while C. incanus the lowest ones (0.32 ± 0.24 m3 and 0.20 ± 0.12 m3, respectively).
Tab. 1 - Mean values and standard deviation of shrub height (Hs, m), shrub volume (VS, m3) and volume of shrub crown (Vcrown, m3) in the considered species (n =12).
| Species | Hs (m) |
Vs (m3) |
Vcrown (m3) |
|---|---|---|---|
| A.unedo | 1.01 ± 0.22 | 1.58 ± 1.41 | 0.59 ± 0.43 |
| C.incanus | 0.76 ± 0.11 | 0.32 ± 0.24 | 0.20 ± 0.12 |
| E. arborea | 1.72 ± 0.24 | 3.55 ± 1.27 | 1.74 ± 0.75 |
| E. multiflora | 0.85 ± 0.23 | 1.24 ± 0.75 | 0.38 ± 0.23 |
| P.latifolia | 1.32 ± 0.31 | 1.77 ± 0.84 | 0.48 ± 0.25 |
| P.lentiscus | 0.90 ± 0.13 | 0.60 ± 0.46 | 0.22 ± 0.10 |
| Q.ilex | 1.45 ± 0.32 | 7.16 ± 5.20 | 2.72 ± 1.24 |
| R.officinalis | 0.87 ± 0.18 | 1.48 ± 1.35 | 0.85 ± 0.55 |
| S.aspera | 1.50 ± 0.40 | - | - |
Anatomical and morphological leaf traits
E. arborea showed the lowest LT (200 ± 19 µm), followed by C. incanus (217 ± 9 µm), P. lentiscus (254 ± 18 µm), A. unedo (300 ± 20 µm), Q. ilex, P. latifolia and S. aspera (316 ± 5 µm, mean value) and by R. officinalis and E. multiflora (335 ± 7 µm).
CET was the highest in P. latifolia (43 ± 3 µm), followed by E. multiflora (41 ± 2 µm), A. unedo (35 ± 4 µm), E. arborea and R. officinalis (26 ± 3 µm, mean value), S. aspera (25 ± 2 µm), Q. ilex (22 ± 1 µm), P. lentiscus (16 ± 2 µm) and C. incanus (14 ± 2 µm).
A. unedo and C. incanus showed the highest fias (37 ± 1 %, mean value), followed by P.lentiscus, Q. ilex and P. latifolia (31 ± 3 %, mean value), R. officinalis, E. multiflora and E. arborea (26 ± 1 %, mean value) and S. aspera (15 ± 3%).
SPSLAWB and PCI varied significantly among the considered species (Tab. 2), P. latifolia having the highest SPSLAWB (574 ± 96 µm2) and E. arborea the lowest one (155 ± 21 µm2). Q. ilex had the highest PCI (31.2 ± 3.0) while R. officinalis, E. multiflora and E. arborea the lowest (6.0 ± 0.5, mean value).
Tab. 2 - Mean values and standard deviation of stomatal pore surface of stomata guard cell (SPSLAWB, μm2) and potential conductance index (PCI) in the considered species (n = 36). Mean values with the same letters are not significantly different after Tukey’s test (P ≥ 0.05).
| Species | SPSLAWB (µm2) |
PCI
|
|---|---|---|
| A.unedo | 428 ± 50 a | 18.2 ± 2.8 a |
| C.incanus | 207 ± 47 c | 7.8 ± 2.0 d |
| E. arborea | 155 ± 21 c | 6.0 ± 0.8 d |
| E. multiflora | 238 ± 20 c | 6.5 ± 0.7 d |
| P.latifolia | 574 ± 96 b | 23.5 ± 4.0 b |
| P.lentiscus | 242 ± 25 c | 15.4 ± 1.6 a |
| Q.ilex | 389 ± 56 a | 31.2 ± 3.0 c |
| R.officinalis | 219 ± 47 c | 5.5 ± 1.4 d |
| S.aspera | 400 ± 45 a | 9.2 ± 1.4 d |
Morphological leaf traits varied significantly among the considered species (Tab. 3). In particular, LMA value ranged from 26.3 ± 1.7 mg cm-2 (E. multiflora) to 12.0 ± 1.1 mg cm-2 (E. arborea) and LTD from 760 ± 23 mg cm-3 (E. multiflora) to 355 ± 32 mg cm-3 (S. aspera).
Tab. 3 - Mean values and standard deviations of leaf mass per area (LMA, mg cm-2) and leaf tissue density (LTD, mg cm-3) in the considered species (n = 60). Mean values with the same letters are not significantly different after Tukey’s test (P ≥ 0.05).
| Species | LMA (mg cm-2) |
LTD (mg cm-3) |
|---|---|---|
| A. unedo | 15.8 ± 0.6 c | 419 ± 20 b |
| C. incanus | 15.1 ± 0.7 bc | 580 ± 16 e |
| E. arborea | 12.0 ± 1.1 a | 510 ± 12 c |
| E. multiflora | 26.3 ± 1.7 f | 760 ± 23 f |
| P. latifolia | 20.1 ± 1.2 de | 515 ± 18 c |
| P. lentiscus | 18.9 ± 1.0 de | 548 ± 25 d |
| Q. ilex | 20.4 ± 1.1 e | 622 ± 16 f |
| R. officinalis | 20.8 ± 0.6 de | 580 ± 15 e |
| S. aspera | 13.9 ± 0.8 b | 355 ± 32 a |
Gas exchange
The considered species had the same RL trend during the year. The lowest rates were measured in winter (January-February: 0.95 ± 0.44 μmol m-2 s-1, mean value) and the highest in August (3.05 ± 0.96 μmol m-2 s-1, mean value). In particular, R. officinalis had the highest RL in August (4.5 ± 1.6 μmol m-2 s-1) and P. latifolia the lowest (1.58 ± 0.05 μmol m-2 s-1).
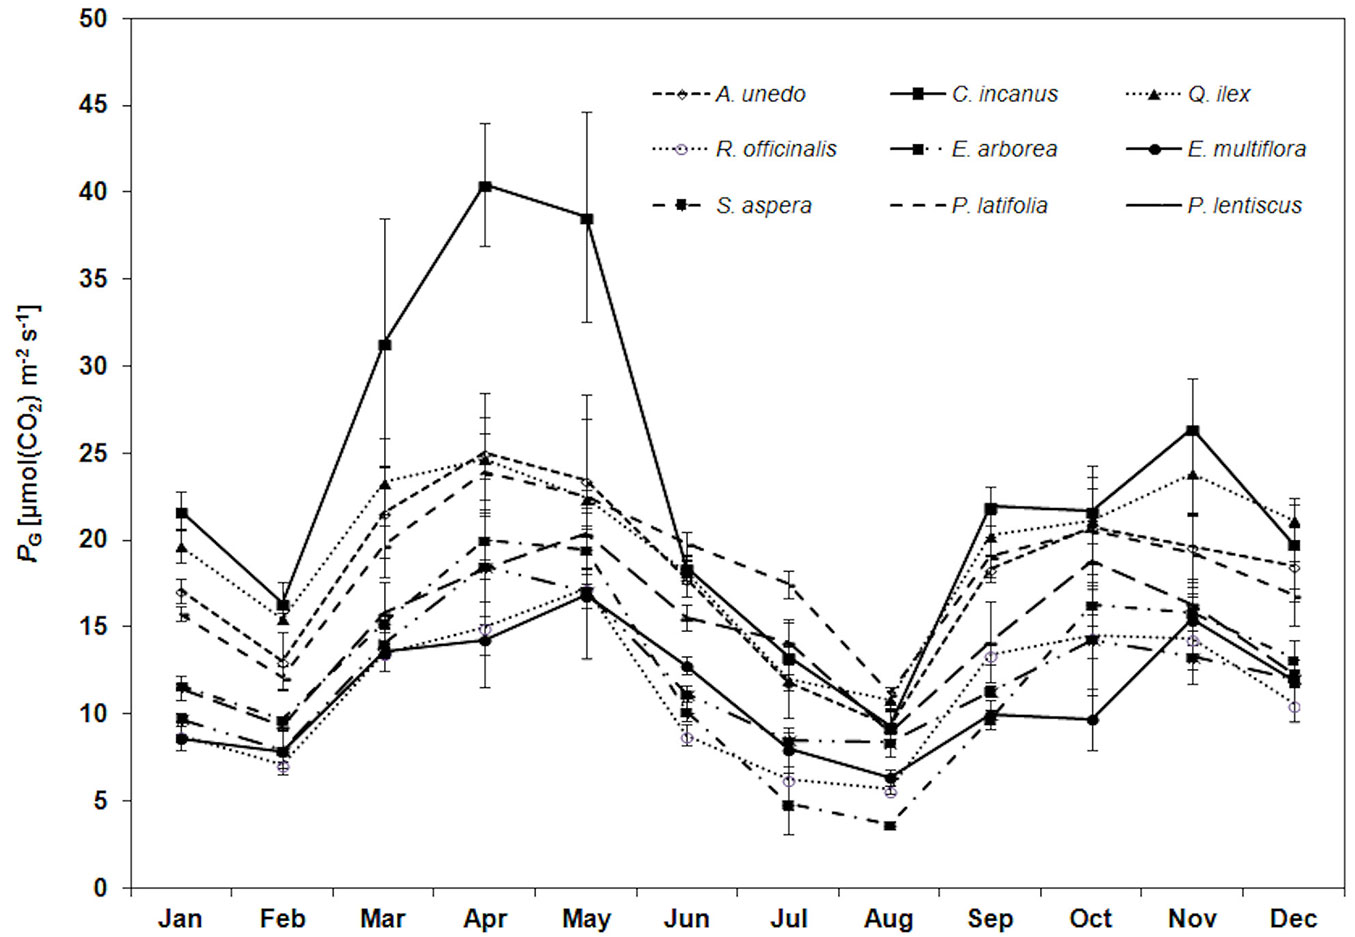
The species analyzed shared the same PG trend during the year (Fig. 2), though some differences were observed. A relatively low PG value (12.4 ± 4.3 μmol m-2 s-1, mean value) was monitored in winter (January-February), R. officinalis having the lowest rate (7.9 ± 1.2 μmol m-2 s-1) and C. incanus the highest (19.0 ± 3.7 μmol m-2 s-1). The highest PG (22.0 ± 7.1 μmol m-2 s-1, mean value) was measured in April-May, C. incanus having the highest PG (39.5 ± 1.3 µmol m-2 s-1), followed by A. unedo, Q. ilex, P. latifolia and P. lentiscus (22.6 ± 7.7 µmol m-2 s-1, mean value), S. aspera, R. officinalis, E. multiflora and E. arborea (17.3 ± 2.0 µmol m-2 s-1, mean value). A 61% PG decrease (mean value) than the spring maximum was monitored in August (i.e., during drought), with C. incanus and S. aspera having the highest PG decrease (79%, mean value) and P. latifolia the lowest (46%). After the first rainfall, at the beginning of September, PG increased, on average, by 92%, S. aspera having the highest increase (> 100%).
Fig. 2 - Trend of leaf gross photosynthesis (PG, µmol CO2 m-2 s-1) during the study period for the considered species. Each point is the mean value of four sampling days per months (n = 24). Mean values (points) and standard deviation (error bars) are shown.
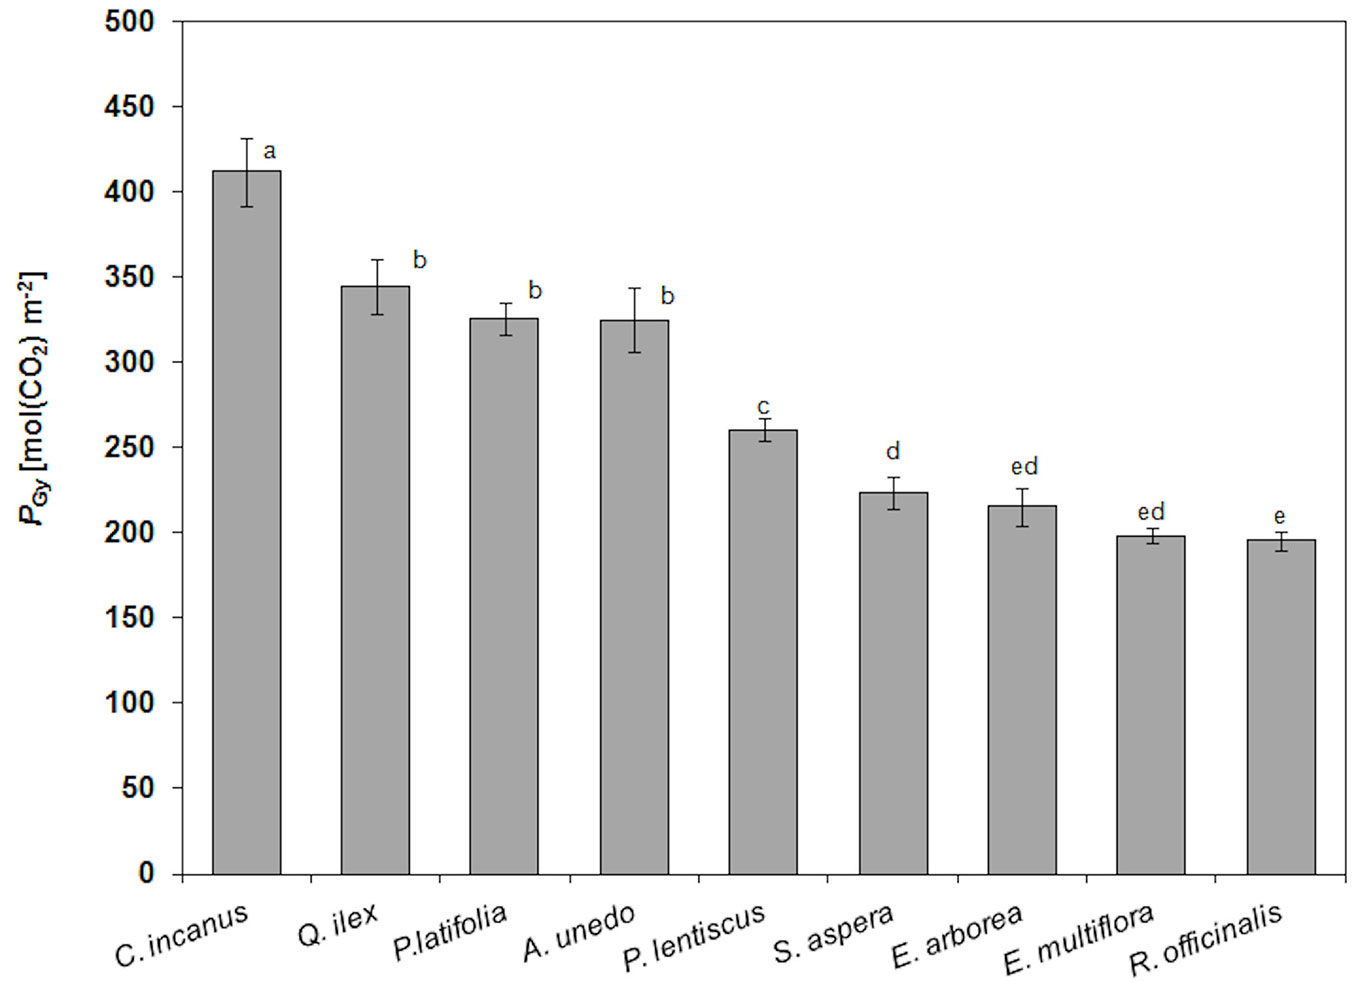
PGy for the considered species are shown in Fig. 3. In particular, C. incanus showed the highest PGy (412 ± 20 mol m-2), followed by Q. ilex, A. unedo, P. latifolia and P. lentiscus (314 ± 37 mol m-2, mean value), S. aspera, E. arborea, E. multiflora and R. officinalis (208 ± 13 mol m-2, mean value). The ratio RLy/PGy was the highest in R. officinalis (28%), followed by E. multiflora and E.arborea (16%), C. incanus (13%), S .aspera (12%), Q. ilex, P. latifolia and P. lentiscus (11%, mean value) and A. unedo (5%).
Fig. 3 - Mean values and standard deviation (error bars) of yearly gross photosynthesis (PGy, mol CO2 m-2) in the considered species (n= 12). Mean values with the same letters are not significantly different after Tukey’s test (P ≥ 0.05).
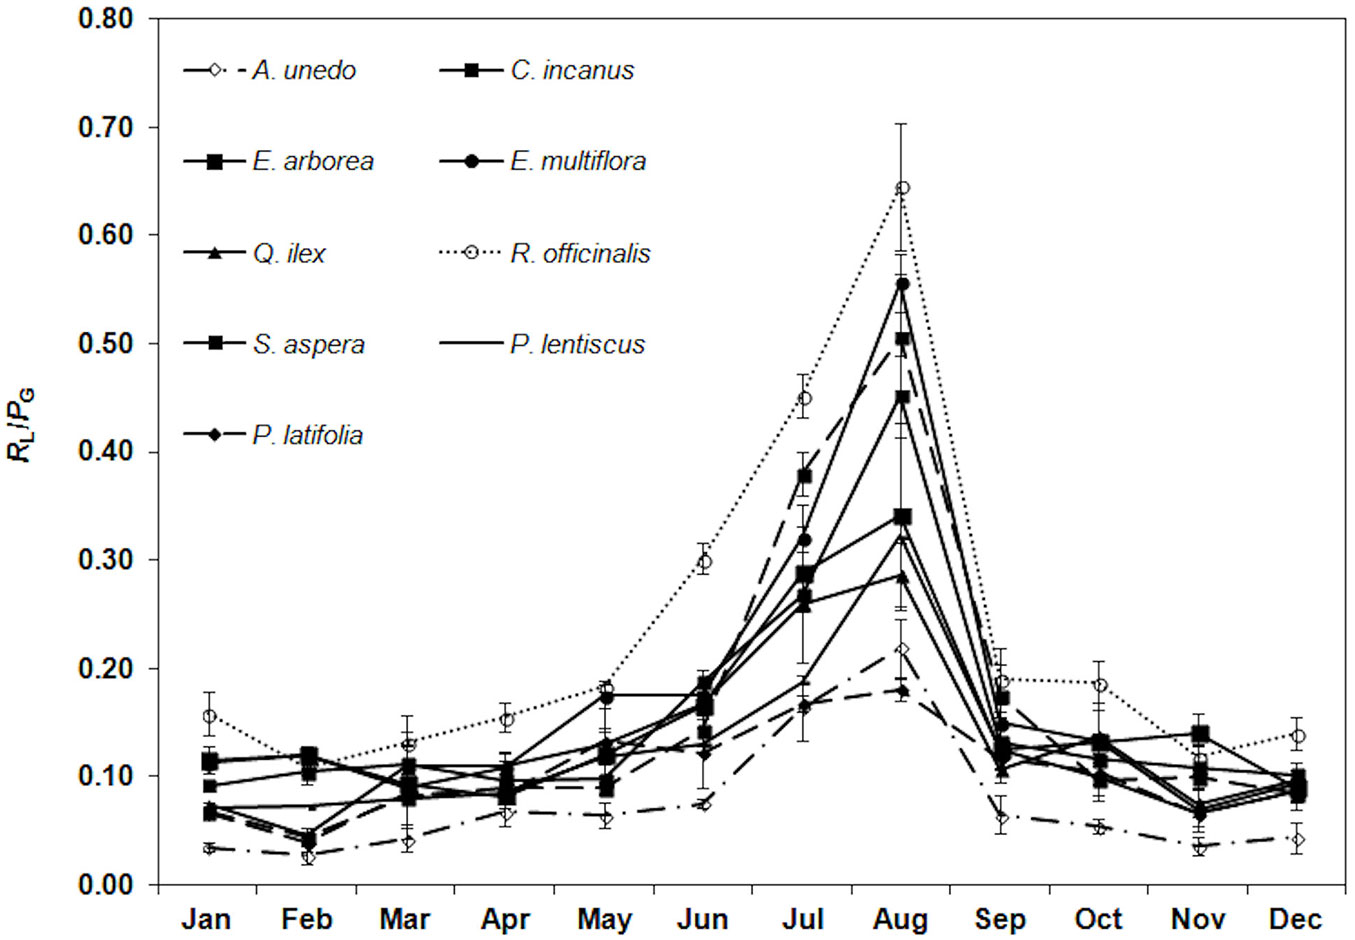
Among all the species, the lowest RL/PG ratio (0.07 ± 0.03, mean value) was monitored in winter and the highest in August (0.40 ± 0.15, mean value). R. officinalis had the highest ratio (0.65 ± 0.06) and A. unedo the lowest (0.22 ± 0.03 - Fig. 4).
Fig. 4 - Trend of the ratio of leaf respiration to gross photosynthesis (RL/PG) during the study period. Each point is the mean value of four sampling days per months (n = 24). Error bars represent the standard deviation.
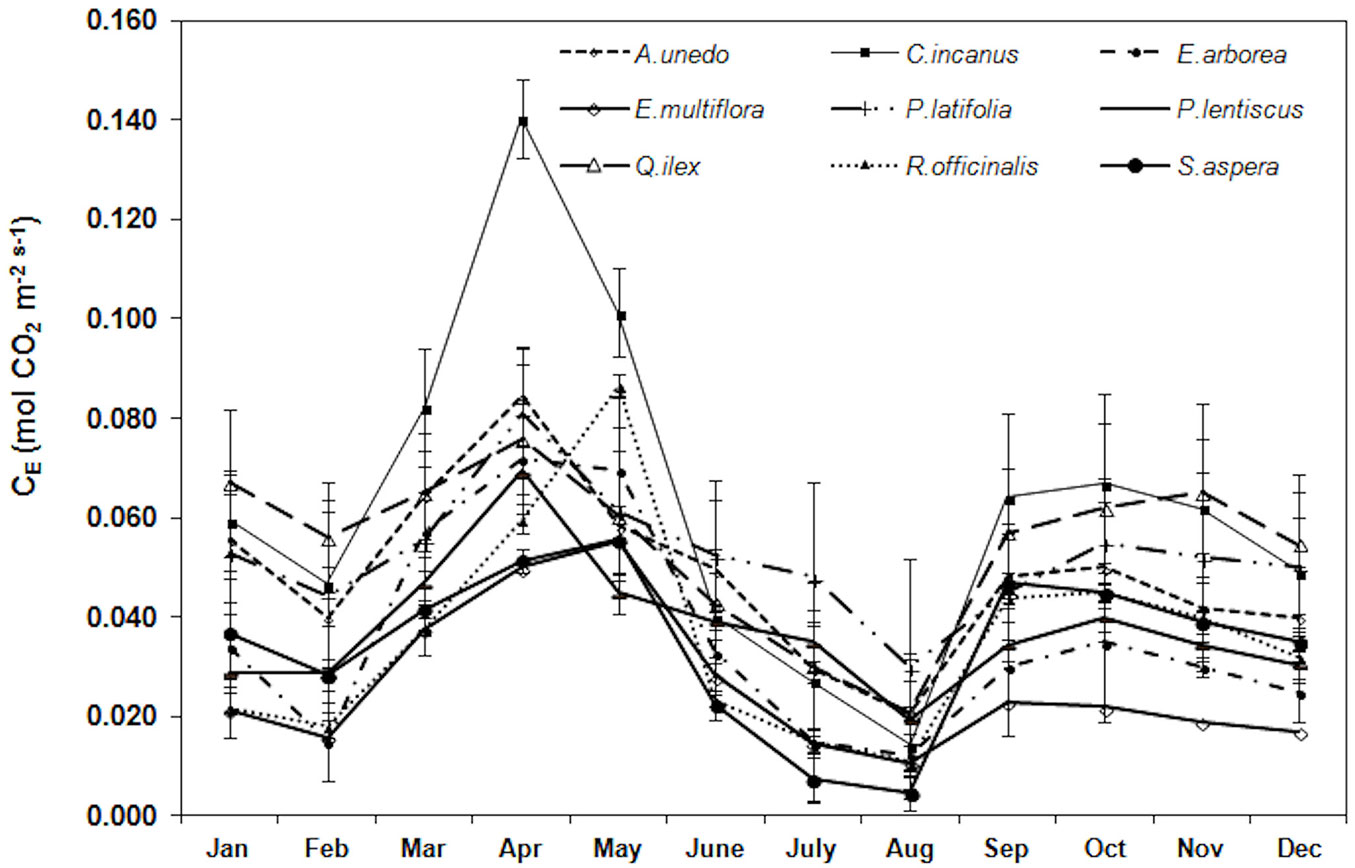
Trend of apparent carboxylation efficiency is reported in Fig. 5. During the study period, the highest CE was monitored, in all the considered species, in April-May (0.080 ± 0.025 mol m-2 s-1, mean value) and the lowest in August (0.016 ± 0.007 mol m-2 s-1, mean value). The mean yearly CE value was the highest in C. incanus (0.063 ± 0.034 mol m-2 s-1) and the lowest in E. multiflora (0.026 ± 0.014 mol m-2 s-1).
Fig. 5 - Trend of the apparent carboxylation efficiency (CE, mol CO2 mol-1 CO2) during the study period. Each point is the mean value of four sampling days per months (n = 24). Error bars represent the standard deviation.
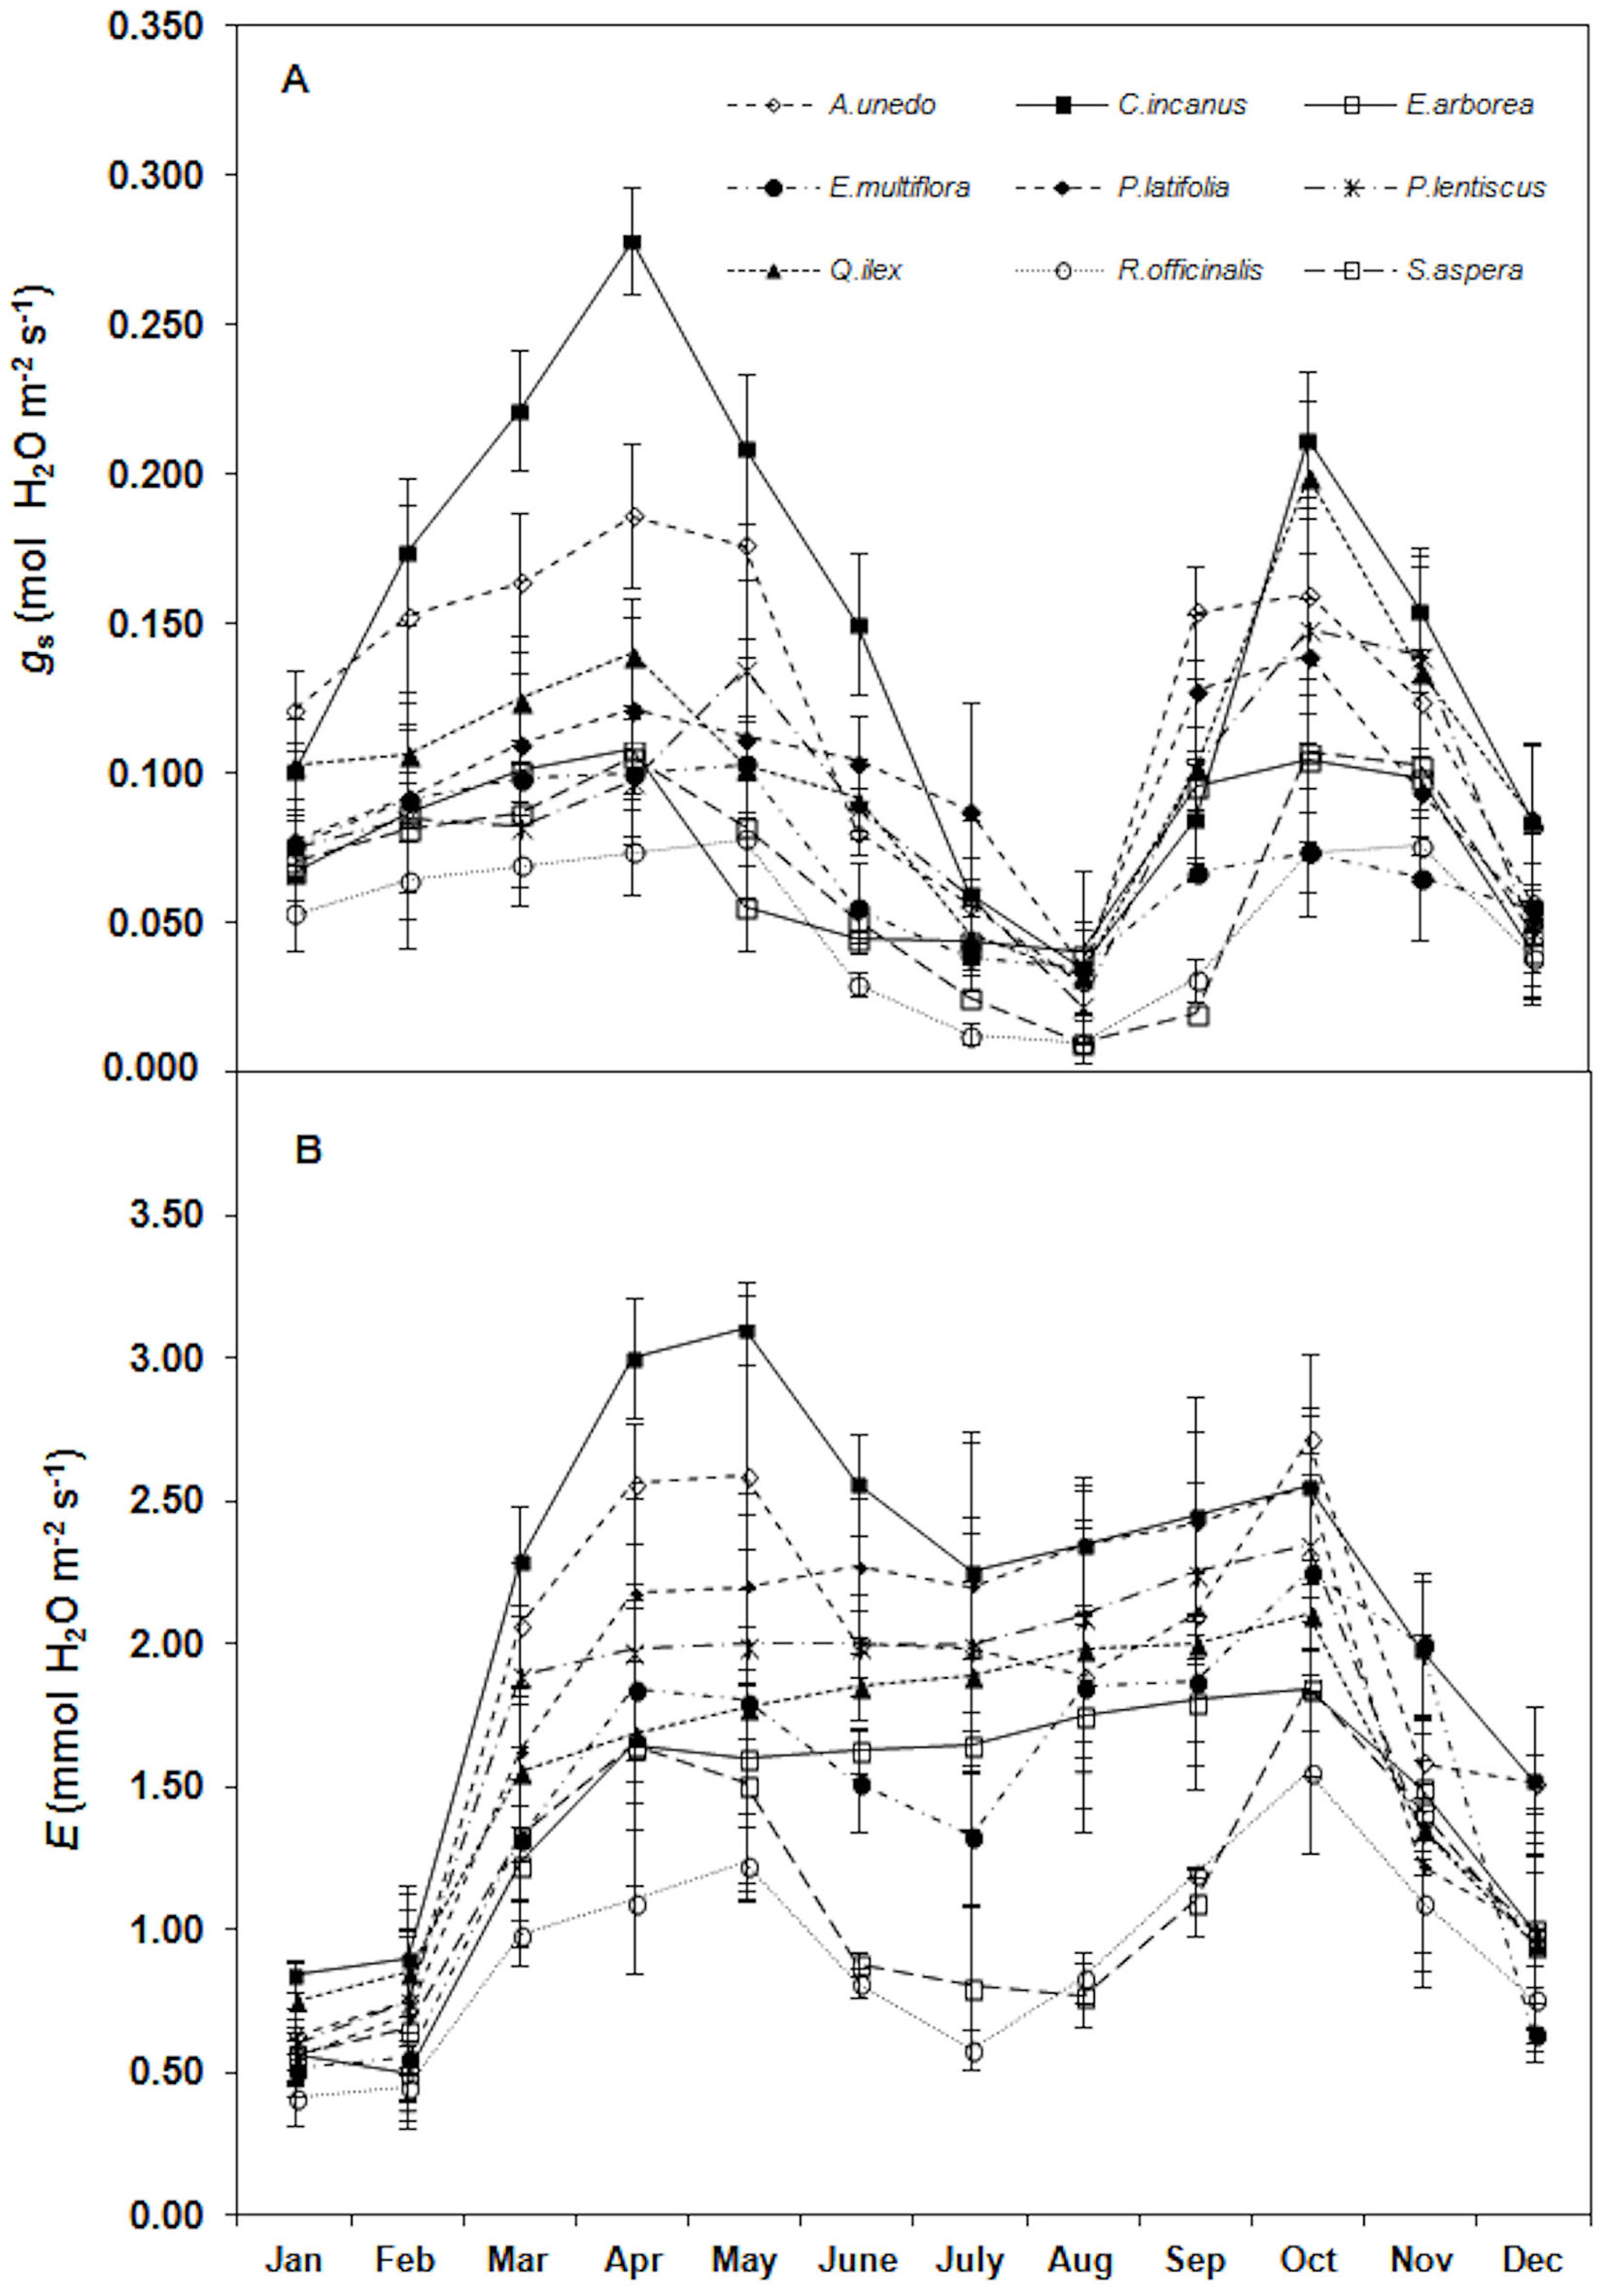
Trends of stomatal conductance and transpiration rates are displayed in Fig. 6 (A, B). In particular, gs showed the same PN trend with the highest rates in April-May (0.140 ± 0.06 mmol m-2 s-1, mean value) and the lowest in August (0.028 ± 0.011 mmol m-2 s-1, mean value). The lowest E value were monitored in winter (January-February) in all the considered species (0.639 ± 0.143 mol m-2 s-1, mean value).
Fig. 6 - Trend of (A) stomatal conductance (gs, mol H2O m-2 s-1) and (B) transpiration rates (E, mmol H2O m-2 s-1) during the study. Each point is the mean value of four sampling days per months (n = 24). Error bars represent the standard deviation.
Leaf water status
The highest Ψpd were measured in April-May (-0.11 ± 0.03 MPa, mean value), A. unedo and E. multiflora having the highest Ψpd (-0.07 ± 0.02 MPa, mean value) and R. officinalis the lowest (-0.15 ± 0.01 MPa). Ψpd decreased in August (-0.89 ± 0.31, mean value) P. lentiscus having the highest value (-0.40 ± 0.09 MPa) and R. officinalis the lowest (-1.50 ± 0.05 MPa).
RWCpd followed the same trend showed by Ψpd during the study period, with the highest values in April-May (93.2 ± 1.1 % mean values) and a significant decrease in August. Q. ilex, P. latifolia, P. lentiscus and A. unedo had the highest values (92.0 ± 1.1 %) and R. officinalis the lowest (78 ± 4 %).
Partial least squares regression
PLSR extracted two significant components which explained 24.1 % (component 1) and 20.5 % (component 2) of the original variance in the physiological variables, respectively (Tab. 4). In particular, component 1 was mainly associated to fias and PCI, while component 2 was mainly associated to LTD and CET. fias and PCI had the highest VIP (0.548 and 0.520, respectively), followed by LTD (0.370), LT (0.364), CET (0.326) and LMA (0.260).
Tab. 4 - Weights of each structural trait in the component 1 and 2 extracted by the Partial Least Squares Regression (PLSR), and variable influence on projection (VIP) values for traits in the component 1. PLSR was carried out with structural traits as predictor variables and physiological traits as response variables. (LMA): leaf mass per unit leaf area; (LTD): leaf tissue density; (PCI): potential conductance index; (fias): fraction of mesophyll volume occupied by the intercellular air spaces; (LT): total leaf lamina thickness; (CET): thickness of both upper and lower cuticle and epidermis.
| Structural trait | Component 1 |
Component 2 |
VIP |
|---|---|---|---|
LMA
|
-0.227 | -0.169 | 0.230 |
LTD
|
-0.094 | -0.617 | 0.369 |
PCI
|
0.583 | 0.370 | 0.520 |
f ias |
0.676 | -0.340 | 0.548 |
LT
|
-0.356 | 0.237 | 0.364 |
CET
|
-0.125 | 0.470 | 0.326 |
| Eingenvalues | 1.44 | 1.23 | - |
| % of explained variance | 24.1 | 20.5 | - |
Moreover, since a high VIP was found for PCI, a simple linear regression analysis was carried out to analyze the relationship between PCI and its components (i.e., LA and SD). The results showed that PCI was significantly correlated with SD (PCI = 0.0688 SD - 2.3879; R2 = 0.68; P ≤ 0.05) while any significant relationship was found between PCI and LA (PCI = 0.9423 LA - 8.5206; R2 = 0.33; P > 0.05)
Discussion
Drought resistance in Mediterranean plant species is realized by different traits or combination of traits ([23]). Our results highlight that leaf structural traits can be considered driving factors for physiological traits. This is confirmed by PLS which showed that structural and physiological traits co-vary. Structural trait variations explained 44.61 % of the total variance in PN, RL, RL/PG, Ψ and RWC. The most important structural variables in the physiological trait projection are fias and PCI, from which the internal CO2 diffusion pattern mainly depends ([36]). Photosynthesis and respiration are the most fundamental physiological processes which affect the carbon cycle on a scale ranging from the leaf to the globe ([13]). Moreover, it is recognized that leaf respiration changes are related to physiological factors ([4]) as well as environmental factors, in particular temperature and water availability ([15]). To date, the RL behavior during drought is still unclear, since RL has been found to either increase or decrease depending on the severity of drought stress and the species ([32]).
Overall, our results show a similar RL response across the considered species, with the lowest rates in winter (0.95 ± 0.44 µmol m-2 s-1, mean value) and the highest in the dry period (3.05 ± 0.96 µmol m-2 s-1, mean value). This finding supports the hypothesis that RL increases under drought, which may reflect an enhanced leaf senescence, solute accumulation and energy dissipation by the mitochondria to prevent oxidative damage by excess reductants from light reactions ([3]). The metabolic damages under drought requires a surplus of respiratory products (i.e., ATP and reducing equivalents - [47]). Thus, RL increases to meet the demand for higher ATP levels ([3]). Nevertheless, a different RL impact on gross photosynthesis (i.e., RL/PG) under drought was observed among the considered species. In particular, C. incanus, E. multiflora, R. officinalis and S. aspera show the highest RL/PG (0.54 ± 0.08, mean value) due to a higher RL (3.31 ± 1.02 µmol m-2 s-1, mean value) associated to the highest PN decrease under drought (by 84%, mean value). Differences among the species in RL/PG are also related to a different PN sensitivity to drought, which has a higher inhibitory effect on photosynthesis than on respiration ([16]). The higher PN sensitivity to drought is also confirmed by the thermal windows analysis which highlights that PN drops below half of its maximum when leaf temperature is above 33.4 °C (mean value of the species - [23], [11]). Moreover, Ψpd which can be considered a powerful indicator of drought stress ([28]) varies from -1.30 ± 0.27 MPa in August to -0.11± 0.04 MPa in May (mean of the considered species) associated to a 10% RWCpd decrease in August. R. officinalis, C. incanus, and E. multiflora show a lower capacity to adjust photosynthesis in drought also due to their shallow root system ([1]), which entails only the access to the superficial soil profile subjected to large changes in water content ([5]). The response of R. officinalis to drought may also be explained by 87% gs decrease and the lowest PCI (5.5 ± 1.4) which depends on both stomatal density (SD = 168 ± 23 stomata mm-2) and size (SPSLAWB= 219 ± 47µm2). This indicates a low capacity of R. officinalis to regulate stomatal conductance ([26]). Moreover, the higher CE decrease (by 87%), indicating a lower Rubisco activity, suggests that in addition to a stomatal limitation, there are a non-stomatal limitation of photosynthesis according to Llorens et al. ([31]). On the contrary, Q. ilex, P. latifolia, P. lentiscus, A. unedo and E. arborea are characterized by a lower RL/PG (0.22 ± 0.05, mean value) under drought, resulting from a lower RL (2.55 ± 0.52 µmol m-2 s-1, mean value) and a lower PN decrease (62% of the maximum, mean value). The sclerophyllous species and E. arborea have a sufficiently higher Ψpd (-0.64 ± 0.21 MPa, mean value) and RWCpd (92 ± 2%, mean value), reflecting their deep root system which accesses water from those parts of the soil profile subjected to narrow changes in water content ([23]). Moreover, the higher LMA and LTD of these species (17.4 ± 3.5 mg cm-2 and 523 ± 73 mg cm-3, mean value, respectively) result in a higher leaf compactness which improves drought resistance. This behavior was also attested by the thermal windows analysis showing that PN drops below half of its maximum when leaf temperature is above 37.0 °C (mean value of the species - [23]). A. unedo displays several mechanisms of drought stress resistance ([34]). It is functionally adapted to cope with the summer drought by its stomatal regulation to which contributes a higher PCI (18.2 ± 2.8) and the steeper leaf inclination angle ([22]), a mechanism which prevents the potential photo-inhibition of water-stressed leaves during drought ([49]).
With regards to PGy (i.e., the daily photosynthetic and respiratory activity over the year), C. incanus had the highest PGy and R. officinalis and E. multiflora the lowest. In particular, C. incanus maintains a relatively high RL in spring necessary to produce summer leaves ([10], [12]). The higher PN in C. incanus is reflected by a higher fias (38%) and a lower LMA (15.1 ± 0.7 mg cm-2), which result from a shorter diffusion path from stomata to chloroplasts ([23]). Moreover, this is consistent with the high CE (0.063 ± 0.034 mol m-2 s-1, mean value of the study period) compared to the others species, according to the results of Arena et al. ([2]), considering that the apparent carboxylation efficiency is usually correlates with Rubisco activity ([48]). On the contrary, the lowest PGy in R. officialis and in E. multiflora mainly reflects the low PN during the year, as a consequence of the low CE value (0.031 ± 0.007 mol m-2 s-1, mean value) and the lower fias (26 ± 1%, mean value), associated to a higher LMA and LTD (23.6 ±3.9 mg cm-2 and 670 ±127 mg cm-3 mean value, respectively).
Conclusions
The results of this study revealed similar RL trends across the considered species over the year. Nevertheless, large RL/PG variations among the species depend on the different sensitivity of both RL and PN to drought. Considering the increase of drought stress which is expected to occur in the Mediterranean basin and that the photosynthesis of Mediterranean evergreen species is frequently limited by sub-optimal conditions (i.e., water deficit, high light intensity and high temperature), improving the knowledge of leaf respiration variations and its effect on gross photosynthesis over time will result in a more accurate estimation of carbon balance.
References
Gscholar
Gscholar
Gscholar
Gscholar
CrossRef | Gscholar
Gscholar
Gscholar
Gscholar
CrossRef | Gscholar
Authors’ Info
Authors’ Affiliation
Rosangela Catoni
Laura Varone
Department of Environmental Biology, Sapienza University of Rome, P.le A. Moro 5, 00185 Rome (Italy)
Corresponding author
Paper Info
Citation
Gratani L, Catoni R, Varone L (2016). Evergreen species response to Mediterranean climate stress factors. iForest 9: 946-953. - doi: 10.3832/ifor1848-009
Academic Editor
Elena Paoletti
Paper history
Received: Sep 01, 2015
Accepted: Apr 06, 2016
First online: Jul 07, 2016
Publication Date: Dec 14, 2016
Publication Time: 3.07 months
Copyright Information
© SISEF - The Italian Society of Silviculture and Forest Ecology 2016
Open Access
This article is distributed under the terms of the Creative Commons Attribution-Non Commercial 4.0 International (https://creativecommons.org/licenses/by-nc/4.0/), which permits unrestricted use, distribution, and reproduction in any medium, provided you give appropriate credit to the original author(s) and the source, provide a link to the Creative Commons license, and indicate if changes were made.

Web Metrics
Breakdown by View Type
Article Usage
Total Article Views: 51045
(from publication date up to now)
Breakdown by View Type
HTML Page Views: 41678
Abstract Page Views: 3588
PDF Downloads: 4177
Citation/Reference Downloads: 45
XML Downloads: 1557
Web Metrics
Days since publication: 3646
Overall contacts: 51045
Avg. contacts per week: 98.00
Article Citations
Article citations are based on data periodically collected from the Clarivate Web of Science web site
(last update: Mar 2025)
Total number of cites (since 2016): 3
Average cites per year: 0.30
Publication Metrics
by Dimensions ©
Articles citing this article
List of the papers citing this article based on CrossRef Cited-by.
Related Contents
iForest Similar Articles
Research Articles
Photosynthesis of three evergreen broad-leaved tree species, Castanopsis sieboldii, Quercus glauca, and Q. myrsinaefolia, under elevated ozone
vol. 11, pp. 360-366 (online: 04 May 2018)
Research Articles
Day and night respiration of three tree species in a temperate forest of northeastern China
vol. 8, pp. 25-32 (online: 26 May 2014)
Research Articles
The use of branch enclosures to assess direct and indirect effects of elevated CO2 on photosynthesis, respiration and isoprene emission of Populus alba leaves
vol. 1, pp. 49-54 (online: 28 February 2008)
Research Articles
Wintertime photosynthesis and spring recovery of Ilex aquifolium L.
vol. 12, pp. 389-396 (online: 31 July 2019)
Research Articles
Successional leaf traits of monsoon evergreen broad-leaved forest, Southwest China
vol. 10, pp. 391-396 (online: 16 March 2017)
Short Communications
Variation in growth, photosynthesis and water-soluble polysaccharide of Cyclocarya paliurus under different light regimes
vol. 10, pp. 468-474 (online: 04 April 2017)
Research Articles
Multi-temporal influence of vegetation on soil respiration in a drought-affected forest
vol. 11, pp. 189-198 (online: 01 March 2018)
Research Articles
Adjustment of photosynthetic carbon assimilation to higher growth irradiance in three-year-old seedlings of two Tunisian provenances of Cork Oak (Quercus suber L.)
vol. 10, pp. 618-624 (online: 17 May 2017)
Research Articles
Light acclimation of leaf gas exchange in two Tunisian cork oak populations from contrasting environmental conditions
vol. 8, pp. 700-706 (online: 08 January 2015)
Research Articles
Relationships between leaf physiognomy and sensitivity of photosynthetic processes to freezing for subtropical evergreen woody plants
vol. 12, pp. 551-557 (online: 17 December 2019)
iForest Database Search
Search By Author
Search By Keyword
Google Scholar Search
Citing Articles
Search By Author
Search By Keywords
PubMed Search
Search By Author
Search By Keyword


