Effect of seedling stock on the early stand development and physiology of improved loblolly pine (Pinus taeda L.) seedlings
iForest - Biogeosciences and Forestry, Volume 9, Issue 5, Pages 690-695 (2016)
doi: https://doi.org/10.3832/ifor1725-009
Published: May 12, 2016 - Copyright © 2016 SISEF
Research Articles
Abstract
This study assessed the effects of spacing and genotype on the growth and physiology of improved loblolly pine (Pinus taeda L.) seedlings from three distinct genotypes planted in Drew County, Arkansas (USA). Genotype had a significant effect on survival and height. Clone CF Var 1 showed greater height and survival compared to other seedlings. Genotype had significant effects on uniformity in height both years and ground line diameter (GLD) first year. However, genotype had no significant effects on leaf water potential and coefficient variation of leaf water potential. These growth and physiology should be further studied to assess potential genetic differences among seedlings and to determine if they can be identified early for improved growth at later ages.
Keywords
Loblolly Pine, Genotype, Leaf Water Potential, Coefficient of Variation
Introduction
Loblolly pine (Pinus taeda L.) is the native and most commercially important pine species in the southern United States and has been intensively and extensively managed for pulp and timber throughout the southeastern US ([12]). As consumer demands for wood timber products increase, greater production will be required to ensure supply meets demand ([24]). Given that this increased production must come from a gradually declining timber base, intensive management that combines the best genetically improved planting stock and best silvicultural practices likely represent the most effective option to meet these future demands ([12], [28], [5], [26]).
Deployment of improved varieties could result in greater stand-level uniformity and enhanced productivity potentially aiding in the sustainability of southern forests to meet market demands ([16]). An increase of 15 to 20% in volume and improvements to stem quality and disease resistance have been reported in first generation loblolly and slash (Pinus elliottii Mill.) pine ([15], [27]). This increase is even more pronounced when comparing the mean annual increment (MAI) of naturally regenerated stands (2 to 3 m3 ha-1 yr-1) to high intensity plantations with MAI of 21 to 28 m3 ha-1 yr-1 ([12]). Large scale planting of genetically improved stock loblolly pine will inevitably have a significant impact on the future wood supply and forest management practices across the southern US ([18]b). Across the southeastern US improved genetics and intensive culture such as N and P fertilization and completion control have significantly increased the productivity of loblolly pine ([2], [20], [12], [26]).
Genetically improved loblolly pine plantations, with their greater physiological uniformity, could result in more resource capture and more stand level productivity during the early stages of stand development ([8]). Few studies have compared the uniformity in growth and physiology of improved loblolly pine ([3], [4]). Therefore, the goal of this study was to compare the growth, uniformity in growth and leaf water potential among three loblolly pine genotype. Our hypothesis was that less genetically diverse genotypes (i.e., clones) would have more uniform growth and physiological traits than a more diverse genotype.
Material and methods
Site and loblolly pine genotype descriptions
The study area is located in Drew County, Arkansas (USA), on the University of Arkansas-Monticello (UAM) Teaching and Research School Forest (Latitude: 33° 37′ 1″ N, Longitude: 91° 43′ 9″ W). Based on NOAA weather station data, mean annual precipitation is 135.9 cm, with an average January temperature of 6.3 °C, and an average July temperature of 27.7 °C ([17], [22]). The study area is characterized by predominant Calloway silt loams (fine-silty, mixed, active, thermic aquic Fraglossudalfs) with strongly acidic soil with level to gentle slope with an estimated 50-year loblolly pine site index 25 m ([17]).
The study site was a mature (approximately 55-year-old) pine-hardwood stand prior to destruction via tornado and subsequent clearing in 2010. Three families of loblolly pine seedlings were hand-planted in January 2012: an Arkansas-origin improved, open-pollinated family and two Atlantic Coastal Plain-origin full-sibling cloned families. Banded herbicide was applied post planting in late winter 2012 and contained 2% solution of glyphosate and Oust® XP 0.14 kg ha-1. An additional application was made during late winter of 2013. No fertilization treatment was done.
The three types of seedlings included a half-sibling bare-root seedlings (hereafter, “half-sib”) were Arkansas Forestry Commission 3-star loblolly pine produced from seed sources of Arkansas, and selected by the Western Gulf Tree Improvement Cooperative. The half-sib seedlings are reported to have a 41-51% genetic gain over woods-run stock ([1]). Also included were, two full-sib clones planted as containerized seedlings and developed by CellFor (currently owned by ArborGen). The first clone, CellFor Variety 1 (CF Var 1) was products of Carolina parents (father tree South Carolina and mother tree North Carolina). These clones are advertised as having fast growth rate, high resistant to fusiform rust and pitch canker, stem straightness, and medium to wide crown (CellFor 20). CellFor Variety 2 (CF Var 2) is the progeny of two South Carolina parents and has exceptional tree form with small branches, narrow crown, stem straightness, fast growth rate, and high resistance to fusiform rust.
Experimental design
The experimental design was a split plot design. Wide (3.05 × 4.27 m = 13 m2) and narrow (3.05 × 3.05 m = 9.3 m2) spacing treatments were randomly assigned to the whole plot units. Genotypes (half-sib, CF Var 1, and CF Var 2) were randomly assigned to the subplots resulting into six treatment combinations. Each combination was replicated 3 times, for a total of 18 genotype by spacing with 140 trees per plot. Within one of the subplots in each of the spacing strips, the subplot was further split into a mixture planting that included a clone (35 tree) and half-sib planting (35 tree) mixture in alternate row. Mixed plots were also segregated by stock and considered subplots in this study, given no tree-to-tree competition was occurring at this early stage. A total 3360 trees comprised the study which covered 0.3 ha in area.
Data collection
Ground line diameter (GLD) to the nearest mm and height (HT) to the nearest half cm were measured for all seedlings at the end of first and second growing season. Survival percentage at the end of each growing season also was determined during these sampling periods with a census of each subplot. Trees were counted as alive if green needles were present (n= 3360).
Protocols were developed based on available measuring devices, labor and limited time frame (an hour) for leaf water potential (MPa) data collection to ensure maximal environmental homogeneity. Needles were collected from six randomly selected trees per plot (n=180). Needles along the stem between first flush and first branch were excised, placed into plastic bags, and stored in a cooler until they were analyzed in the lab. Leaf water potential was measured in one randomly selected needle per tree with a pressure bomb (PMS Instrument Company, Albany, OR, USA).
Leaf water potential were measured every month, at mid-month, throughout the growing season (i.e., March to September 2013) in similar weather conditions, i.e., full sun. To compare different genotypes for leaf water potential, measurements were done within an hour and under consistent weather in terms of wind speed, temperature, solar radiation etc. when the plants were at a relatively stable hydraulic state; at dawn plants were under minimal water deficit while at midday they were at peak stress ([9]). PMS Instrument Company has given ranges of values to determine the stress level of loblolly pine. Predawn/midday plant moisture stress (PMS) value ranges from 0.5 to 0.8 MPa reflect no limitation for growth, and under this condition plants have adequate water supply to maintain the maximum shoot growth; predawn to mid-day PMS value of 1.0 to 1.2 MPa reflects the slight to moderate shoot growth reductions; such stress limits phloem transport, leaf expansion, and diameter growth. Whereas PMS value of 1.2 to 1.4 MPa during sunrise to midday can cause stomatal closure ([23]). These positive pressures reflect the reciprocal tension (negative energy/pressure) at which water is held in the leaf.
Data analysis and model development
Effects of spacing, genotype, and their interaction on mean height, GLD, survival, height growth, GLD growth, and leaf water potential were analyzed using a generalized linear model approach (PROC GLM in SAS® version 9.2) with the block as a random effect and both genotype and spacing as fixed effects. The study design was a blocked split-plot design, in which the main effect (spacing) was split into the genotypes (subplots). The statistical model used was (eqn. 1):
where Yijk represents response variable at ith block, jth spacing, and kth genotype, µ represents the overall mean effect, αi was the effect of the ith block, βj was the fixed effect of the jth main plot spacing, γk was the fixed effect of the kth subplot genotype, αβ, αγ, and βγ were the interaction terms, and eijk was the error term of this model. Survival was expressed as percent survival per sub-plot and transformed using the arcsine function prior to performing ANOVA. Changes in height growth and GLD growth were calculated by subtracting the first year from the second year measurements. Individual trees within a plot were averaged to obtain a plot mean and all the analysis was performed at the sub-plot level. In order to determine the uniformity, the coefficient of variation (CV) for GLD, height, leaf water potential was estimated for each genotype growing within each spacing for each growing season. ANOVA was used to test for differences in the CV among genotype and spacing. When the ANOVA identified significant genotype or interaction treatment effects at α = 0.05, a least squares means approach was used to compare the genotypes for significant differences. Assumptions of all analyses were checked before and after analysis.
Results
Effect of genetics, spacing, and their interaction on survival, growth and uniformity
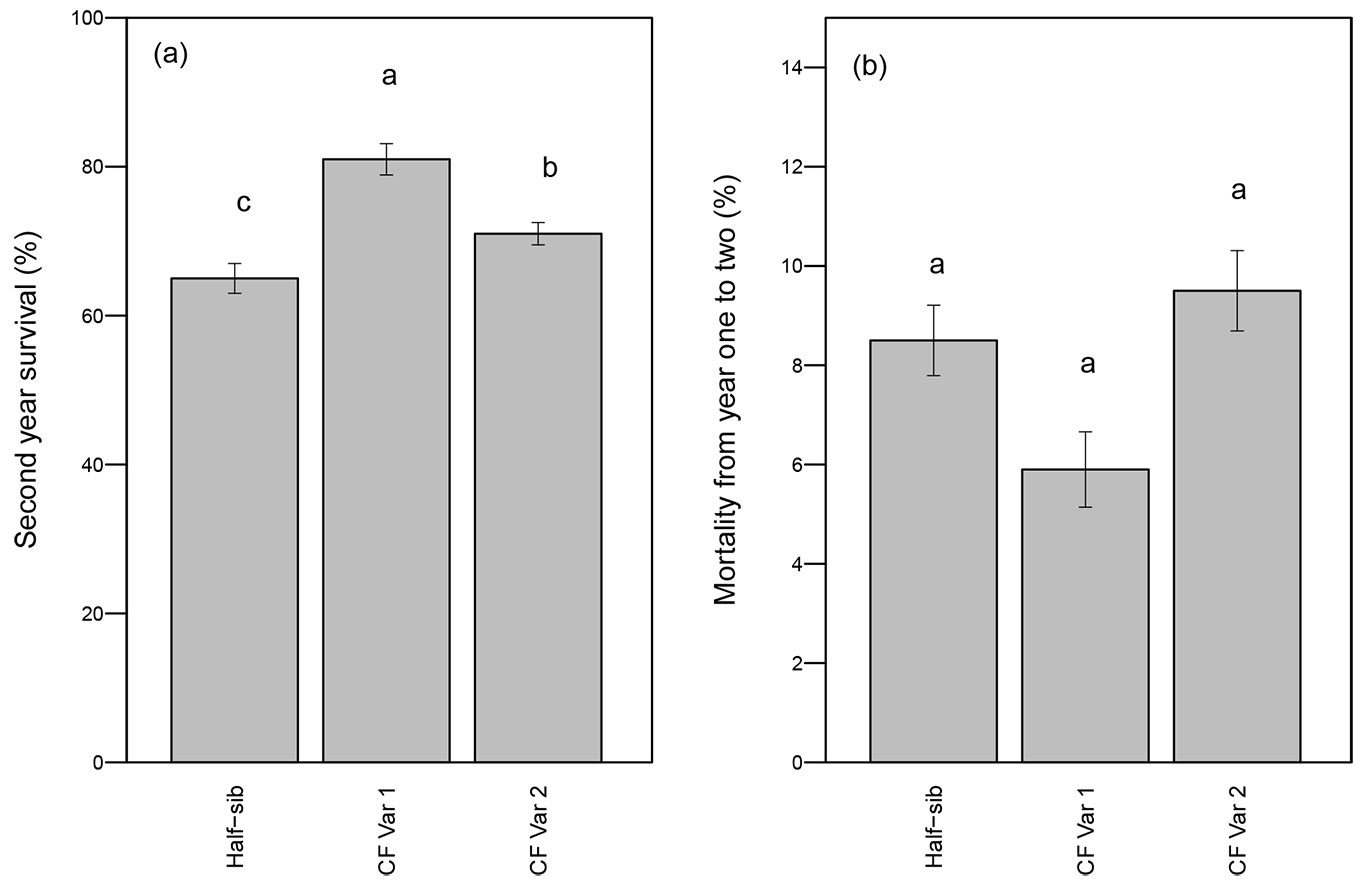
Survival after two growing seasons was significantly affected by genotype (p <0.01 - Tab. 1). CF Var 1 had significantly greater survival rate (81%) than either CF Var 2 (71%) or half-sib seedlings (65% - Fig. 1a). While CF Var 2 had experienced greater mortality from year one to year two relative to the half-sib and CF Var 1 seedlings (Fig. 1b), genotype did not significantly affect mortality (p-value = 0.28 - Tab. 1).
Tab. 1 - ANOVA table of arcsine transformed loblolly pine second year survival and change in mortality from first-year to second-year per spacing-by-genotype sub-plots. (*): Denotes significance at α = 0.05.
| Effects | df | Survival (age 2) |
Mortality (age 1 to age 2) |
|---|---|---|---|
| P > F | P > F | ||
| Spacing | 1 | 0.23 | 0.84 |
| Block | 1 | 0.19 | 0.03* |
| Block × Spacing | 1 | 0.63 | 0.37 |
| Genotype | 2 | <0.01* | 0.28 |
| Block × Genotype | 2 | 0.39 | 0.96 |
| Genotype × Spacing | 2 | 0.81 | 0.95 |
Fig. 1 - Mean percent (a) survival after the second growing season and (b) mortality (year 2 - year 1, ± standard error) by genotype. Different letters indicate significant differences in average survival percentages and mortality among genotypes by growing season using least squares means test (α = 0.05).
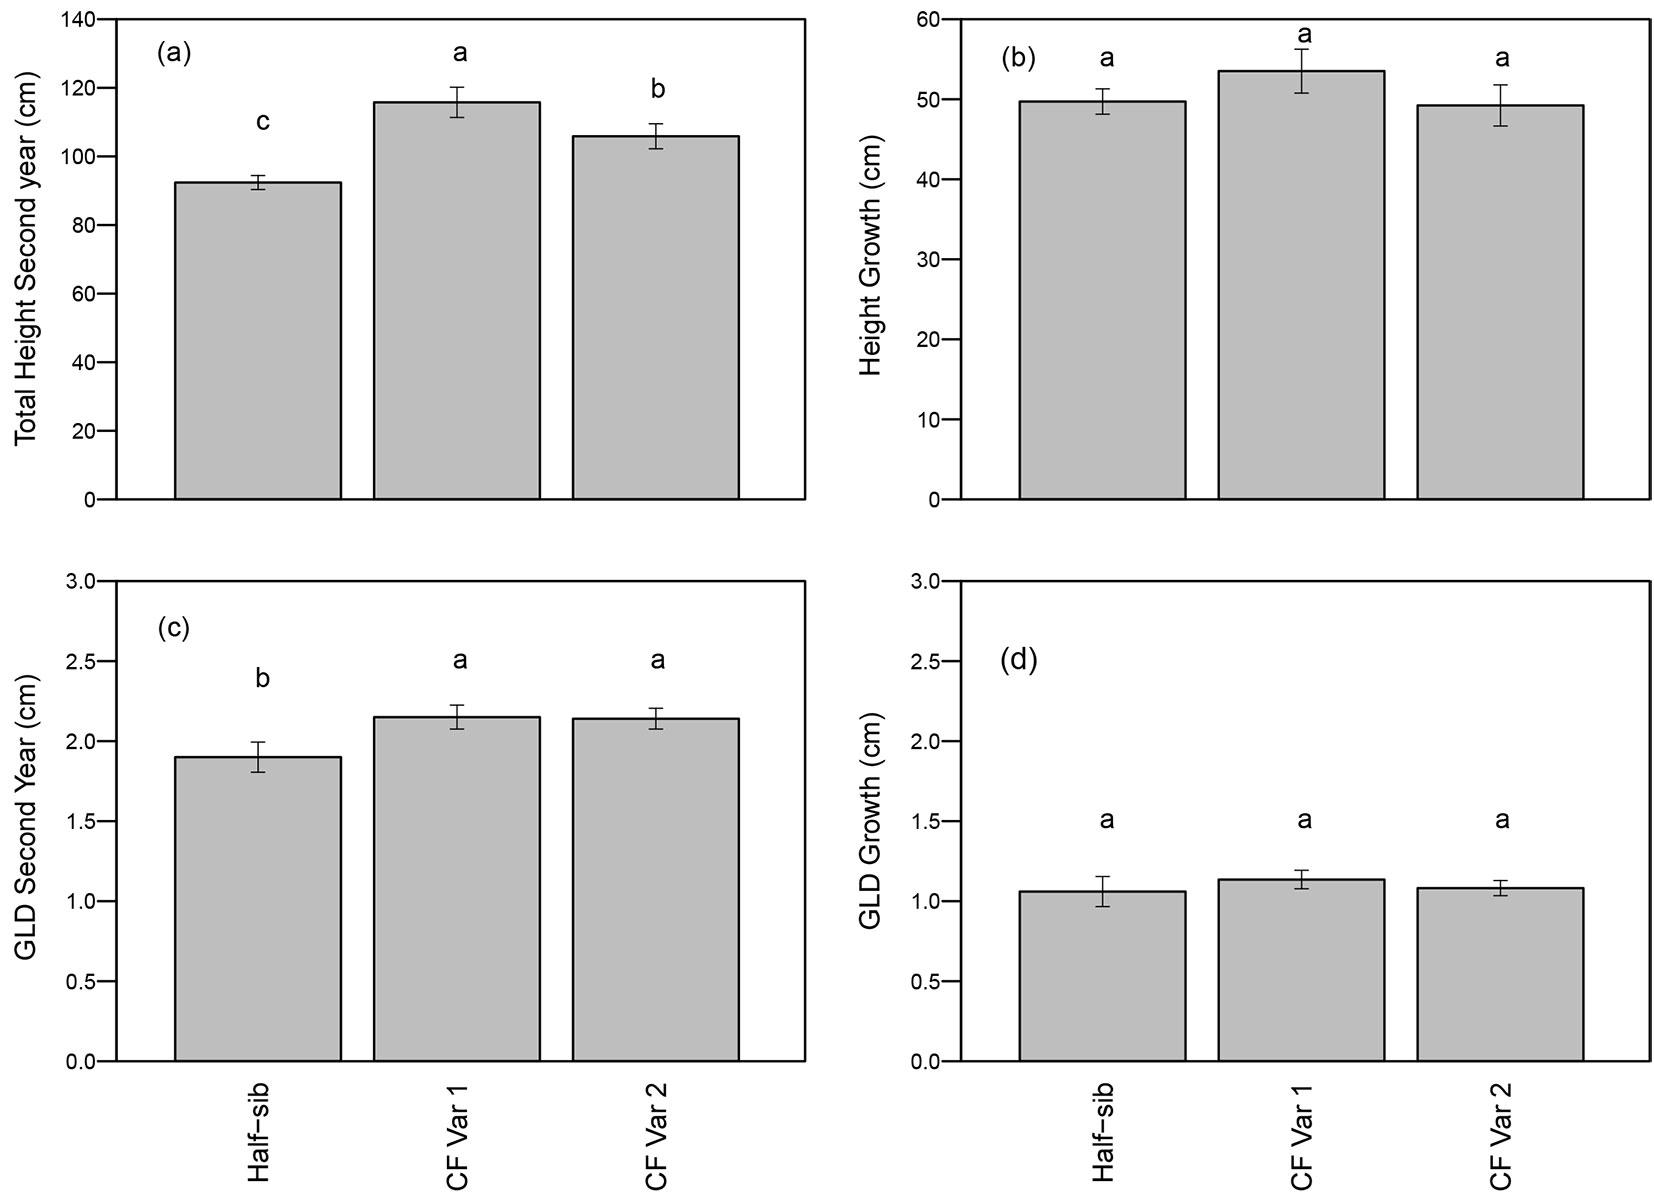
First year total height was a highly significant covariate for total height after two growing seasons (p<0.01 - Tab. 2). Total height was not affected by spacing or spacing-by-genotype interactions, but varied by genotypes (p <0.01 - Tab. 2). Both varietals were taller than the half-sib seedlings, and CF Var 1 was approximately 10% taller than CF Var 2 (Fig. 2a). Height growth for the second growing season did not differ significantly among genotype and between spacings (Tab. 2), and averaged around 50 cm (Fig. 2b).
Tab. 2 - ANOVA table of loblolly pine second year GLD, height, GLD growth, height growth for spacing-by- genotype sub-plots. First year seedling GLD and height were used as covariates in the second year GLD and height respectively. (*): Denotes significance at α = 0.05; (1): first year GLD was the covariate for second year GLD; (2): first year height was the covariate for the second year total height.
| Effects | df | GLD (age 2)1 |
Height (age 2)2 |
GLD Growth |
Height Growth |
|---|---|---|---|---|---|
| P > F | P > F | P > F | P > F | ||
| First Year (GLD/Height) | 1 | 0.081 | <0.01*2 | - | - |
| Spacing | 1 | 0.15 | 0.58 | 0.14 | 0.53 |
| Block | 1 | 0.86 | 0.67 | 0.90 | 0.07 |
| Block × Spacing | 1 | 0.89 | 0.01* | 0.86 | 0.01* |
| Genotype | 2 | 0.86 | 0.01* | 0.8 | 0.31 |
| Block × Genotype | 2 | 0.61 | 0.16 | 0.5 | 0.97 |
| Genotype × Spacing | 2 | 0.47 | 0.37 | 0.35 | 0.30 |
Fig. 2 - Mean (± standard error) (a) height after second growing season, (b) height growth, (c) GLD after second growing season, and (d) GLD growth by genotype. Means followed by a different letter indicate significant difference within growing season using least squares means test (α = 0.05).
First year GLD was not a significant covariate (p = 0.08) in the ANOVA for total GLD at second year (Tab. 2). GLD of half-sib seedlings, CF Var 1, and CF Var 2 were 1.9 cm, 2.15 cm, and 2.14 cm, respectively (Fig. 2c). GLD and GLD growth during the second growing season were not affected by spacing or genotype (Tab. 2 and Fig. 2d).
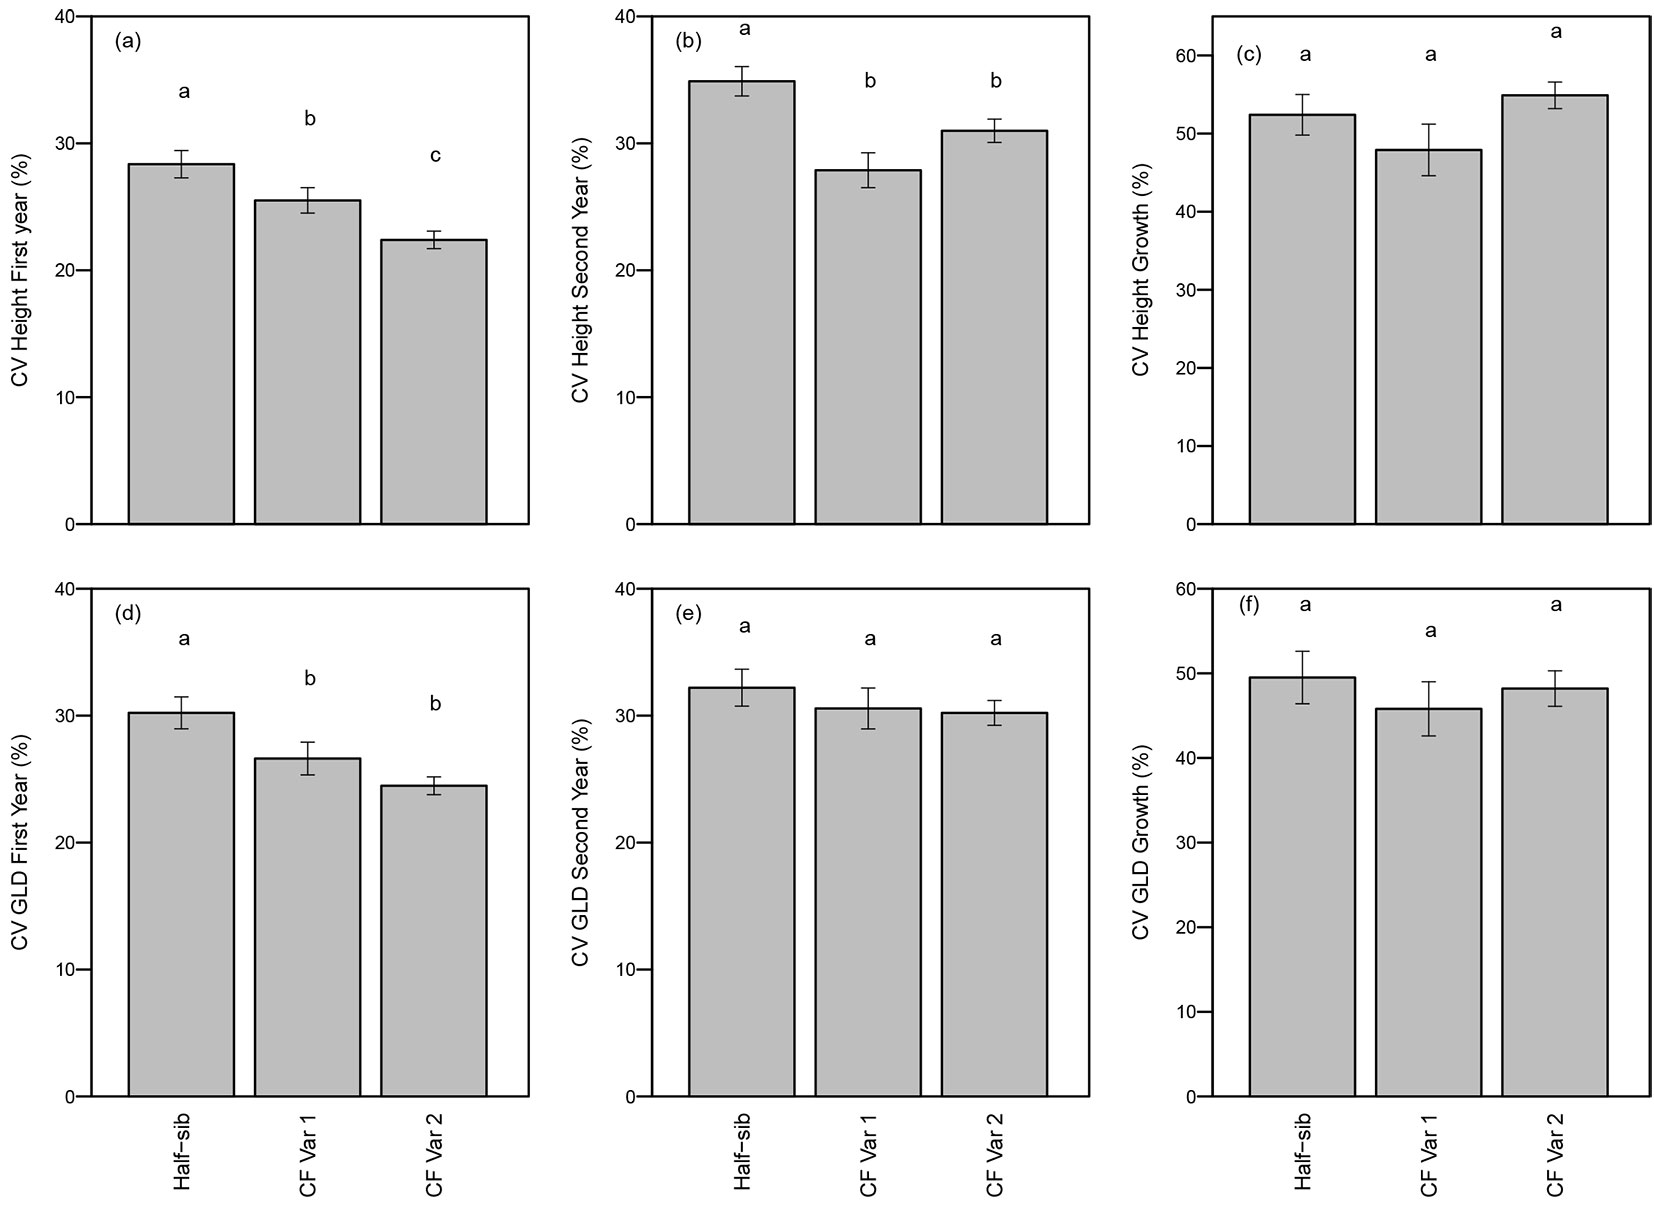
In both years, the CV for height differed significantly among genotypes (p <0.01 - Tab. 3). As expected, clonal genotypes had greater uniformity (i.e., lower CVs) in height both years compared to the half-sib seedlings. CV for total height of half-sib seedlings was significantly higher (28% in the first year and 35% in the second year) than CF Var 1 (25% first year and 28% second year) or CF Var 2 (22% first year and 31% second year - Fig. 3a and Fig. 3b). Furthermore, CV for height growth was not significantly affected by genotype (Tab. 3, Fig. 3c).
Tab. 3 - ANOVA table of loblolly pine CV of GLD and height at first, second year, growth, and leaf water potential for spacing-by-genotype sub-plots. (*): Denotes significance at α = 0.05.
| Effects | df | GLD | Height | Leaf water potential |
||||
|---|---|---|---|---|---|---|---|---|
| age 1 | age 2 | Growth | age 1 | age 2 | Growth | |||
| P > F | P > F | P > F | P > F | P > F | P > F | P > F | ||
| Spacing | 1 | 0.36 | 0.4 | 0.57 | 0.70 | 0.97 | 0.99 | 0.81 |
| Block | 1 | 0.75 | 0.38 | 0.33 | 0.41 | 0.93 | 0.97 | 0.48 |
| Block × Spacing | 1 | 0.56 | 0.58 | 0.07 | 0.21 | 0.67 | 0.45 | 0.16 |
| Genotype | 2 | 0.01* | 0.54 | 0.65 | <0.01* | <0.01* | 0.23 | 0.36 |
| Block × Genotype | 2 | 0.63 | 0.62 | 0.93 | 0.34 | 0.13 | 0.71 | 0.15 |
| Genotype × Spacing | 2 | 0.22 | 0.68 | 0.61 | 0.22 | 0.98 | 0.81 | 0.81 |
Fig. 3 - Mean (± standard error) coefficient of variation (CV) (a) first year height, (b) second year height, (c) height growth, (d) first year GLD, (e) second year GLD, and (f) GLD growth by genotype. Means followed by a different letter indicate significant differences within growing season using least squares means test (α = 0.05).
Within a clone there is no tree-to-tree genetic variation so clonal seedlings are expected to be more uniform with a lower coefficient of variation (CV) than half-sib seedlings. First year CV for GLD differed significantly among genotypes (p = 0.01) (Tab. 3). CV for GLD of half-sib seedlings (30%) was significantly greater than CF Var 1 (26%) and CF Var 2 (24% - Fig. 3d). CVs for GLD and GLD growth were not significantly different among genotypes (Tab. 3, Fig. 3d, Fig. 3e, Fig. 3f).
Effects of genotype on leaf water potential and uniformity
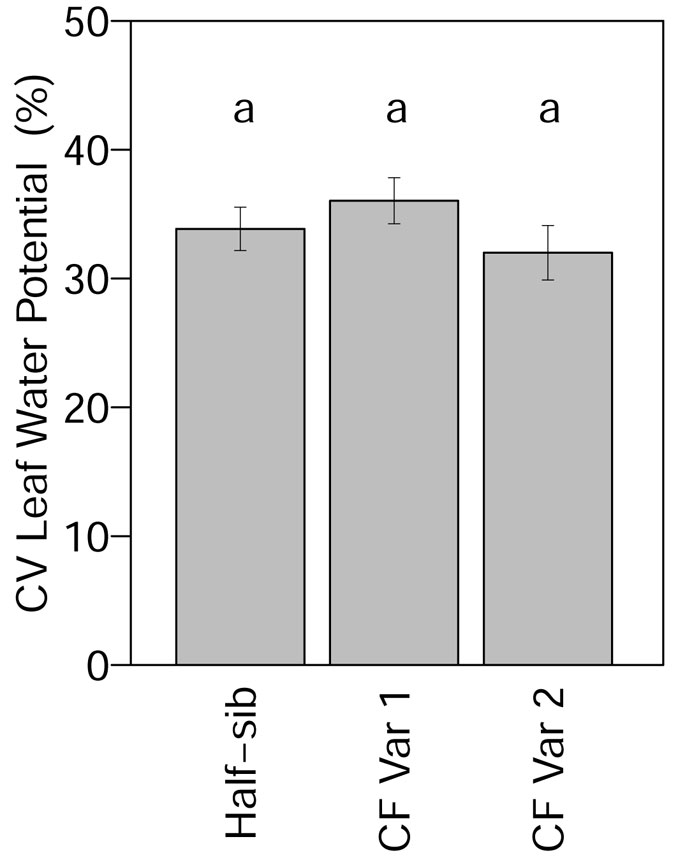
Leaf water potential was not significantly affected by genotype and spacing (Tab. 4). Mean leaf water potential was -9.0 MPa across all genotypes (Fig. S1 in Appendix 1). Although leaf water potential was not significantly affected by genotype, when month was added to the model the month and month × genotype interaction effects significantly affected leaf water potential (Tab. 4). From March through September, leaf water potential in June and leaf water potential of half-sib in August were significantly lower than other months. Leaf water potential was significantly higher for CF Var 2 in August (Fig. S1 in Appendix 1). The highest leaf water potential values were recorded in September, which corresponds to precipitation in September that was less than the precipitation average for the month in the past ten years. Coefficient of variation for leaf water potential did not differ significantly among genotypes (Tab. 3). The CV for leaf water potential of half-sib, CF Var 1, and CF Var 2 were 34%, 36%, and 32% (Fig. 4), respectively.
Tab. 4 - ANOVA table of effects on leaf water potential of measured loblolly pine seedlings composed of three genotypes and planted at two spacing across the second growing season (March to September 2013). (*): Denotes significance at α = 0.05.
| Effects | DF | Leaf water potential |
|---|---|---|
| P > F | ||
| Spacing | 1 | 0.72 |
| Block | 1 | 0.81 |
| Block × Spacing | 1 | 0.30 |
| Genotype | 2 | 0.97 |
| Block × Genotype | 2 | 0.45 |
| Genotype × Spacing | 2 | 0.33 |
| Month | 6 | <0.01* |
| Genotype × Month | 12 | <0.01* |
Fig. 4 - Mean (± standard error) CV of leaf water potential by genotype in 2013. Means followed by a different letter indicate significant differences in each month using least squares means test (α = 0.05).
Discussion
Supporting our starting hypothesis, a greater growth and higher uniformity were observed in the clones. Although stands in this study are in their early stages of stand development, clones exhibited greater growth and uniformity compared to half-sib seedlings. However, significant difference among leaf water potential was not observed in this study.
During the initial stage of stand development, genotype had significant influences on survival and height (Tab. 1 and Tab. 2); however, GLD did not differ significantly among genotypes (Tab. 1). Significant genetic effects on GLD among half-sib, full-sib, and clonal seedling stocks has been reported ([4]). Although the percentage of survival and the height of clonal seedlings were significantly greater than half-sib seedlings (Fig. 1 and Fig. 2), these may have been influenced by factors associated with their production. For instance, the initial seedling size was unknown in this study; therefore, first year height was used as a covariate in the year 2 analysis and was found to be significant. In addition, height growth and GLD growth from the first to the second year were not significantly different among families (Tab. 2). These traits may indicate that the size differential among genotype was still affected by the initial size at time of planting. Other studies have found that initial seedling size affects total tree height and GLD after six years ([25]) and after two years ([4]).
It is also likely that seedling type (i.e., containerized vs. bare-root) may have affected the growth and survival rate. In the current study, clonal seedlings were containerized whereas the half-sib seedlings were bare-root, which may have confounded the observed differences in height, GLD, and survivorship. A number of studies of southern pines on marginal or adverse sites have found that containerized stock survives and grows better than bare-root stocks ([6], [7], [10], [11], [14]). Moreover, the two clonal stocks were grown and processed similarly and yet had a 10% difference in survival and a 10 cm difference in total height at the end of year two, potentially indicating a pure genetic response (Fig. 2). Interestingly, differences among the same planting stock were not evident in either GLD at the end of second year or GLD growth.
For individual clones which have no genetic variation ([20]) from one tree to the next, uniformity in GLD and height is expected to be high ([19], [8]) compared to the uniformity within half-sib genotypes, which is what was observed for height but not for height growth and GLD growth (Fig. 3). In contrast to this, Aspinwall et al. ([4]) found more variability in height growth in clones compared to open pollinated and full-sib genotypes, and they reported no consistent difference in GLD uniformity over time. Furthermore, they attributed the observed variability to microsite conditions on their minimally prepared, highly heterogeneous site. During the early stages of loblolly pine development in operational plantation conditions, genotypes with little or no genetic diversity may show greater sensitivity to changes in site environmental conditions ([4]). Under more intensive management conditions, clones may show more uniform growth and development ([19], [8]).
Although leaf water potential among genotype was not significant, more uniformity in the leaf water potential was seen in the clones than in half-sib seedling. These findings may be due to variation in light condition, competing vegetation, nutrient availability, and water availability in this study site. Given the range of stress levels provided by the PMS instrument company for loblolly pine ([23]), leaf water potential in this study site had a minimal impact in June (-0.6 MPa) and August (-0.7 MPa). In March, April, May, July, and September a slight to moderate impact of leaf water potential may have occurred, though no extreme values (greater than -1.2 MPa) were recorded.
One clone did outperform the half-sib in survival and height after two years, but whether this is due to genetic differences or seedlings type is unclear. If this performance is due to genetics, many studies have suggested that sustained productivity from genetic improvement can be sustained with the help of site-specific management ([13], [18], [21]).
Conclusions
In this study, differences among the three planting stocks appeared very quickly, including between the two containerized clones, on the test site in southeastern Arkansas and provided further (albeit limited) support for the use of genetically improved planting stock. There also were seedling stock differences (i.e., bare-root vs. containerized) which confounded genetic effects. Moreover, CF Var 1 was found to have consistently higher rates of survival as well as greater height when compared to the other containerized clone seedlings and bare-root half-sib seedlings. In terms of leaf water potential, neither clonal variety significantly outperformed the other in all measures. Furthermore, evidence that levels of genetic diversity would result in corresponding stand level uniformity for measured traits was not detected consistently. This finding suggest that less genetic diversity can lead to no difference in uniformity on a heterogeneous site which potentially decreases expected gains from the superior stock.
More time is needed to determine if early trends hold especially after inter-tree competition begins. Although one clone did outperform the improved half-sib seedlings both in survival and growth, the lower cost of the half-sib stock make it a popular choice for landowners in southeastern Arkansas who want to plant improved loblolly pine. With additional data on stand productivity among clonal, full-sib, and half-sib loblolly pine seedlings and with improvements in production and distribution of clonal stock, a greater proportion of forest landowners may seek to invest in genetically improved loblolly pine.
Results from this study suggest it is important to understand the response of an individual clone in growth and physiology under operational conditions with site specific management for the sustained productivity of the site. Adequate testing of highly selected genotypes should be continued to minimize risks and maximize productivity and uniformity.
Acknowledgements
We would like to thank Mr. Nicholas Mustoe and Mr. Allan Humphrey for their help in field and lab work. We would also like to thank Arborgen© for information on the clones and the Arkansas Forestry Commission and Western Gulf Tree Improvement Cooperative for information on the 3-star half-sibling seedlings developed by the cooperative and grown by the Commission. Research was funded by the Arkansas Forest Resources Center, co-located with the University of Arkansas at Monticello School of Forestry and Natural Resources, Monticello, AR (USA).
References
Gscholar
Gscholar
Gscholar
Online | Gscholar
Gscholar
CrossRef | Gscholar
Authors’ Info
Authors’ Affiliation
University of Georgia, Warnell School of Forestry and Natural Resources, Athens, GA (USA)
Louisiana Tech University, School of Forest Resources, Ruston, LA (USA)
West Virginia University, Morgantown, WV (USA)
University of Arkansas at Monticello, Arkansas Forest Resources Center, Monticello, AR (USA)
USDA Forest Service, Southern Research Station, Monticello, AR (USA)
Corresponding author
Paper Info
Citation
Sharma S, Adams JP, Schuler JL, Ficklin RL, Bragg DC (2016). Effect of seedling stock on the early stand development and physiology of improved loblolly pine (Pinus taeda L.) seedlings. iForest 9: 690-695. - doi: 10.3832/ifor1725-009
Academic Editor
Alberto Santini
Paper history
Received: May 31, 2015
Accepted: Feb 22, 2016
First online: May 12, 2016
Publication Date: Oct 13, 2016
Publication Time: 2.67 months
Copyright Information
© SISEF - The Italian Society of Silviculture and Forest Ecology 2016
Open Access
This article is distributed under the terms of the Creative Commons Attribution-Non Commercial 4.0 International (https://creativecommons.org/licenses/by-nc/4.0/), which permits unrestricted use, distribution, and reproduction in any medium, provided you give appropriate credit to the original author(s) and the source, provide a link to the Creative Commons license, and indicate if changes were made.
Web Metrics
Breakdown by View Type
Article Usage
Total Article Views: 46779
(from publication date up to now)
Breakdown by View Type
HTML Page Views: 39947
Abstract Page Views: 2532
PDF Downloads: 3141
Citation/Reference Downloads: 33
XML Downloads: 1126
Web Metrics
Days since publication: 3544
Overall contacts: 46779
Avg. contacts per week: 92.40
Article Citations
Article citations are based on data periodically collected from the Clarivate Web of Science web site
(last update: Mar 2025)
Total number of cites (since 2016): 1
Average cites per year: 0.10
Publication Metrics
by Dimensions ©
Articles citing this article
List of the papers citing this article based on CrossRef Cited-by.
Related Contents
iForest Similar Articles
Research Articles
A comparative study of growth and leaf trait variation in twenty Cornus wilsoniana W. families in southeastern China
vol. 10, pp. 759-765 (online: 02 September 2017)
Research Articles
Comparison of range-wide chloroplast microsatellite and needle trait variation patterns in Pinus mugo Turra (dwarf mountain pine)
vol. 10, pp. 250-258 (online: 11 February 2017)
Research Articles
Seedling emergence capacity and morphological traits are under strong genetic control in the resin tree Pinus oocarpa
vol. 17, pp. 245-251 (online: 16 August 2024)
Research Articles
Patterns of genetic variation in bud flushing of Abies alba populations
vol. 11, pp. 284-290 (online: 13 April 2018)
Research Articles
Genetic variation and heritability estimates of Ulmus minor and Ulmus pumila hybrids for budburst, growth and tolerance to Ophiostoma novo-ulmi
vol. 8, pp. 422-430 (online: 15 December 2014)
Research Articles
Genetic variation of Fraxinus excelsior half-sib families in response to ash dieback disease following simulated spring frost and summer drought treatments
vol. 9, pp. 12-22 (online: 08 September 2015)
Research Articles
Comparison of genetic parameters between optimal and marginal populations of oriental sweet gum on adaptive traits
vol. 11, pp. 510-516 (online: 18 July 2018)
Research Articles
Preliminary study on genetic variation of growth traits and wood properties and superior clones selection of Populus ussuriensis Kom.
vol. 12, pp. 459-466 (online: 29 September 2019)
Research Articles
Clonal structure and high genetic diversity at peripheral populations of Sorbus torminalis (L.) Crantz.
vol. 9, pp. 892-900 (online: 29 May 2016)
Research Articles
Genetic control of intra-annual height growth in 6-year-old Norway spruce progenies in Latvia
vol. 12, pp. 214-219 (online: 25 April 2019)
iForest Database Search
Search By Author
Search By Keyword
Google Scholar Search
Citing Articles
Search By Author
Search By Keywords
PubMed Search
Search By Author
Search By Keyword

