Juvenile growth response of European beech (Fagus sylvatica L.) to sudden change of climatic environment in SE European trials
iForest - Biogeosciences and Forestry, Volume 2, Issue 6, Pages 213-220 (2009)
doi: https://doi.org/10.3832/ifor0519-002
Published: Dec 22, 2009 - Copyright © 2009 SISEF
Research Articles
Collection/Special Issue: COST Action E52 Meeting 2008 - Florence (Italy)
Evaluation of beech genetic resources for sustainable forestry
Guest Editors: Georg von Wühlisch, Raffaello Giannini
Abstract
The aim of the study was to analyse provenance tests of beech situated close to the south-eastern continental limits of the species, in order to develop a response model of adaptation and plasticity of populations on evolutionary-ecological basis, following sudden climatic changes, as a result of transplanting. Modelling of juvenile height was performed with the help of ecodistance variables. The concept of transfer analysis and ecodistance is based on the hypothesis that phenotypic response to macroclimatic changes depends on the inherited adaptive potential of the population and on the magnitude and direction of experienced environmental change. In common garden experiments, the transfer to the planting site is interpreted as simulation of environmental change. The application of ecodistance of transfer for evaluating common garden experiments provides much needed quantitative information about response of tree populations to predicted climatic changes. The analysis of three field experiments of European beech in SE Europe indicates that macroclimatic adaptation patterns exist in juvenile growth and justify restrictions of use of reproductive material on the basis of evolutionary ecology. The presented model illustrates that response to climatic change is regionally divergent, depending on testing conditions and on hereditary traits. In particular, climatic warming in the central-northern part of the range may lead to production increase. However, under the stressful and uncertain conditions at the lower (xeric) limit of the species, growth depression and vitality loss are predicted. The deviating behaviour of higher elevation provenances support their separate treatment. The results may be utilised in climate change adaptation and mitigation policy in forestry and nature conservation, to revise rules for use of reproductive material and also for validating evolutionary and ecological hypotheses related to climate change effects.
Keywords
Genetic adaptation, Provenance test, Common garden, Phenotypic stability, Ecodistance, Fagus sylvatica
Introduction: climatic selection and adaptation strategy
Different hypotheses on the adaptation strategy of trees are co-existing in contemporary genetics and ecology. With regard to predicted climate scenarios, scarcity of reliable information on responses to macroclimatic changes is a central problem and obstacle. In order to formulate realistic predictions, both the nature of genetic adaptation to past and current climate, and the level of sensitivity to sudden environmental changes have to be understood and properly interpreted. In the context of large-scale climatic changes, macroclimatic adaptation is an important component to study and evaluate. It is the fraction of within-species adaptive genetic diversity which is attributable to adaptation to macroclimatic factors.
Although climatic selection might act more reliably on local, microclimatic level, macroclimate is exclusively considered here mainly for three reasons: climatic scenarios utilized for forecasting describe changes on macro-level only, and on the other hand, data on micro- and meso-level climate is in most cases not sufficient for proper analysis. Finally, the extensive sampling pattern of the studied set of populations prohibits a finer-scale approach.
Under selection pressure, genetic resources of populations are adjusted to maintain competitive growth, adapted phenology, reproductivity and tolerance to diseases and pests, i.e., stability and adaptability. Differing direction and intensity of selection pressure within the species’ range exert a disruptive selection effect, which may lead to characteristic, stabilised patterns of adaptive genetic variability. Counting on the strong and lasting effects of local selection, a close (“ecotypic”) adaptation is implicitly assumed for K-strategist tree species such as beech. This assumption has been generally accepted in practical silviculture; a view which has been nourished by classic field experiments with perennials, starting with Clausen et al. ([3]).
However, molecular genetic studies have revealed the effect of strong counteracting forces such as genetic drift and isolation, but first of all the effect of postglacial migration which produced for woody species such as beech characteristic geographic patterns. These patterns follow rather routes of colonisation than ecological conditions ([4], [5], [20]). There are a number of other biotic reasons why the genetic system of tree species may robustly counteract climatic selection ([24]).
Conflicting approaches and unclear role of different factors determining adaptability keep macroclimatic selection still as an open question, in spite of its importance for practical forest management. Adaptation to macroclimate is the basis for setting the rules of reproductive material use, for concepts to conserve genetic resources of species, and for strategies to adapt to and to mitigate expected effects of environmental changes. This raises the following questions:
- what kind of phenotypic response is expected if macroclimatic environment changes;
- how much of observed response is attributable to macroclimatic adaptation;
- what is the role of phenotypical stability;
- what is the relation of macroclimatic to micro-scale (local) adaptation?
In the present study only a part of these problems are addressed.
Tracing macro-climatic selection on quantitative traits
Annual growth and development cycle of beech - as for any other temperate species - is governed besides the photoperiod by the amount of physiologically effective heat sum ([17], [2]) and of course precipitation. As the latter two are unevenly distributed across the range of the species, diverging direction and intensity of climatic selection may be assumed. The consequence of climatic selection, differentiation in phenological behaviour is well reflected by field test results. For example, budbreak of beech shows a clinal East-West pattern: Atlantic coast provenances are late, while Alpine and SE-European continental sources are early flushing ([33], [10], [11]).
Reports on similar patterns are expectable also for growth traits. On the contrary, studies on growth of beech provenances in field tests describe instead of climate-related patterns rather an ecotypic (i.e., unexplained random) type of variation (e.g., [33], [16], [12]), or explain differentiation by the phylogenetic past (e.g., [11]). The term provenance is used here synonymously for transferred population of known origin.
The ecodistance approach of modelling macroclimatic adaptation
For the investigation of macroclimatic adaptation, the concept of ecodistance has been applied. The ecodistance (ecological distance) concept is based on the idea that if populations adapted to certain ecological (climatic) conditions are transferred to a new environment, and all other site factors are kept equal or disregarded, their phenotypic response to climate depends not only on the climatic conditions where the population is actually grown or tested, but also on the ecodistance of transfer, i.e., on the magnitude and direction of environmental change experienced due to the transplanting to the test site, related to the macroclimate they had been adapted to originally. Accordingly, the ecodistance value of a locally adapted population in a test takes the value 0. The concept of transfer analysis and ecodistance ([25], [22], [23], [27]) has been used for the analysis and modelling of data of common garden (provenance) tests. This approach enables a pooled comparison of various test sites and thus increases statistical reliability. Applying ecodistance instead of simple geographic or ecological parameters allows the detection of general patterns of adaptation. An important advantage of the concept is that responses to transfer into new environments may be interpreted as simulations of future climatic changes: a realistic validation of prediction models.
In the transfer analysis, the climatic variable (E) selected to best describe macroclimatic adaptation serves as independent variable, expressed as difference between test site (X t) and location of origin (X o). It may be a simple or complex variable such as drought or continentality index, or a principal component, etc.
The ecodistance (ΔE) is then calculated as (eqn. 1):
For example, if the variable is mean annual temperature, and X t > X o, the positive value of ΔE expresses a simulated warming of the environment through transfer to the site.
Modelling response of populations to transfer
According to the classical additive model of Fisher ([9]) and Wright ([32]), the phenotypic response of an individual or population (Pi) may be described as the sum of the estimated genetic (γi) and the environmental (εi) deviations from the experimental mean (μ - eqn. 2):
Both the genetic and the environmental component may be partitioned for our purposes. Regarding the effect of the environment, response strongly depends on the site potential of the test. The site conditions have a powerful influence on differentiation between populations and on interaction effects. It is therefore advisable to separate the test site potential (T), expressed usually as the local mean of tested populations, and the interaction effect (see further below).
There are two types of genetic response to transfer which may be calculated from a dataset containing data of numerous populations from a set of experimental sites:
a) General or “species-specific” response (G) to macroclimatic change, calculated from pooled data of the observed trait Y from all (t) test sites, and all (p) provenances, providing the function (eqn. 3):
The function supplies quantitative information on the pooled response to changing environment, triggered by the transfer of locally adapted populations into a new ambient. Needless to say that ΔE values for the same provenance are different at every test location.
b) As the various populations investigated may have a different microevolutionary background and have been exposed to selection effects of different nature and intensity, the general response will conceal much of the between-provenance genetic differentiation. Individual, population-specific response (P) of population “p” across test sites, defined as response function per se in recent literature (e.g., [31]). It is indicating individual sensitivity or phenotypic plasticity of the population to changes, in interaction with local site conditions. It is identical with the term “reaction norm” of ecology (eqn. 4):
In case of sufficient data, the function may define the physiological (genetic) optimum for the population in the climatic niche.
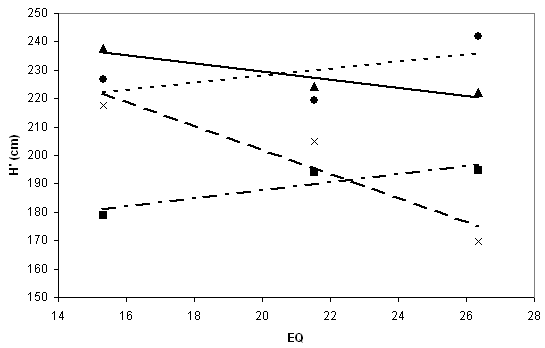
The residual of the recorded population mean at a test site, which is left unexplained by the other additive components, is regarded as interaction (I) and error. Interaction in genetic sense is the part of response which appears as deviation from the average response regressions established across the test sites, causing a change in ranking of populations (see Fig. 3). Strong interaction effects indicate narrower plasticity, and responsiveness to certain (usually extreme) conditions.
Fig. 3 - Reaction norm of corrected heights (H’). The two maritime provenances Aarnink (points) and Grasten (squares), and the two continental ones Tarnawa (triangles) and Plateaux (crosses), display individual differences in response against EQ values of test sites.
The unified additive model to comprise all components is then (eqn. 5):
where the residual error (ε) may include also genetic components unrelated to macroclimatic adaptation.
A case study: analysis of SE European beech provenance trials
In the case study the construction of an additive response model is presented, based on the ecodistance concept. The selected variable for ecodistance calculations is one of multiple options. Environmental effects other than macroclimate (e.g., soil characteristics) are not discussed here because these are beyond the interests of this study.
The transfer analysis had been applied since its first formulation ([25]) for numerous conifer species. For beech, growth response predictions have not been validated thus far by field tests, rather backed by climatic envelopes ([8], [6]). The beech provenance test series ([34]) offers an opportunity to obtain results similar to conifers with a recalcitrant broadleaved species.
Selected ecodistance variable
For ecodistance calculation, Ellenberg’s climate quotient (EQ) has been selected. It is a simple index to express humidity, respectively continentality of climate and has been developed by Ellenberg ([7]) first of all for beech. Recent analyses have proven its high distinctive power to predict presence of beech under Central European conditions ([6]). Ellenberg’s climate quotient is defined as the mean temperature of the warmest month (July - T 07) divided by the annual precipitation (P ann - eqn. 6):
The quotient indicates favourable climatic conditions for beech if the EQ value lies below approximately 26 for Central Europe. In Hungary, zonal sites with EQ values above 28 represent the xeric (lower) limits of the distribution of species ([6]). EQ values of provenances and test sites are given in Tab. 1 and Tab. 2.
Tab. 1 - Data of analysed beech provenance trials (for geographic locations see Fig. 1).
| (A) Geographic, climatic data | ||||||
|---|---|---|---|---|---|---|
| Reg. No. | Country | Location | Altitude a.s.l. (m) | July mean temp (oC) | Annual mean rainfall (mm) | Ellenberg index (EQ) |
| 2012 | Slovenia | Straza | 545 | 19.3 | 1260 | 15.3 |
| 2015 | Hungary | Bucsuta | 200 | 19.7 | 747 | 26.3 |
| 2020 | Slovakia | Mlacik-Tále | 850 | 16.8 | 779 | 21.5 |
| - | mean | - | - | - | - | 21.0 |
| (B) Statistical data | ||||||
| Reg. No. | Average height (H) | Site effect (T) (cm) | STD prov. means | Linear regression slope H’ vs.ΔEQ of provenances | F value between prov. | |
| 2012 | 228.3 | +17.5 | 17.9 | +0.628 | 14.00*** | |
| 2015 | 218.9 | +8.1 | 25.3 | -0.690 | 3.36** | |
| 2020 | 185.2 | -25.6 | 11.3 | -1.572 | 3.40** | |
| - | 210.8 | 0 | - | - | - | |
Tab. 2 - Data of the 12 maritime (M), continental (C) and Alpine (A) beech provenances common in the 3 tests, ranked by their EQ index (for geographic locations see Fig. 1).
| Type | Nr. | Location name, country label | Altitude a.s.l. (m) | July mean temp. (oC) | Annual mean precip. (mm) | EQ of origin |
Corrected mean H’ (cm) | Additive height response (cm) | Average ecodistance (ΔEQ) |
Regression H’vs.EQ across tests |
|---|---|---|---|---|---|---|---|---|---|---|
| A | 35 | Hinterstod, AUT | 1250 | 11.8 | 1380 | 8.6 | 216.4 | +6.54 | 12.46 | +2.660 |
| A | 53 | Postojna, SLO | 1000 | 17.0 | 1718 | 9.9 | 222.5 | +12.58 | 11.20 | -1.432 |
| C | 51 | Horní Planá, CZE | 990 | 13.4 | 1014 | 13.2 | 194.8 | -15.07 | 7.73 | -3.313 |
| C | 6 | Plateux, FRA | 600 | 17.5 | 1223 | 14.3 | 197.5 | -12.37 | 6.69 | -4.239 |
| C | 48 | Jablonec, CZE | 760 | 13.5 | 944 | 14.3 | 203.0 | -6.87 | 6.56 | -1.014 |
| C | 31 | Urach, GER | 760 | 16.4 | 887 | 18.5 | 211.7 | +1.83 | 2.43 | +2.251 |
| M | 17 | Westfield, GBR | 10 | 14.0 | 741 | 18.9 | 214.1 | +4.23 | 2.03 | +2.746 |
| M | 21 | Grasten, DEN | 45 | 16.3 | 810 | 20.1 | 189.3 | -20.57 | 0.96 | +1.458 |
| M | 14 | Aarnink, NED | 45 | 17.5 | 794 | 22.0 | 229.3 | +19.43 | -0.94 | +1.258 |
| M | 13 | Soignes, BEL | 110 | 17.9 | 796 | 22.5 | 214.4 | +4.53 | -1.38 | +0.524 |
| C | 40 | Tarnawa, POL | 540 | 17.6 | 762 | 23.1 | 228.1 | +18.23 | -2.03 | -1.440 |
| M | 67 | Bilowo, POL | 250 | 15.5 | 643 | 24.1 | 216.5 | +6.63 | -2.93 | +1.740 |
Analysed experiments and provenances
On the basis of an unpublished preliminary surveying study ([26]), three experiments of the 1998 series of the all-European beech provenance trials ([34]) have been selected for analysis (Tab. 1a, Tab. 1b). The tests have been chosen within a region of restricted size, to grant a relatively uniform synergy of climatic factors.
The test sites are located in the Carpathian basin, in Hungary, Slovenia and Slovakia, at different elevations (Fig. 1). All three are under the influence of the more or less humid-continental climate of SE Europe. The mid-elevation site in Slovenia provides climatically optimal conditions, while the two other sites are more continental as shown by their Ellenberg indices (Tab. 1a).
Fig. 1 - Location of 10 non-Alpine beech populations selected for analysis, and of the 3 test sites. The distribution range of beech (grey shade) has been provided by EUFORGEN.
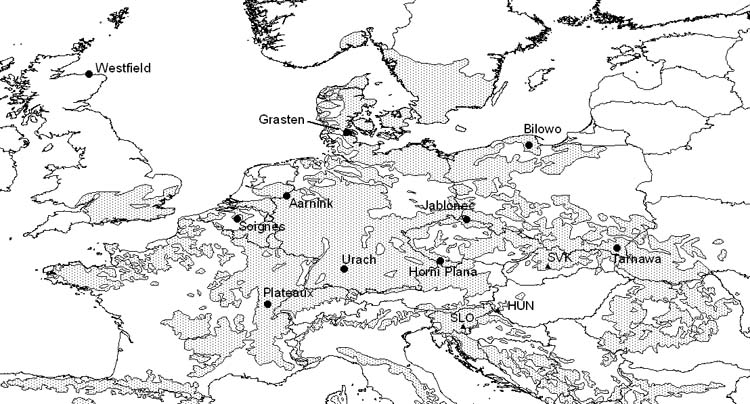
The experiments contain 36 provenances, however not exactly the same ones. 12 populations have been selected from the 36 which are represented in all three tests and where available climatic data seemed to be reliable (Tab. 2, Fig. 1). The processing and digital interpolation of the climatic data was carried out by E. Rasztovits.
Out of the 12 provenances selected, 5 originate from low elevation sites in maritime climate, with EQ indices between 19 and 24. Another 5 populations have been transferred from inland, continental regions where beech is occupying sites at medium elevations. The original sites have generally EQ values below 20, except for Tarnawa, Poland (23.1) and are situated in medium mountains (540 to 990 m). Two Alpine populations originate from altitudes at or above 1000 m with EQ values below 10.
At the warm-continental site in Hungary (EQ = 26.3), all the 12 provenances have been transferred into an environment with increased continentality, higher average temperatures and higher drought stress. On the other hand, in the Slovenian test (EQ = 15.3) the majority of the selected populations has been brought into an environment cooler/ wetter than their original climate.
For the analysis, 8th year heights measured in winter 2005/2006 have been used. Between-provenance F values from variance analysis of the 3 test sites ([26]) are presented in Tab. 1b. In the following analyses only average heights of tests have been used. Obviously damaged and crippled trees have been omitted from the calculation.
Separating components of the additive model
Effect of test site potential differences
The additive test site effect (T) is the difference of test averages from the grand mean of all experiments (210.8 cm, Tab. 1b). Measured average heights of provenances at the three tests were corrected with the test site effect, to make them directly comparable (corrected heights are denoted further as H’). A correction for standard deviation differences between tests was omitted because the range of variation of provenance means indicates the differentiating power of the site (Tab. 1b).
The Slovak site has the lowest site potential, first of all due to its relatively harsh conditions. It shows also the lowest standard deviation of means. At the Hungarian site, differentiation between populations is the strongest, presumably also because of higher climatic stress, close to the climatic limit for beech (i.e., the xeric limit - [27], [15]).
General (“species-specific”) response
Response to transfer has been analysed by two types of regressions: calculating the individual response of provenances to respective ecodistances across sites, and by using means of all three tests for both provenances and ecodistances.
“Mean ecodistance” expresses the general effect of climatic conditions of the tests as experienced by differently adapted provenances. It is calculated from the difference between the average of EQ value of tests (21.0 - Tab. 1a) and the EQ of origin of populations (Tab. 2).
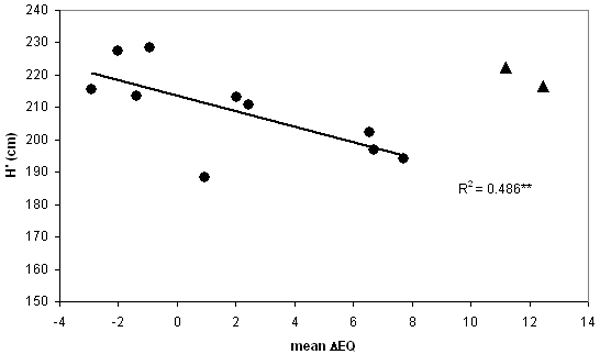
The limited number of observations allowed only the calculation of a linear function instead of the theoretically expected curvilinear one. The data and regression shown in Fig. 2 indicate a significant decline of height towards increasing warming (R2 = 0.486; p<0.01). The Alpine provenances appear as outliers, maybe partly caused by inaccurate climate interpolation at higher elevations, but more probably due to truly different adaptation, as the context of precipitation vs. temperature is modulated by altitude. The analysis by Gömöry ([11]) also points out the divergent behaviour of populations from higher elevations. Therefore these were excluded from further calculations.
Fig. 2 - General response regression for corrected mean height (H’) vs. mean ecodistance of provenances. Means are averages of all 3 tests. Equation is calculated for 10 maritime and continental provenances only, black triangle indicates the two Alpine outliers excluded from the calculation climatic stress, close to the climatic limit for beech (i.e., the xeric limit - [27], [15]).
Comparing response regressions of different provenances across test sites, the calculated slopes show a marked differentiation. A group of mostly maritime provenances show improving performance with warming and dryer conditions (positive slopes), while continental populations display an opposite trend (Tab. 2, Fig. 3). The results propose a relationship between the (climatic) origin and the character of response to changing climate. The connection, expressed by the slope values of the regressions, is significant (R2 = 0.383; p<0.05). This indicates that a general or “species-specific” response (G) may be predicted by using ecodistance and site conditions as independent variables (see later for details - Tab. 3).
Tab. 3 - Results of analysis of variance of mean heights of 10 provenances at 3 locations (uncorrected height data in cm units).
| Effect | SS | DF | MS | F | p |
|---|---|---|---|---|---|
| Provenances | 4946.0 | 9 | 549.6 | 2.62 | 0.039 |
| Sites | 7110.3 | 2 | 3555.1 | 16.95 | 0.001 |
| Interaction and error | 3775.7 | 18 | 209.8 | - | - |
Individual response of populations
Deviation of the population mean from the grand mean represents the individual, population-level additive response (P). Population-specific differences of response across sites suggest also divergent sensitivity to climatic change, thus regression statistics characterise phenotypic plasticity. Low regression slope values indicate stable performance across sites (Tab. 2, Fig. 3).
Tab. 3 shows the results of the analysis of variance of (uncorrected) means of 10 provenances at 3 sites. No surprise that the effect of sites is clearly more significant compared to the effect of provenances.
Interactions
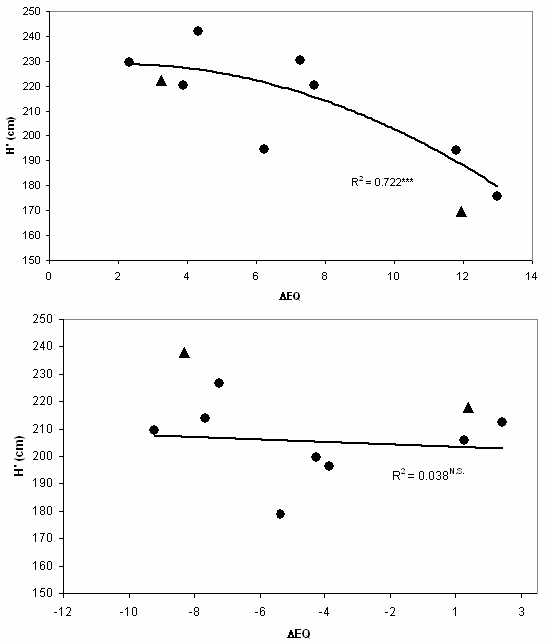
In Fig. 4, response of populations is comparable at two locations, as the horizontal sequence of populations is identical in the graphs. The sequence is the same as in Tab. 2, as populations are ranked by their original EQ values; at the extreme left: Bilowo, Poland. A closer observation leaves no doubt that interactions with local climatic conditions exist. Two provenances are marked for interaction: Tarnawa (POL) and Plateaux (FRA). Both originate from medium elevations and perform at low elevation in Hungary below average, and the opposite is true for Slovenia.
Fig. 4 - Regression of corrected height (H’) of 10 identic provenances with ecodistance. The two sites have strongly differing EQ values (top: Bucsuta, HUN: 26.3; bottom: Straza, SLO: 15.3). The sequence of provenances is the same. Compare the two provenances marked with triangles for interaction: Tarnawa (POL, left) and Plateaux (FRA, right). Both mountain populations perform much better at higher elevation in Slovenia than in Hungary.
Interaction was found confounded with microsite inhomogeneity: in the variance analysis by test locations ([26]) replication × provenance interactions were significant (p = 0.01, not shown) in the Slovak and Hungarian trials, but not in Slovenia. Therefore the interaction component (I) was not separated from the residual (error) component.
Construction of a 3-D response surface model
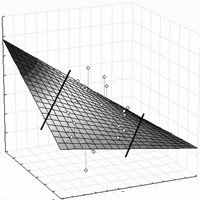
Fig. 5 - Linear surface model of height response of provenances. The model shows corrected height (H’) as dependent, and ecodistance of provenances (ΔEQ), respectively EQ value of sites (SEQ) as independent variables. Positive EQ values of ecodistance (to the right on the X axis) stand for simulated warming effect. Lines separate the part of the surface not supported by data (The selected linear polynomial simplifies the curvilinear response shown for the Bucsuta site in Fig. 4).
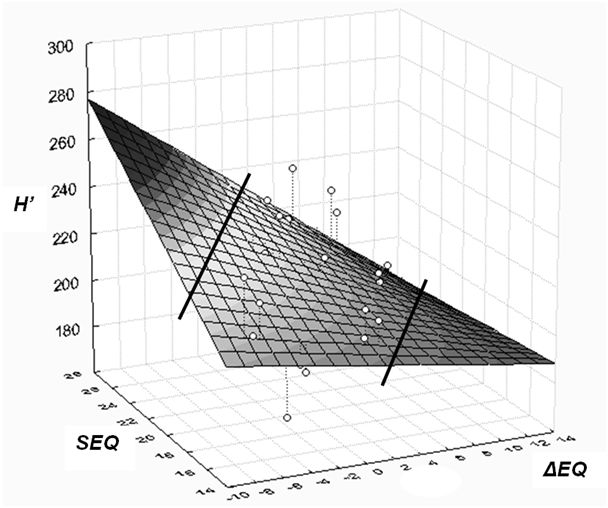
Based on the previous results, a three-dimensional model is presented which expresses that height growth response to macroclimatic change depends on the climatic distance by which the adapted populations were moved (ΔEQ), and on the climatic environment where they are tested (siteEQ). Corrected height (H’) serves as dependent variable. Although the regression is theoretically exponential, due to the low number of tested sites, only a linear response surface has been fitted on the data (Fig. 5). Calculated for 10 provenances, the equation of general height response is (eqn. 7):
The proportion of variance accounted for is 35.78%, the coefficient R = 0.598 (p<0.001), the individual differences between provenances left unconsidered. The distribution of residuals is even, indicating a balanced regression. Certain parts of the response surface are not supported by data and are separated by lines in Fig. 5. The regression surface illustrates and summarises some important conclusions:
- increasing, positive EQ values, i.e., warming and more arid conditions lead to decreasing height growth and vitality;
- the effect of worsening of climatic conditions increases toward the lower (xeric) limit of distribution (EQ = 28);
- the interaction of site and macroclimatic adaptation is significant, an equation excluding the interaction component explains only 27.5% of the variation.
Discussion
Modelling adaptive response to macroclimatic change
Modelling of expected response has to express that adaptation is an evolutionary-genetic issue. Present ecological models of phenotypic behaviour usually treat temperate tree species, including beech as monolithic, genetically uniform entities (e.g., [17], [2], [6]). Another approach is the application of process-based genetic simulations which describe genetic processes on local level ([18]). Both approaches necessarily disregard within-species adaptive differentiation: ecological models assume functional properties of species uniform across space. This is a general problem of bioclimatic models ([28], [13]).
The special feature of the selected set of experiments is, that due to the specific climatic relations between test locations and provenances, it provides a unique opportunity to study adaptive differentiation and responses to climatic warming. Detecting adaptive responses for a species exhibiting a strongly developed plasticity ([33], [16], [11]) did not promise easy results. The selected variable EQ applied for the ecodistance approach seems to describe, however, macroclimatic conditions sufficiently well, at least for Central Europe and low to medium elevations.
The study was successful in detecting that
- adaptation (and consequently, selection effect) to macroclimate exists in spite of counteracting genetic and evolutionary forces;
- response of provenances strongly depends on the climatic conditions at origin and at the test, i.e., ecological distance is a valid concept for explaining responses;
- site potential and the local climatic conditions decide not only height response and its differentiation, but also interactions;
- a general, species-specific component of genetic response could be identified beside the individual differences of populations;
- interaction was noticeable mainly in relation to altitudinal changes.
The regression surface shown in Fig. 5 summarises the general trend of response to macroclimatic change. At the warm-continental site in Hungary, all provenances had been moved into warmer and drier conditions and the calculated polynomial shows a clear decline of height growth beginning from ΔEQ value 4 (Fig. 5). Such a strong effect is not visible at the site with lowest EQ value, in Slovenia, where most populations came into a cooler and wetter (i.e., less stressful) environment than original. In this case growth depression with growing ecodistance was not detectable.
Regarding the mean performance of individual populations in the average of sites, the Dutch provenance Aarnink was the best, and Grasten from Denmark the worst (Tab. 2, Fig. 3). This had little or nothing to do with the (macroclimatic) distance from the test sites.
The individual response of a population to changing environmental conditions is described by the term phenotypic plasticity. Between-provenance differences in plasticity are detected by testing growth response along an ecological gradient, in our case by calculating regression of height vs.EQ values of the test sites (Fig. 3).
Caveats and limitations to the analysis
In the case study an attempt was made to quantify and model the genetic effect of macroclimatic selection on juvenile height growth of beech. A trait important for early-stage competition, height is integrating effects of numerous growing seasons, which makes it logically related to climate which represents also an average of annual fluctuations. Climate means hide however year-to-year and local deviations from long term averages, although irregular extreme events may have a decisive selection effect ([1]). Climate means should be therefore regarded rather as surrogates for extremes.
For analysis of climatic adaptation, large-scale international trials seem to be ideal, as they are established with natural populations of known origin, sampled across a large area. It is a pity and a serious fault of international provenance research that sufficiently reliable, detailed climate data are missing in most cases. Ecological characterisation was traditionally confined to description of geographic parameters (coordinates, altitude). The selective role of concrete climatic parameters has been analysed in detail only in recent literature, as interpolated, digital databases are increasingly accessible (e.g., [29], [30], [27]). Interpolations may, however, carry considerable bias especially for higher elevations and regions with complex topography. The relatively low number of test sites and of populations, certainly limits the general validity of results. However, it is suspected, that synergy of climatic components might change across larger regions and therefore an evaluation in an ecologically restricted area might bring better results as pooling all available data without preliminary screening.
The analysed data were measured in juvenile stage. Switches in ranking may be expected up to higher ages in beech, and early age-age correlations are unreliable ([16]). Also, results refer to the investigated populations and sites and may not be fully applicable in other environments. Therefore the application of the method on extended datasets is absolutely necessary.
Also, modelling the evolutionary-genetic background of adaptive response is still not precise enough for predictions as it fails to regard biotic interactions and migration limitations ([13], [15]) or human interference such as planned forest management ([28]).
Finally an additional factor causing estimation errors should be mentioned. This lies in the unavoidable contradiction between the conditions of natural regeneration and selection populations are adapted to, and the necessarily different, artificial character of nursery raising and outplanting in comparative tests. In common gardens, populations experience transfer into rather artificial environments. This has little to do with natural conditions of regeneration, but one should remember that the aim of these studies is a) to derive information on use of reproductive material, and b) to forecast effects of man-made climatic changes. Neither of them are typically natural processes.
Understandably, a simulation of the natural ecological demands of a tree species in the field tests would cause a further loss of precision of response identification. Thus, the planned experimentation itself compromises the exact determination of genetic response: an unsolvable contradiction and an unexpected parallel to Heisenberg’s uncertainty principle in quantum physics ([27]).
Conclusions
Implications for the management and conservation of beech
The existence of macroclimatic adaptation patterns in juvenile growth justifies genetically based regulations for use of reproductive material. Regarding the sensitivity of beech to macroclimatic changes, the results show that adaptive pattern and plasticity of the species is fairly comparable to better explored conifer species such as pines, spruces ([25], [29], [30], [27], [31]).
Main conclusions for reproductive material use are:
- it would be more appropriate to use ecologically-based criteria instead of geographic-based ones to define recommended directions and limits of transfer;
- transfer effects are not similar in different part of the distribution area, in particular:
- in the range of the climatic optimum, in the area centre, and towards the thermal limit (northward) transfers are less critical;
- proposed separate treatment of higher elevation populations is supported by the deviating behaviour of provenances from above 1000m;
- stressful and uncertain conditions at the lower (xeric) limit of the species demand there more rigorous rules for use and conservation.
Observations of mortality events close to the lower (xeric) limit of the species indicate that stability and vitality of populations depends not only on growth rate modelled from test results. Extreme weather events (droughts) may weaken physiological condition of populations relatively fast and may lead to insect and disease outbreaks in regions generally suitable for the species ([1], [19]). Therefore, when defining maxima of allowable (ecological) distance of transfer, the principle of precaution should be observed, i.e., limits should be drawn stricter than the results of response regressions suggest.
Regarding climate change, the most important question is how populations react to warming, i.e., to positive ΔEQ values. The test in Hungary did detect sensitivity to EQ differences above the value of 4 (Fig. 4).
Closer to the xeric/continental limit, smaller changes are already limiting presence ([6]). The results support the opinion that predicted climatic changes will not have serious consequences and even lead to production increase in the central-northern part of the range and at higher elevations as shown for conifers ([27]). It is strongly cautioned from overestimating the plasticity potential found in this experiment, for regions close to the lower (xeric) limit of the range, furthermore also because the results obtained at juvenile age may not be maintained in later age.
Differences in growth performance and plasticity of provenances left unexplained by macroclimatic factors sustain earlier assumptions that local genetic adaptation also exists (“ecotypes”) and maybe also epigenetic effects; neither of them have been investigated in detail in this analysis. It seems that in beech, a population- (stand-) level differentiation co-exist with large-scale adaptedness and with significant plasticity. This supports the maintenance of selection of stands for reproductive material procurement (seed stands).
Application and advantages of the proposed approach
The proposed approach provides otherwise inaccessible information on the real-world effects of expected climatic changes. The success of evaluation depends of course on the characteristics of the dataset: number and quality of test sites, number and differentiation of populations and last not least, the reliability of recorded data.
The obtained results may be applied in adaptation and mitigation policy in forestry and related fields such as nature and gene conservation, e.g., for planning human-aided migration ([21]). Typical uses are rules of forest reproductive material use, assessment of local, adapted populations or conservation strategy of marginal populations ([24]).
The results may be useful also for testing or validating ecological models, evolutionary and ecological concepts and hypotheses related to climate change effects (see review of [14], [27], [15]). The design and concept of presently exising tests are however unsuitable to elucidate problems such as micro-scale adaptation, ongoing selection in extant populations, or the importance of genetic carryover (epigenetic) effects. These questions need further, very carefully planned experimentation.
Acknowledgements
The financial support of the Hungarian government research fund NKFP 6/047/2005 and of EU-FP6 Program “EVOLTREE” are gratefully acknowledged. Similarly, we are grateful to two anonymous reviewers for very helpful comments improving the text, to László Nagy (Forest Research Inst., Sárvár) and to associates of the Faculty’s Ecology research team’ and for providing climatic data and support in data processing. Further support was provided by the COST E52 research team on Beech Genetic Resources, and also by and K. Kramer (Wageningen) in data collection, fruitful discussions and critics.
References
Gscholar
Gscholar
Gscholar
Gscholar
Gscholar
Gscholar
Gscholar
Gscholar
Gscholar
CrossRef | Gscholar
Gscholar
CrossRef | Gscholar
Gscholar
Gscholar
Gscholar
Gscholar
Gscholar
Gscholar
Gscholar
Gscholar
Gscholar
Authors’ Info
Authors’ Affiliation
E Rasztovits
University of West Hungary, Institute of Environmental and Earth Sciences, P.O. Box 132, 9401 Sopron (Hungary)
Slovenian Forestry Institute, Vecna pot 2, 1000 Ljubljana (Slovenia)
Technical University Zvolen, Faculty of Forestry, T.G. Masaryka 24, 96053 Zvolen (Slovakia)
Croatian Forestry Institute, Cvjetno naselje 41, 10450 Jastrebarsko (Croatia)
Corresponding author
Paper Info
Citation
Mátyás C, Bozic G, Gömöry D, Ivankovic M, Rasztovits E (2009). Juvenile growth response of European beech (Fagus sylvatica L.) to sudden change of climatic environment in SE European trials. iForest 2: 213-220. - doi: 10.3832/ifor0519-002
Academic Editor
Marco Borghetti
Paper history
Received: Feb 04, 2009
Accepted: Oct 14, 2009
First online: Dec 22, 2009
Publication Date: Dec 22, 2009
Publication Time: 2.30 months
Copyright Information
© SISEF - The Italian Society of Silviculture and Forest Ecology 2009
Open Access
This article is distributed under the terms of the Creative Commons Attribution-Non Commercial 4.0 International (https://creativecommons.org/licenses/by-nc/4.0/), which permits unrestricted use, distribution, and reproduction in any medium, provided you give appropriate credit to the original author(s) and the source, provide a link to the Creative Commons license, and indicate if changes were made.

Web Metrics
Breakdown by View Type
Article Usage
Total Article Views: 59485
(from publication date up to now)
Breakdown by View Type
HTML Page Views: 47165
Abstract Page Views: 5085
PDF Downloads: 6037
Citation/Reference Downloads: 54
XML Downloads: 1144
Web Metrics
Days since publication: 6053
Overall contacts: 59485
Avg. contacts per week: 68.79
Article Citations
Article citations are based on data periodically collected from the Clarivate Web of Science web site
(last update: Mar 2025)
Total number of cites (since 2009): 36
Average cites per year: 2.12
Publication Metrics
by Dimensions ©
Articles citing this article
List of the papers citing this article based on CrossRef Cited-by.
Related Contents
iForest Similar Articles
Research Articles
Local adaptation at a small geographic scale observed in Juniperus excelsa populations in southern Turkey
vol. 14, pp. 531-539 (online: 24 November 2021)
Research Articles
Comparison of genetic parameters between optimal and marginal populations of oriental sweet gum on adaptive traits
vol. 11, pp. 510-516 (online: 18 July 2018)
Research Articles
Growth, spring phenology and stem quality of four broadleaved species assessed in provenance trials in the Netherlands - Implications for seed sourcing
vol. 18, pp. 242-251 (online: 22 September 2025)
Research Articles
Identification and molecular characterization of LTR and LINE retrotransposable elements in Fagus sylvatica L.
vol. 2, pp. 119-126 (online: 10 June 2009)
Research Articles
Comparison of range-wide chloroplast microsatellite and needle trait variation patterns in Pinus mugo Turra (dwarf mountain pine)
vol. 10, pp. 250-258 (online: 11 February 2017)
Research Articles
Seedling emergence capacity and morphological traits are under strong genetic control in the resin tree Pinus oocarpa
vol. 17, pp. 245-251 (online: 16 August 2024)
Research Articles
Patterns of genetic diversity in European beech (Fagus sylvatica L.) at the eastern margins of its distribution range
vol. 10, pp. 916-922 (online: 10 December 2017)
Research Articles
Genetic variation of Fraxinus excelsior half-sib families in response to ash dieback disease following simulated spring frost and summer drought treatments
vol. 9, pp. 12-22 (online: 08 September 2015)
Research Articles
Genetic variation and heritability estimates of Ulmus minor and Ulmus pumila hybrids for budburst, growth and tolerance to Ophiostoma novo-ulmi
vol. 8, pp. 422-430 (online: 15 December 2014)
Research Articles
Patterns of genetic variation in bud flushing of Abies alba populations
vol. 11, pp. 284-290 (online: 13 April 2018)
iForest Database Search
Search By Author
Search By Keyword
Google Scholar Search
Citing Articles
Search By Author
Search By Keywords
PubMed Search
Search By Author
Search By Keyword


