
JRC study on harvested forest area: resolving key misunderstandings
iForest - Biogeosciences and Forestry, Volume 14, Issue 3, Pages 231-235 (2021)
doi: https://doi.org/10.3832/ifor0059-014
Published: May 07, 2021 - Copyright © 2021 SISEF
Commentaries & Perspectives
Abstract
A recent study on forest harvest in the EU (Ceccherini et al. 2020) reported a strong increase in clear-cut harvested area in recent years, based on remote sensing information. This triggered a heated debate and many critical comments. Apart from several fair and constructive criticisms, which were welcome, we found that some comments have been either not based on evidence or affected by serious misunderstandings. Here we clarify some technical aspects that were omitted or misrepresented in the public debate. Overall, the original study used in a scientifically correct way the best information available at that time. After the study was published, a previously undocumented inconsistency in the time series emerged in the original dataset used. After correcting for this inconsistency, updated results confirm an increase in clear-cut harvested area, but not as abrupt as originally reported. Contrary to what many critics say, this information should be seen as complementing and not necessarily contradicting country statistics, because the latter typically refer to total harvest (including thinning, etc.) and not clear-cut only. Finally, it should not be overlooked that the main aim of the original study was to offer a vision for integrating satellite data into the monitoring of forest resources. This was achieved: the JRC study showed the potential (and limitations) for high-resolution satellite maps to track the temporal evolution of clear-cut forest harvest in EU.
Keywords
Harvested Forest Area, Remote Sensed Datasets, Global Forest Change (GFC), High-Resolution Satellite Maps
This commentary, based on a JRC note ([5]), complements with additional textual and visual information the rebuttal that we provided in Nature ([3]) to the comments by Palahí et al. ([7]) and Wernick et al. ([10]). Specifically, here we show and discuss additional figures on: (i) the correct use of the original dataset, based on documentation available in the Global Forest Change (GFC) / Global Forest Watch (GFW) websites; (ii) the comparison of our data with recent country statistics on natural disturbances; and (iii) the comparison of our data with country statistics on harvest.
The key messages emerging from our rebuttal and this commentary are:
- Based on a new extensive validation exercise carried out for Sweden and Finland, our original results were partly rectified: the increase in clear-cut harvested forest area now appears about one third less steep, i.e., +35% (±16%) in 2016-2018 vs. 2011-2015 relative to a +54% originally reported for the same periods in Sweden and Finland (see [3]). Results, therefore, look less “abrupt” than in the original study. When approximately extrapolated at EU level, these new findings would reduce the original increase in clear-cut area from about 50% to about 30% for the same periods. All evidence indicates that we made a correct use of the information available from the GFC dataset (see section 1) and that the change in results is entirely due to the undocumented change in algorithm occurred in 2015 in the GFC dataset, which affected its time series consistency. The first documentation of this inconsistency is in Palahí et al. ([7]), and the first attempt to quantify its impact is in our reply. This undocumented change in algorithm is a glaring error in the GFC documentation, not a “methodological error” by the JRC. It is very unfortunate that the inconsistency of the GFC dataset for the year 2015 was undocumented, as it affected our paper and dozens of other similar publications in recent years, but it is positive that after many years it has been finally recognized [1]. This helped us to make a preliminary assessment of the impact on our results, and hopefully will help others to avoid similar problems when using the same dataset. Given the huge importance and the widespread use of the GFC dataset, any transparent reprocessing that will make it temporally more consistency will be welcomed.
- Although our approach to estimate the impact of natural disturbances on harvested forest areas is crude, available evidence indicates that it correctly captures the trend (see section 2).
- Our method aimed at capturing essentially clear-cuts, due to the spatial resolution of the Landsat pixel (30 × 30 m), and not smaller-scale forestry activities such as thinning and selective loggings, which represent a large share of total harvest in many EU countries. As it can be evinced from the main figure in the original paper, the biomass corresponding to the harvested clear-cut areas observed in our study is less than 50% of the total harvested biomass reported in country statistics at EU level. While this was unfortunately not adequately highlighted in the original abstract (a communication error from our side), it would be expected that those publicly criticizing a paper read it in full, including carefully checking the figures.The above indicates that the “perceived” contradiction between our results and country statistics is largely due to misunderstandings and incorrect comparisons (see section 3). Our results should be interpreted as a warning on a recent increase in clear-cuts observed by satellites, not necessarily as a criticism to country statistics.
Beyond the results, our study was the first one showing a high-resolution map and temporal evolution of clear-cut harvest in Europe. In this sense, we believe that our study represents an important step forward in combining Earth observation and big data analytics for complementing country statistics in the monitoring of forest resources.
1. On the correct use of the Global Forest Change dataset
The comment by Palahí et al. ([7]) starts noting an inconsistency in the Global Forest Change (GFC) time series, and in particular a “major enhancement” of the detection algorithm in 2015. It notes that “the Global Forest Watch (GFW) website warns about these inconsistencies and advises against using the GFC product for temporal trend analyses” and then concludes that “The abrupt changes [in [2]] are largely an artefact stemming from incorrect use of the GFC data time-series". The alleged “incorrect use of GFC data” appears a key criticism by Palahí et al. ([7]). This section checks this claim.
Our rebuttal already explained that the change of algorithm in 2015 was totally undocumented: the websites by GFC[2] and GFW [3] include warnings on combining two time series, 2001-2010 and 2011-2019 (and this was clearly acknowledged in [2]), but do not include any warning against trend analyses after 2012.
Here we provide further textual and visual evidence that, in recent years, the GFC time series has been extensively used in the scientific literature to assess the impact of forestry activities as in our paper.
Specifically, below we report four recent examples where the GFC dataset was tested. In these cases, abrupt increases in forest cover loss were shown between 2015 and 2016 (as in our study) without being discussed as the result of potential inconsistencies in the time series.
- Rossi et al. ([8]), assessing forest harvesting in Norway, concluded that “Overall, [GFC] proved to be a useful dataset for the purpose of assessing harvesting activity under the given conditions”. A marked increase in harvest is shown in 2016 (their figure 12), but it is not discussed as a possible inconsistency in the dataset.
- Galiatsatos et al. ([4]), testing the GFC dataset in Guyana, concluded that “when suitably calibrated for percentage tree cover, the Global Forest Change datasets give a good first approximation of forest loss (and, probably, gains)”. The authors also note that “in countries with large areas of forest cover and low levels of deforestation, these data should not be relied upon to provide a precise annual loss/gain or rate of change estimate for audit purposes without using independent high-quality reference data” - however, this latter recommendation seems to refer to the fact that deforestation requires estimating both forest cover losses (more certain) and gains (more uncertain). Our paper focused on forest cover loss only. Furthermore, Galiatsatos et al. ([4]) show an abrupt increase in harvest in 2016 (their fig. 7), but it is not discussed as the result of a possible inconsistency in the dataset.
- Shimizu et al. ([9]), in Japan, concluded that “the Global Forest Change map can be used to detect larger forest disturbances, but it should be used cautiously because of the substantial commission error for small-scale disturbances”. In particular, the authors indicate that GFC shows good accuracies for forest disturbances larger than 3 ha. In this regard, it should be noted that disturbances > 3 ha represent about two thirds of the harvested forest area detected by Ceccherini et al. ([2] - Extended data Fig. 5). Shimizu et al. ([9]) show an abrupt increase in harvest in 2016 (their fig. 5), but it is not discussed as a possible inconsistency in the dataset.
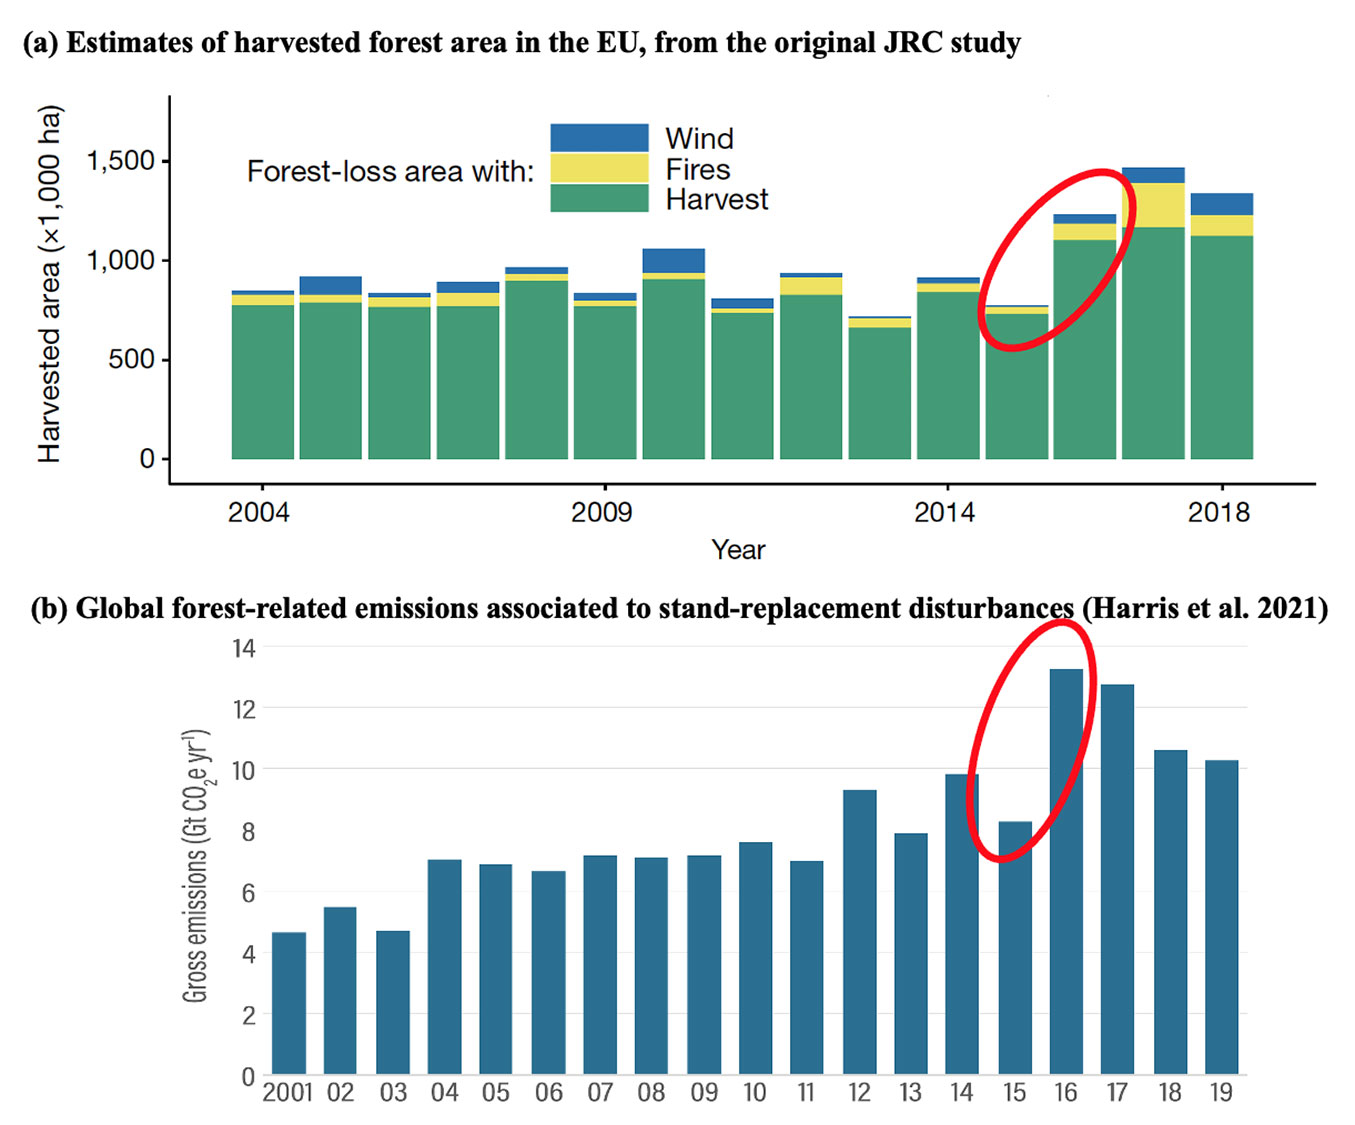
Furthermore, in Fig. 1 we compare the results from our original paper (Fig. 1a) with a paper in a high-level journal ([6] - Fig. 1b), which fully relies on pixel count area estimates from the GFC dataset. Also in this case, a clear discontinuity in gross emissions emerges between 2015 and 2016 (red oval), and it is not specifically discussed. It should be noted that [6] does not specifically focus on trends, and that Fig. 1b is in their Extended data. Therefore, the noted inconsistency in the GFC dataset does not directly affects the general findings of their paper. Nevertheless, it is worth noting that Harris et al. ([6]), which notably includes developers of the GFC as co-authors, mentions that “one algorithm covers 2011-2019” and that “Gross emissions can be estimated annually”. These are key methodological assumptions we followed in our paper when producing and discussing the results, but also those aspects flagged as “incorrect” use of the dataset by Palahí et al. ([7]), which also notably includes a developer of the GFC as co-author.
Fig. 1 - (a) Estimates of harvested forest area in the EU, from the original JRC study ([2]), compared to (b) gross forest-related emissions associated to stand-replacement disturbances (natural and anthropogenic) observable in Landsat imagery, 2001-2019 ([6] - Extended data fig. 9). Both studies use the GFC dataset and show similar discontinuities in the time series between 2015 and 2016 (red ovals). See the respective references for details.
It is striking to see how the same authors treat so differently the very same issue in different papers.
Another example is the New York Declaration on Forests. It progress assessment (⇒ https://forestdeclaration.org/goals/goal-1), aimed at informing signatory Governments on trends of global forest cover loss, reported the same spike in 2016 for which we have been criticized. Also in this case, authors were not aware of the 2015 problem.
Overall, since it is now abundantly clear that the change in algorithm was totally undocumented when our study was published, we do not think that it can be presented as a “methodological error” by the JRC. If nobody knew about this problem, how could the JRC? This change partially misled not only our paper, but dozens of other high-level analyses, similar in scope to the JRC paper. This may have repercussions that go well beyond our paper.
Retrospectively, the JRC original study could have made a stronger validation of results, something largely addressed in the rebuttal. However, it is like to say “we should have worn masks in January 2020”. If we knew of how serious COVID was, we would have worn masks before. But nobody knew it. All the scientific literature used the GFC data for years without knowing of the 2015 problem.
2. Comparing our data with recent country statistics on natural disturbances
Palahí et al. ([7]) criticized the method used by Ceccherini et al. ([2]) to detect natural disturbances, claiming that it affected the trend of harvest reported in the original study. As explained in our rebuttal ([3]), recent data made available by 14 European countries ([1]) allow to check this claim.
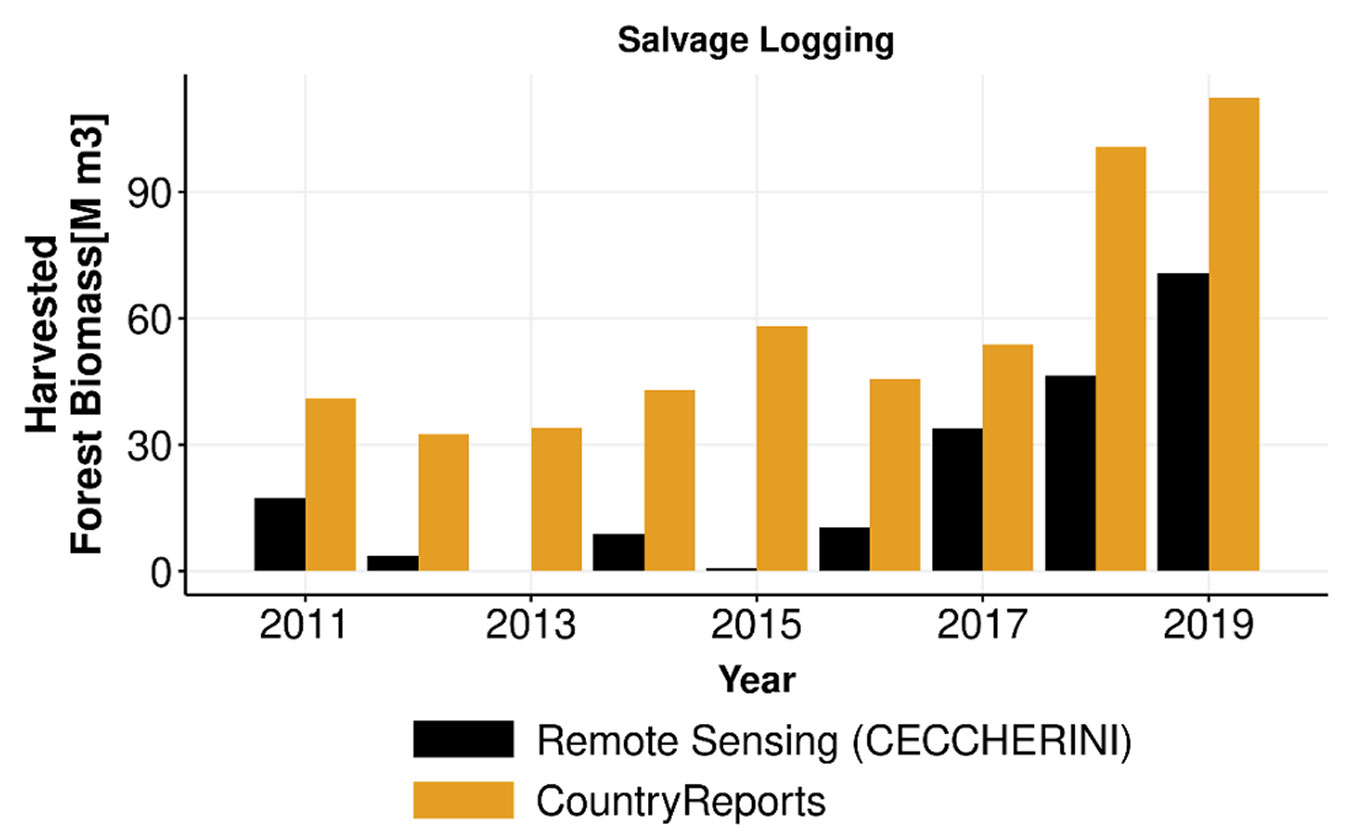
As shown in Fig. 2, our estimates of harvested biomass due to natural disturbances (due to windthrows and insects) are lower than the absolute values of salvage logging statistics from countries ([1]), but show the same recent increasing trend (Fig. 2). Since our method detects anomalies in forest cover losses (in other words, major events but not the “background” level of natural disturbances), somehow lower values from those reported by countries are expected, because the latter include all natural disturbances. However, for the purpose of our study, detecting the trend was more important.
Fig. 2 - Time series of forest biomass loss associated with “salvage logging” from our original study ([2], in black) and country reports (in orange) for 14 European countries (based on [1]). Salvage loggings dataset has been collected in 14 EU Member States by searching national datasets and/or consulting with national experts. Through the Standing Forestry Committee under the EC, the following Member States validated and acknowledged data on salvage loggings and/or provided additional information: Austria, Bulgaria, Croatia, Czechia, Estonia, France, Finland, Germany, Hungary, Lithuania, Poland, Slovakia, Slovenia and Sweden. It is important to note that the time series where annual data on salvage loggings are available varies among Member States.
Furthermore, it is important to note that the magnitude of the recent rise in natural disturbance events varies significantly between countries, with central Europe (Germany, Austria, Czechia, Poland, etc.) showing a large pulse of bark beetle infestations. On the other hand, comparing time series of harvest statistics from salvage logging with remote sensing retrievals should be made with caution because of possible lags (e.g., salvage logging may take a few years after the disturbance takes place) and uncertainty on the fraction of timber that is collected after the disturbance.
Overall, based on the best available evidence, our method captured well the trend of natural disturbances, and thus did not alter the conclusions of the original study. Furthermore, while the method used is indeed simple and should be improved, there were not better solutions available for such analyses at EU level when the study was published.
3. Comparing our data with country statistics on harvest
Among the strongest criticisms we received is the claim that our results contradict country statistics on harvest, and are not plausible. This section checks this claim.
Fig. 3a is the main figure in the original paper ([2]), showing an estimated increase in harvested biomass by 69% in 2016-2018 relative to 2011-2015.
Fig. 3 - (a) Estimates of harvested area and biomass as originally reported by Ceccherini et al. ([2]); (b) results from Ceccherini et al. ([2]) as wrongly “perceived” by many critics, compared to country statistics on total harvest (FAOSTAT); (c) correct like-with-like comparison between results from Ceccherini et al. ([2]) on clear-cut felling and country statistics on total fellings, including a preliminary adjustment of Ceccherini et al. ([2]) due to the undocumented change in algorithm in 2015 (this correction reduces the increases in harvest in 2016-2018 vs. 2011-2015 by about one third, based on a validation exercise performed for Sweden and Finland illustrated by Ceccherini et al. ([3]), and here extrapolated to the entire EU). The fellings from Ceccherini et al. ([2]) were obtained simply multiplying the values of biomass (Fig. 3a) by 2. The JRC Bioenergy report ([1]) includes 2020 updates of country statistics and considers a min-max based on the statistics on wood use; the original data are till 2015, which here we extrapolated till 2018 (dotted blue lines). See text for details.
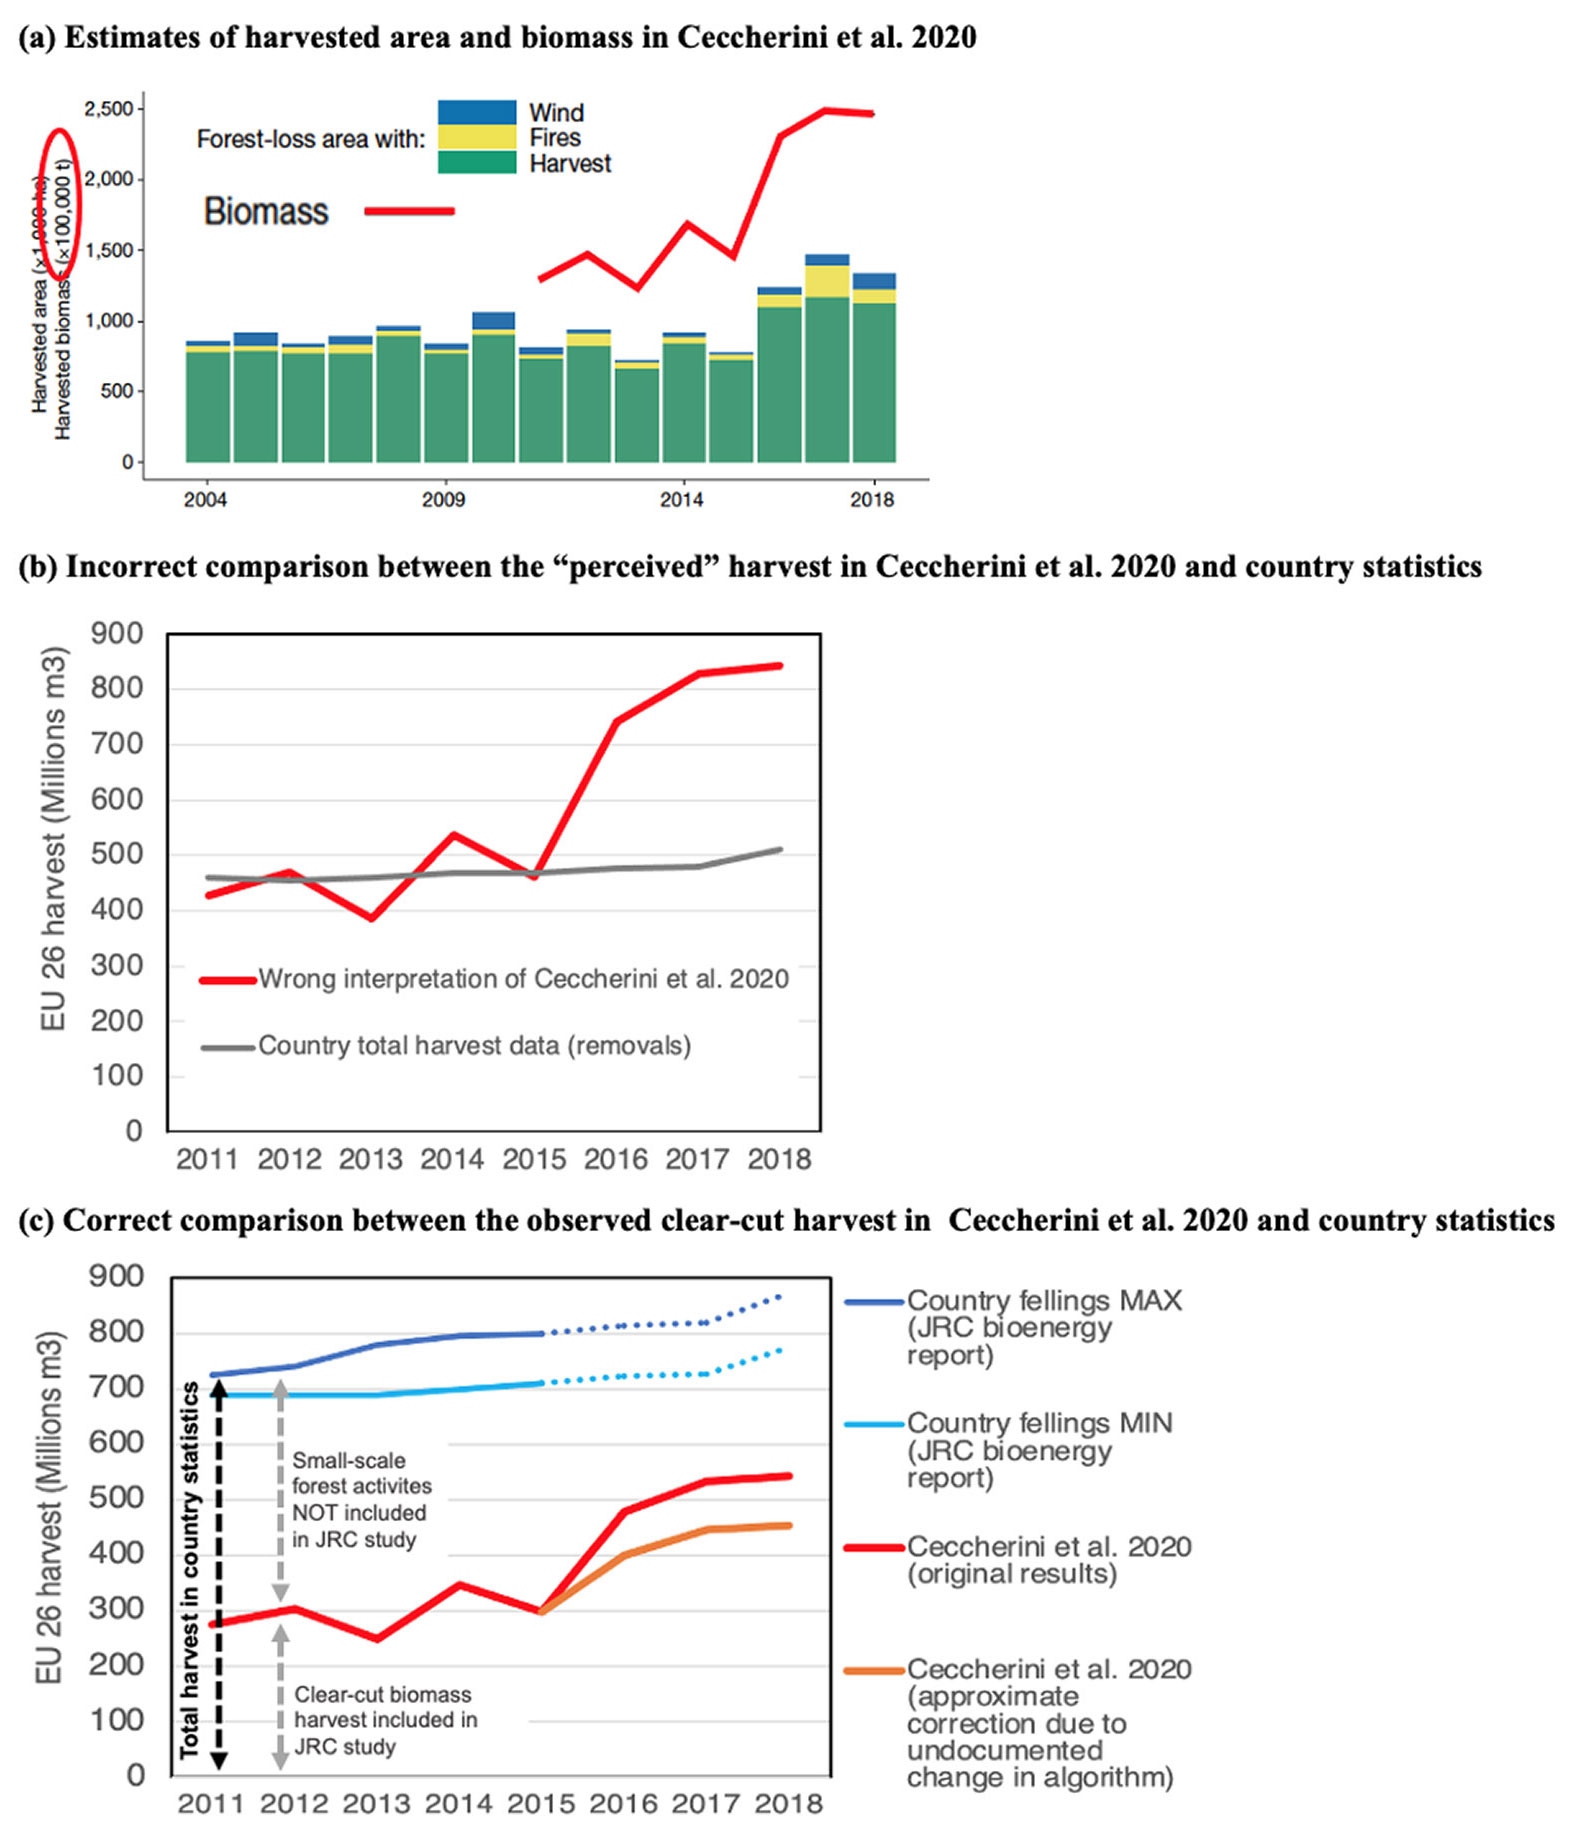
Most of the our critics assumed that our study estimated total harvest. Translated into numbers, this assumption is illustrated in Fig. 3b, i.e., the “perceived” starting point was the current level of total harvest reported in countries statistics (about 470 Mm3 y-1, based on FAOSTAT). This led to argue that our results are “impossible” because a harvest removal of 790 Mm3 y-1 (470 Mm3 y-1 + 69% increase) is likely beyond the harvesting capacity in the EU.
However, Fig. 3b compares “apples with elephants”: tonnes of clear-cut fellings overbark (our study) vs. m3 of total removals underbark (country statistics). In other words, these criticisms overlooked the unit of harvested biomass in the y-axis (×100000 t) of Fig. 3a (red oval). By converting this amount of biomass into m3 - as first approximation this can be done simply by multiplying by 2 (see [4]) - anyone could obtain a harvest estimate in m3 associated to our study and compare it with country statistics. This estimate is illustrated as red solid line in Fig. 3c. An “apple-with-apple” comparison with country statistics, however, requires some further step.
The biomass estimated in our study, as it can be clearly evinced in the methods of Ceccherini et al. ([2]), corresponds to fellings over bark (o.b.), i.e., harvest removals o.b. plus residues. Country statistics (grey line in Fig. 3b) are generally expressed as removals under bark (u.b.) and thus need to be converted into fellings o.b.. In addition, direct comparison is further complicated by the fact that wood removal statistics in EU underestimate wood uses by up to 20% ([1]). The blue lines in Fig. 3c combines all this, i.e., fellings including the 2020 updates from countries and considering a range on min/max values based on official statistics on wood use (data available till 2015 from the JRC Bioenergy report - [1] - and here extrapolated proportionally to the official harvest removals statistics until 2018).
When these more realistic estimates of total wood harvest are applied, our estimates are in the order of 40-60% of country statistics (depending on the year - Fig. 3c). If the adjustment of the results associated to the new validation exercise ([3]) is extrapolated at EU level, then the increase in harvest after 2015 would be reduced compared to the original estimate (orange line - Fig. 3c). With this additional approximate correction, our estimates become about 40-50% of country statistics (orange line vs. blue lines in Fig. 3c).
Although the above demonstrates that our results are fully “possible”, why is our estimated harvest so low compared to country statistics?
The answer is that our study focuses on clear-cuts. Small-scale forest activities such as thinning and selective logging, which are the predominant form of harvest in many countries, are not included in our study. While we regret that this information was missing in the abstract of the original paper (because considered too “technical” for most readers of Nature) - and this may have contributed to the misunderstanding - it is explained at least five times in the main text [5].
In addition, country-specific statistics or modelled estimates of the share of clear-cuts (or final fellings) on total harvest are provided in original supplementary information table [6]. This is a lot of information that apparently many of our critics did not notice. By combining the information from that table with the harvest statistics from countries, it can be estimated that approximately 45-50% of total EU total harvest comes from clear-cuts. While this number should be seen as an approximation because it is affected by many uncertainties, it is worth noting that it is the same order of magnitude of our independently-estimated clear-cut harvest (Fig. 3c).
According to our analysis, the increase in clear-cut harvest can be only partly explained by the increase in salvage logging (when expressed as fellings o.b., equal to about 9 Mm3 y-1 on average during 2011-2015 and 45 Mm3 y-1 during 2016-2018 - see section 2).
Overall, the above indicates that the claims that our results are “impossible” and that they contradict country statistics are largely due to misunderstandings and incorrect comparisons. Our results should be interpreted as a warning on a recent increase in clear-cuts harvest observed by satellites - with potential consequences on biodiversity and climate change -, and not necessarily as a criticism to country statistics.
On the other hand, we expect our critics to present correctly the ongoing debate. For example, the POLITICO magazine [7] reported that “Using the same data set as the JRC, the researchers [i.e., Palahí et al. ([7])] found that timber harvesting increased by about 6 percent between 2016 and 2018 compared to the period between 2011 and 2015”. This is utterly wrong. To our knowledge no one, using GFC data, reached different conclusions. The 6% increase mentioned is what countries officially report to FAO, not an independent estimate.
In conclusions, we hope that the clarifications provided in this commentary helps detoxifying the debate and looking at the study for what it is: an effort to illustrate the potential (and limitations) of remote sensing in the monitoring of forest resources in Europe. The aim is to complement - and not to replace - country statistics, especially in the timely analysis of recent changes that in many cases are reported by the National Forest Inventory statistics only few years later. Finally, mistakes may happen in science. Our study certainly includes some communication error, and we rectified the original results once new information became available. However, based on available evidence, we do not see any relevant mistake in the analysis. On the other hand, we often had the impression of being criticised based on misunderstandings. Like in a broken telephone game, starting from some unfortunately simplified passage in the abstract of the original study, the critics further amplified the misperception. The final message ended up in being very different from the original one. Once the context and the numbers of our study are understood correctly, we welcome any independent study further checking and improving our method and the results.
Forests are such a value laden topic that discussions may easily become very polarized. However, as scientists, we have the responsibility to maintain rigour and neutrality when discussing about scientific papers, what their results mean and where they are applicable.
Acknowledgements
The authors of this note thank the other co-authors of the original paper and the rebuttal (Gregory Duveiller, Guido Lemoine, Valerio Avitabile and Roberto Pilli) and Anu Korosuo for useful comments.
The views expressed are purely those of the writers and may not in any circumstances be regarded as stating an official position of the European Commission.
References
CrossRef | Gscholar
CrossRef | Gscholar
Footnotes
Authors’ Info
Authors’ Affiliation
Alessandro Cescatti 0000-0002-2769-2591
Guido Ceccherini 0000-0003-1772-9554
European Commission, Joint Research Centre, Directorate D - Sustainable Resources - Bio-Economy Unit, Ispra, VA (Italy)
Corresponding author
Paper Info
Citation
Grassi G, Cescatti A, Ceccherini G (2021). JRC study on harvested forest area: resolving key misunderstandings. iForest 14: 231-235. - doi: 10.3832/ifor0059-014
Academic Editor
Marco Borghetti
Paper history
Received: May 05, 2021
Accepted: May 07, 2021
First online: May 07, 2021
Publication Date: Jun 30, 2021
Publication Time: 0.00 months
Copyright Information
© SISEF - The Italian Society of Silviculture and Forest Ecology 2021
Open Access
This article is distributed under the terms of the Creative Commons Attribution-Non Commercial 4.0 International (https://creativecommons.org/licenses/by-nc/4.0/), which permits unrestricted use, distribution, and reproduction in any medium, provided you give appropriate credit to the original author(s) and the source, provide a link to the Creative Commons license, and indicate if changes were made.

Web Metrics
Breakdown by View Type
Article Usage
Total Article Views: 37277
(from publication date up to now)
Breakdown by View Type
HTML Page Views: 30923
Abstract Page Views: 2697
PDF Downloads: 3107
Citation/Reference Downloads: 6
XML Downloads: 544
Web Metrics
Days since publication: 1843
Overall contacts: 37277
Avg. contacts per week: 141.58
Article Citations
Article citations are based on data periodically collected from the Clarivate Web of Science web site
(last update: Mar 2025)
Total number of cites (since 2021): 4
Average cites per year: 0.80
Publication Metrics
by Dimensions ©
Articles citing this article
List of the papers citing this article based on CrossRef Cited-by.
Related Contents
iForest Similar Articles
Review Papers
Remote sensing support for post fire forest management
vol. 1, pp. 6-12 (online: 28 February 2008)
Research Articles
Predicting the effect of climate change on tree species abundance and distribution at a regional scale
vol. 1, pp. 132-139 (online: 27 August 2008)
Review Papers
Remote sensing-supported vegetation parameters for regional climate models: a brief review
vol. 3, pp. 98-101 (online: 15 July 2010)
Review Papers
Accuracy of determining specific parameters of the urban forest using remote sensing
vol. 12, pp. 498-510 (online: 02 December 2019)
Research Articles
Change Detection methods for forest expansion assessment in the last twenty years in the Mediterranean Basin
vol. 18, pp. 69-78 (online: 16 April 2025)
Research Articles
Fuel type characterization based on coarse resolution MODIS satellite data
vol. 1, pp. 60-64 (online: 28 February 2008)
Research Articles
Rapid assessment of wind storm-caused forest damage using satellite images and stand-wise forest inventory data
vol. 6, pp. 150-155 (online: 08 April 2013)
Research Articles
Mapping the vegetation and spatial dynamics of Sinharaja tropical rain forest incorporating NASA’s GEDI spaceborne LiDAR data and multispectral satellite images
vol. 18, pp. 45-53 (online: 01 April 2025)
Research Articles
Seeing trees from space: above-ground biomass estimates of intact and degraded montane rainforests from high-resolution optical imagery
vol. 10, pp. 625-634 (online: 01 June 2017)
Research Articles
Estimation of forest leaf area index using satellite multispectral and synthetic aperture radar data in Iran
vol. 14, pp. 278-284 (online: 29 May 2021)
iForest Database Search
Search By Author
Search By Keyword
Google Scholar Search
Citing Articles
Search By Author
Search By Keywords
PubMed Search
Search By Author
Search By Keyword


