Rapid assessment of wind storm-caused forest damage using satellite images and stand-wise forest inventory data
iForest - Biogeosciences and Forestry, Volume 6, Issue 3, Pages 150-155 (2013)
doi: https://doi.org/10.3832/ifor0715-006
Published: Apr 08, 2013 - Copyright © 2013 SISEF
Research Articles
Collection/Special Issue: IUFRO 7.01.00 - COST Action FP0903, Kaunas (Lithuania - 2012)
Biological Reactions of Forest to Climate Change and Air Pollution
Guest Editors: Elena Paoletti, Andrzej Bytnerowicz, Algirdas Augustaitis
Abstract
This paper introduces a method for rapid forest damage assessment using satellite images and stand-wise forest inventory data. Two Landsat 5 Thematic Mapper (TM) images from June and September 2010 and data from a forest stand register developed within the frameworks of conventional stand-wise forest inventories in Lithuania were used to assess the forest damage caused by wind storms that occurred on August 8, 2010. Satellite images were geometrically and radiometrically corrected. The percentage of damage in terms of wind-fallen or broken tree volume was then predicted for each forest compartment within the zone potentially affected by the wind storm, using the non-parametric k-nearest neighbor technique. Satellite imagery-based difference images and general forest stand characteristics from the stand register were used as the auxiliary data sets for prediction. All auxiliary data were available from existing databases, and therefore did not involve any added data acquisition costs. Simultaneously, aerial photography of the area damaged by the wind storm was carried-out and color infrared (CIR) orthophotos with a resolution of 0.5 x 0.5 m were produced. A precise manual interpretation of the effects of the wind storm was used to validate satellite image-based estimates. The total wind damaged volume in pine dominating forest (~1.180.000 m3) was underestimated by 2.2%, in predominantly spruce stands (~233.000 m3) by 2.6% and in predominantly deciduous stands (~195.000 m3) by 4.2%, compared to validation data. The overall accuracy of identification of wind-damaged areas was around 95-98%, based solely on difference data from satellite images gathered on two dates.
Keywords
Forest Damage, Satellite Images, Change Detection, k-Nearest Neighbour
Introduction
The assessment of wind-caused forest damage includes some specifics that distinguish it from other tasks of detection and measuring of forest changes, at least in the context of Lithuanian forestry conditions. Fast and accurate determination of affected areas of forest and the severity of the damage are essential to enable forest managers to take immediate action on sanitary felling, timber processing and reforestation. Damage is usually geographically concentrated, some areas being difficult to access and measure in the field; however, all forests in Lithuania are precisely mapped and attributed by stand-wise forest inventories ([27]).
This paper introduces a method of assessing the forest damage caused by a wind storm on August 8, 2010, in Lithuania. The introduced method may also be useful for solving other remote sensing based change detection tasks. The solution is based on integrating methodological approaches originating from two areas of satellite image usage related to the forest inventory: (i) forest change detection, and (ii) the nearest neighbor technique.
The process of analyzing image data from two or more periods for the purpose of mapping cover change is commonly referred to as change detection ([21]). The principles of satellite image-based forest change detection were first discussed in detail more than a decade ago ([9], [33], [43]) and are still a subject of current research and interest ([18], [21]). Forests can be considered to grow at a constant rate of change, divided into long-term, short-term and rapid change ([9]). Long-term change is usually connected to the growth of the stand, and even that can be monitored using state-of-the-art remote sensing techniques such as aerial imaging and laser scanning ([13]). Satellite remote sensing can be considered to be a practical technique for long-term change observations, in particular because data with image characteristics suitable for monitoring forest changes are available for most of the Earth’s surface for the past 40 years (e.g., the Landsat program - [47], [21]). Short-term or seasonal changes, usually related to reforestation, defoliation etc. can be monitored by satellite image-based remote sensing ([45], [23]). The main challenge for foresters, however, is the detection and measuring of rapid changes such as tree felling, wind damage and so on. Satellite image-based remote sensing has become an essential data source for assessing rapid or abrupt changes, being low cost, easily and readily accessible, yet it still provides adequate information ([18], [41]).
A great variety of change detection approaches have been tested ([35], [1], [18], [21]), some of which have focused directly on the assessment of wind damage to forests ([46]). In general, methodological approaches for detecting changes in vegetation can be grouped into two primary categories: trajectory analysis and bi-temporal methods ([23]). Trajectory analyses are based on the use of time series of more than two images to assess the type, extent, progress, trend or temporal pattern of changes over time ([17]). Usually, trajectory analyses have been used with data from high temporal and coarse spatial resolution sensors ([21]). More recently, Landsat time series data have been used to map forest changes ([17], [45], [7]). Bi-temporal methods include the analyses of two images acquired at different dates ([23]). Examples of classical bi-temporal approaches used for change detection are the thresholding of image difference or ratio channels, linear transformations of two temporal data sets, comparisons of two independent image classification results, and direct classification of a multiband data set, etc. ([35], [10], [1]). The detection of rapid changes in forest canopies has been well documented by numerous Scandinavian scientists, but they usually failed to achieve sufficient accuracy when employing satellite image information only, together with conventional algorithms suitable for studies of general land cover change ([9], [33], [42]). More reliable results were obtained when auxiliary ground information, especially data originating from stand-level inventories, was combined with the satellite images and more sophisticated processing methods based on combinations of several image processing techniques were used ([9], [42], [44], [10], [8]). Today, the blending of data from different passive sensors or a combination of passive and active sensors is expected to define the future of forest monitoring ([21]). The blending of remote sensing data and information available from vector databases could also be a solution. In Lithuania, information available from even relatively outdated stand-wise forest inventory combined with single acquisition date Satellite Pour l’Observation de la Terre version 4 (SPOT-4) HRVIR image resulted in better than 90% overall final felling detection accuracy ([16]).
Aside from the detection of changes, satellite imagery is considered to be an operational solution for estimating the continuous surfaces of key forest characteristics and providing statistically sound estimates for small areas within the framework of sampling-based, multi-source national forest inventories in some countries (e.g., [37], [32], [38], [6], [5], [39], [40], [22]). This is based on the use of field sample plot data measured within the frames of some sampling-based forest inventories, together with low-cost, readily accessible satellite imagery, mainly the Landsat Thematic Mapper (TM) and k-nearest neighbor (k-NN) prediction. The basic concept is that “field measurements in a certain area can also be made use of in neighboring areas by employing a relevant extrapolating, or «information borrowing» technique” ([39]).
For those units that lack field observations, sampling of the units that are spatially nearest to, or that most closely resemble the characteristics of (i.e., neighbors), are used as information for predictions on subsequent units ([22]). The nearest neighbor technique has been successfully employed to produce forest maps ([5], [34], [21]) and forest resource estimates at the municipality level ([40]), but the method has encountered some difficulties at the forest compartment, or division, level ([20]). It has also been successfully applied in Lithuania for recording an inventory of mature forests to obtain statistically reliable total volume estimates for forestry districts (areas of about 500 ha - [14]), but has failed at the forest compartment level ([15]).
A wind storm occurred on 8 August 2010 damaged about 12% of all Lithuanian forests. Wind speed exceeded 26 m/s. In total, 140 thousands ha of damaged forest stands consisting of 3.82 million m3 of damaged stem volume were inventoried by the State Forest Service. Of all stands, 76% were slightly damaged (less than 5% stem volume damaged), and 15% were moderately damaged (6-30%). Stands on 13 000 ha had already been felled (2011) or were to be removed in the very near future (Forest Resources of Lithuania, NFI 2011, Ministry of Environment, State Forest Service - ⇒ http://www.amvmt.lt). Preliminary field assessments of the damage immediately after the storm produced no more than a rough estimate of the amount and spatial location of damaged stands. An aerial photography survey was also carried out towards the end of 2010, but this rather costly project required the efforts of highly qualified personnel. Finally, a field survey based on sampling methods carried out in 2011 produced reliable statistics on damaged and harvested timber, but this information became available far too late for operational planning purposes. Thus, the key question to be answered is: would satellite imagery provide opportunities for the timely assessment of wind storm damage and also meet the requirements of Lithuanian forestry authorities for estimating damage location and damaged stem volume?
Material and methods
Areas potentially affected by the wind storm were photographed in late September 2010 to meet the requirements of forest inventory orthophotographic mapping ([27]). Color infrared orthophotos with a resolution of 0.5 m x 0.5 m were manually interpreted onscreen to identify the levels of damage inside each forest compartment along the wind storm track. Forest compartments were split into smaller polygons if the continuous wind-damaged area exceeded 0.5 ha. Then, the resulting polygons were assigned damage classification classes 0 to 4, where: 0 = no damage; 1 = less than 25% of the stand volume damaged; 2 = 25-50% damaged; 3 = 50-75% damaged; and 4 = more than 75% damaged. There were 12 181 polygons identified in damage class 1 or more with an average area of 0.9 ha. The actual percentage value of the damage was also identified for each polygon. A minimum boundary rectangle was generated around all forest compartments with > 0 % damage, using standard ArcGIS software functionality. All forest compartments enclosed by the rectangle were selected from the geographical database of the Lithuanian State Forest cadaster for subsequent study. The total number of compartments in the minimum bounding rectangle was 71 979, with an average area of 1.7 ha.
Two cloud-free Landsat 5 TM images (WRS path/row 187/022) were acquired from the USGS EarthExplorer (⇒ http://earth⇒ explorer⇒ .usgs.gov) for the dates June 5, 2010 (hereafter referred to as the earlier image) and September 25, 2010 (the later image). The satellite images were processed to the geocoded products using ground control points measured on topographic maps and in the field, stored in Lithuanian coordinate system LKS94. Relative radiometric calibration was applied to the later image using the multiple linear regression technique of Olsson ([33] - eqn. 1):
where Ŷb is the calibrated pixel value for each band (b) of the later image, a0, a1, …a6 are regression coefficients; and XTM1, …XTM 5, XTM 7 are the original pixel values of the later image.
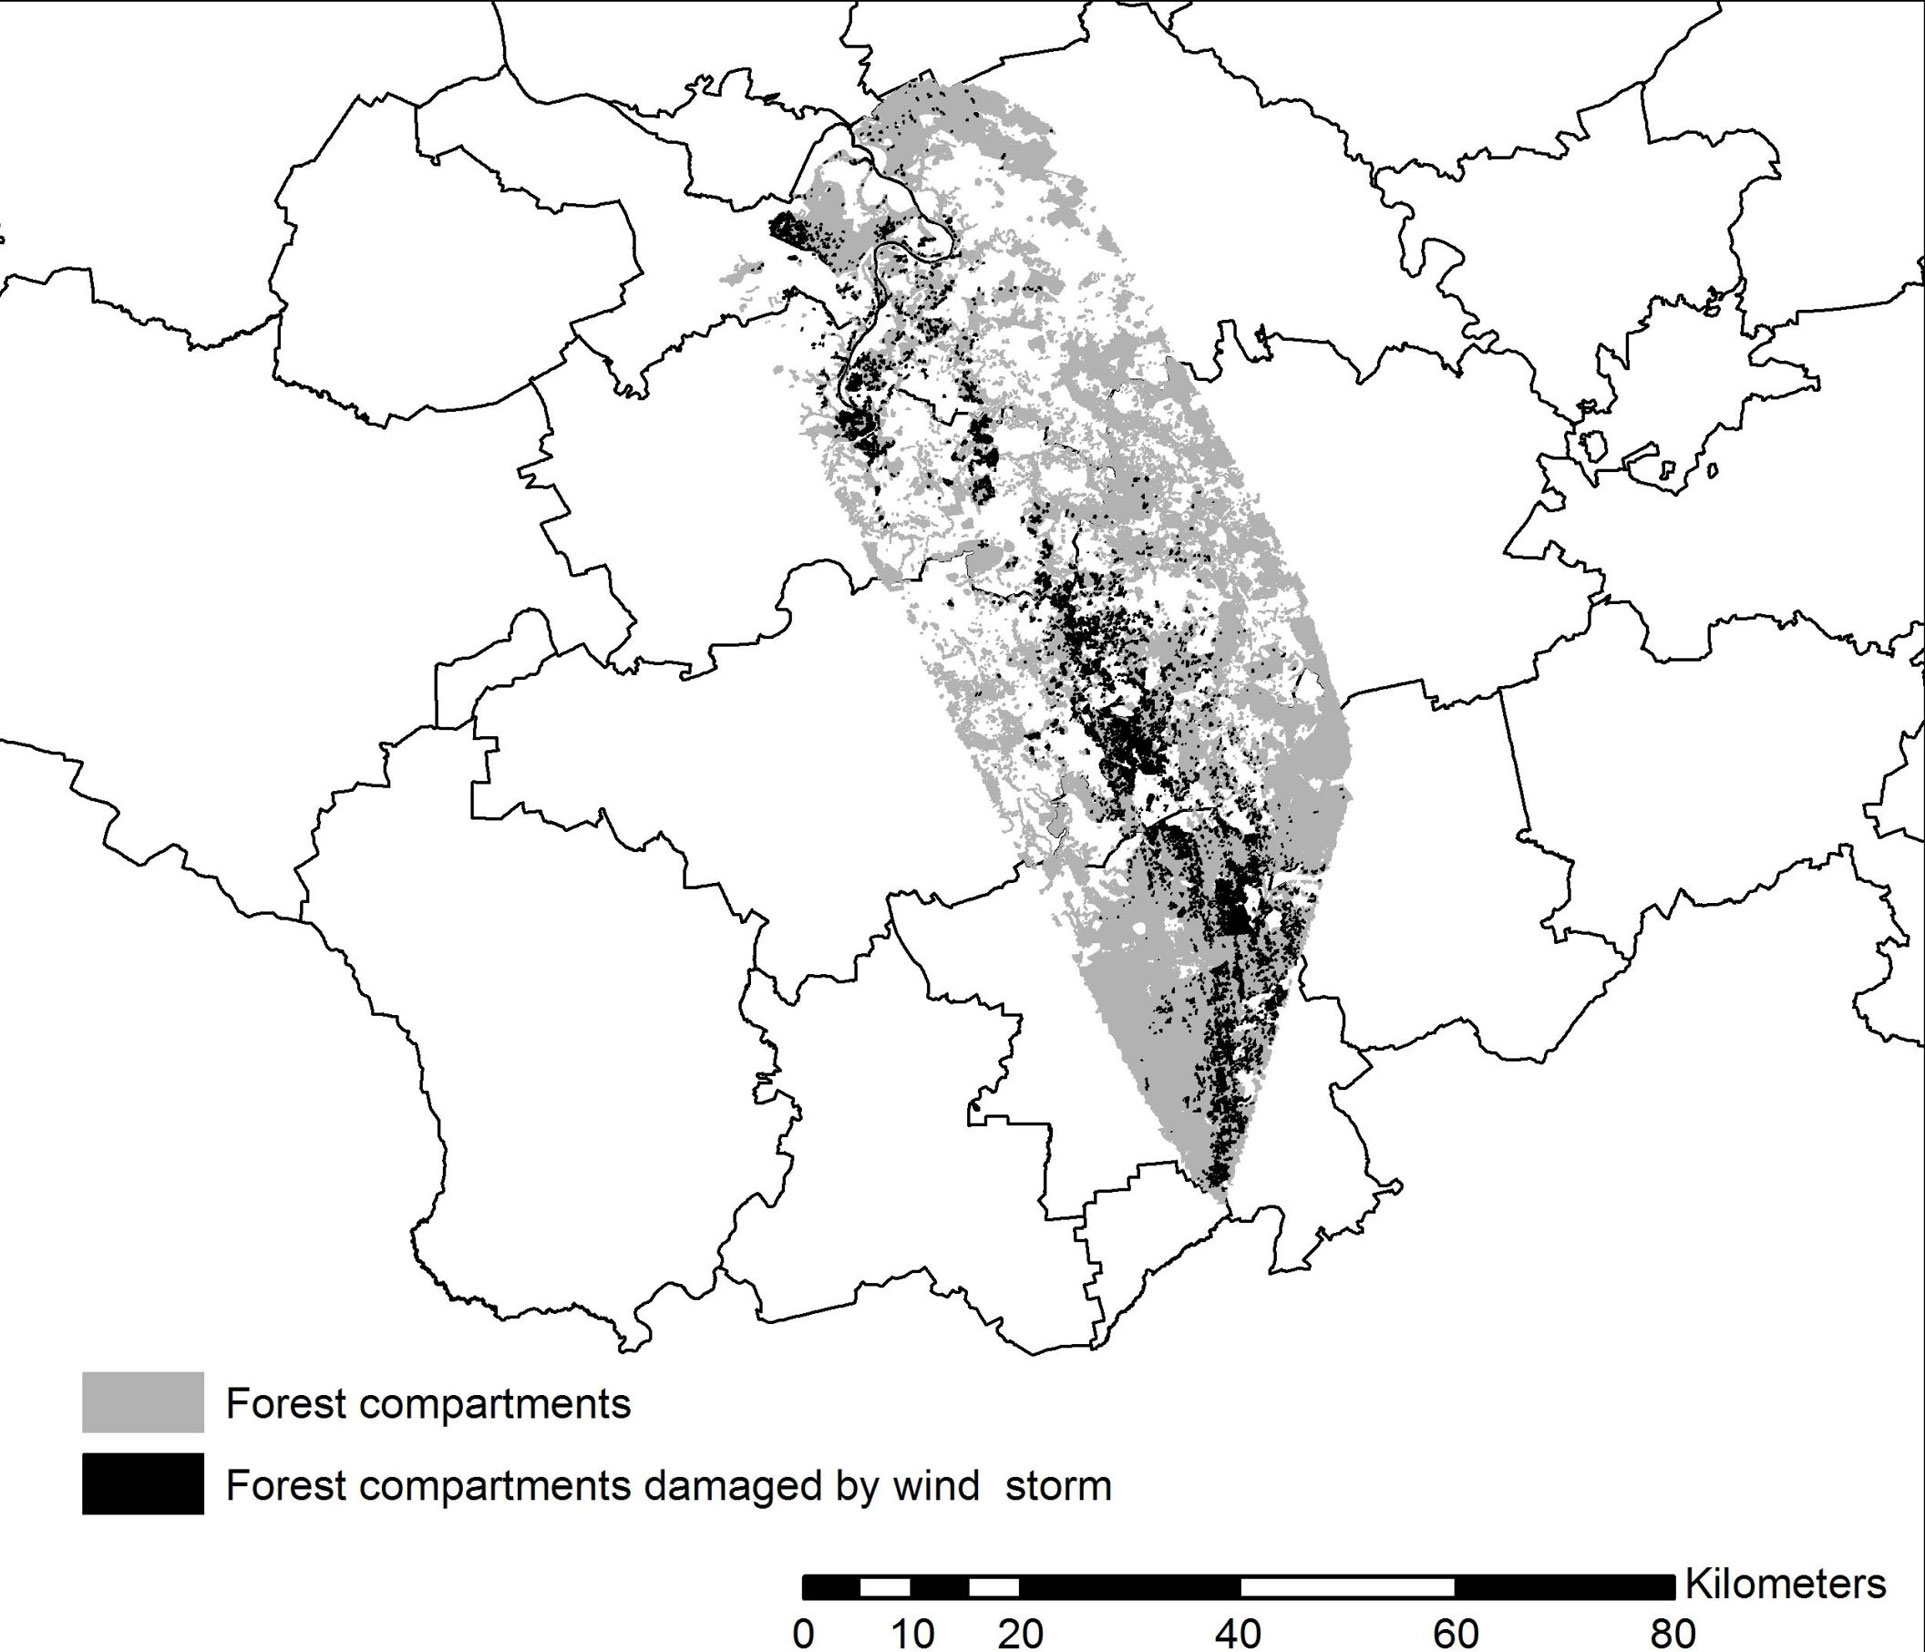
Only the pixels located within the forest in the study area were used to develop the regression models for relative image calibration. The final spatial extent of the study area was defined by the intersection of satellite images available for the study and the minimum bounding rectangle around the forest compartments damaged by the wind storm on 8 August 2010 (Fig. 1).
Fig. 1 - The study area.
Next, six image difference grids corresponding to the TM bands were created by subtracting the calibrated pixel values of the later image from corresponding pixel values of the earlier image. Aggregate image difference values were obtained as follows ([3] - eqn. 2):
where XTM1, …, XTM5, XTM7 are image difference values of corresponding TM bands.
Simple thresholding of the aggregated difference image was applied to create binary “change/no change” masks, stored as raster grids with the same properties as the satellite images. The value of XTM was iteratively changed from 1 to 20 using step = 1, and 20 versions of “change/no change” grids were generated. Initially it was thought that, in addition to the XTM value, the interpreted change in the validation data set might have some influence on the interpretation of the results. Thus, based on the vector data of the mapped wind damage extents, a series of raster grids was constructed to represent actual change due to wind damage. Polygons (forest compartments or parts of forest compartments) with percentages of stand volume damaged greater than 50, 60, 70, 80, 90 and 100, respectively, were converted to raster grids using the same grid properties as for the aggregated difference image. Error matrices ([19]) were then created to assess the classification accuracy for all combinations of XTM and the percentage of stand volume that had been damaged.
Having determined the threshold value of XTM that resulted in the highest overall accuracy of change classification (actually, 13), the percentage of area changed in each forest compartment was calculated based on the corresponding “change/no change” grid.
In addition to the spatial location of wind-damaged forest areas, the volume of damaged forest stands is considered to be equally important in Lithuanian forestry. Information on the total stand volume in the forest compartments is usually available from the stand register of the State Forest cadaster. For each compartment, two methods of resolving the wind-damaged stand volume were used:
- the stand volume accessed from the stand register was multiplied by the percentage of area changed, as determined for each individual compartment using the “change/ no change” grid (hereafter referred to as Solution 1);
- a special approach was developed to integrate the solutions originating from satellite image-based change detection and nearest neighbor techniques, based on k-nearest neighbor (k-NN) prediction and using auxiliary information from the “change/no change” grid and the stand register of the State Forest cadaster (Solution 2).
The k-NN method is a multi-dimensional version of the inverse distance-weighted technique, briefly described as follows ([37]): the Euclidean distance di,p is calculated between each first-phase observation unit p (in this case, p is a forest compartment inside the test area) in n-dimensional feature space of auxiliary information, and a second-phase observation unit i with a known value of wind-damaged stand volume (here we used 9 278 randomly selected compartments from the wind damage assessment data set obtained from orthophotomap interpretation representing all tree species, age class, relative stocking level and wind damage class combinations in the test area). Here, n refers to the total number of layers of auxiliary information-age class, volume per hectare, relative stocking index, area of the compartment originating from the stand-wise forest inventory, and the percentage of area that has been classified as changed, according to satellite images; and k represents the distances di,p - d(1),p ... d(k),p, (d(1),p ≤ ... ≤ d(k),p) found and the weight is calculated from (eqn. 3):
The value of wind-damaged volume per hectare for each compartment p of first-phase observation is given by (eqn. 4):
where m(j),p, j = 1,… k are the values of the wind-damaged volume per hectare of k second-phase observation units nearest to p in n-dimensional feature space.
The list of layers of auxiliary information and the values of k and t were iteratively chosen using leave-one-out technique in order to minimize the prediction root mean square error. The lowest prediction root mean square errors were achieved with all layers of auxiliary information and a value of t equal to 1. Values of k ranging from 1 to 30 were tested and the value k =10 was chosen for further investigation because it was the smallest value of k for which the root mean square was not more than 1% greater than the overall smallest value (following the recommendations by [22]).
To obtain the wind-damaged volumes in all compartments of the test area to be used for validation, we simply multiplied the stand volume (as accessed from the stand register) by the damage percentage interpreted from the orthophotomaps.
Conventional GIS and remote sensing packages (ArcGIS, PCI Geomatica) were used to perform the GIS processing tasks, working with satellite and aerial images. The Most Similar Neighbor (MSN) program ([25], [2]) was used to calculate the Euclidean distances used in the k-NN predictions.
Results and discussion
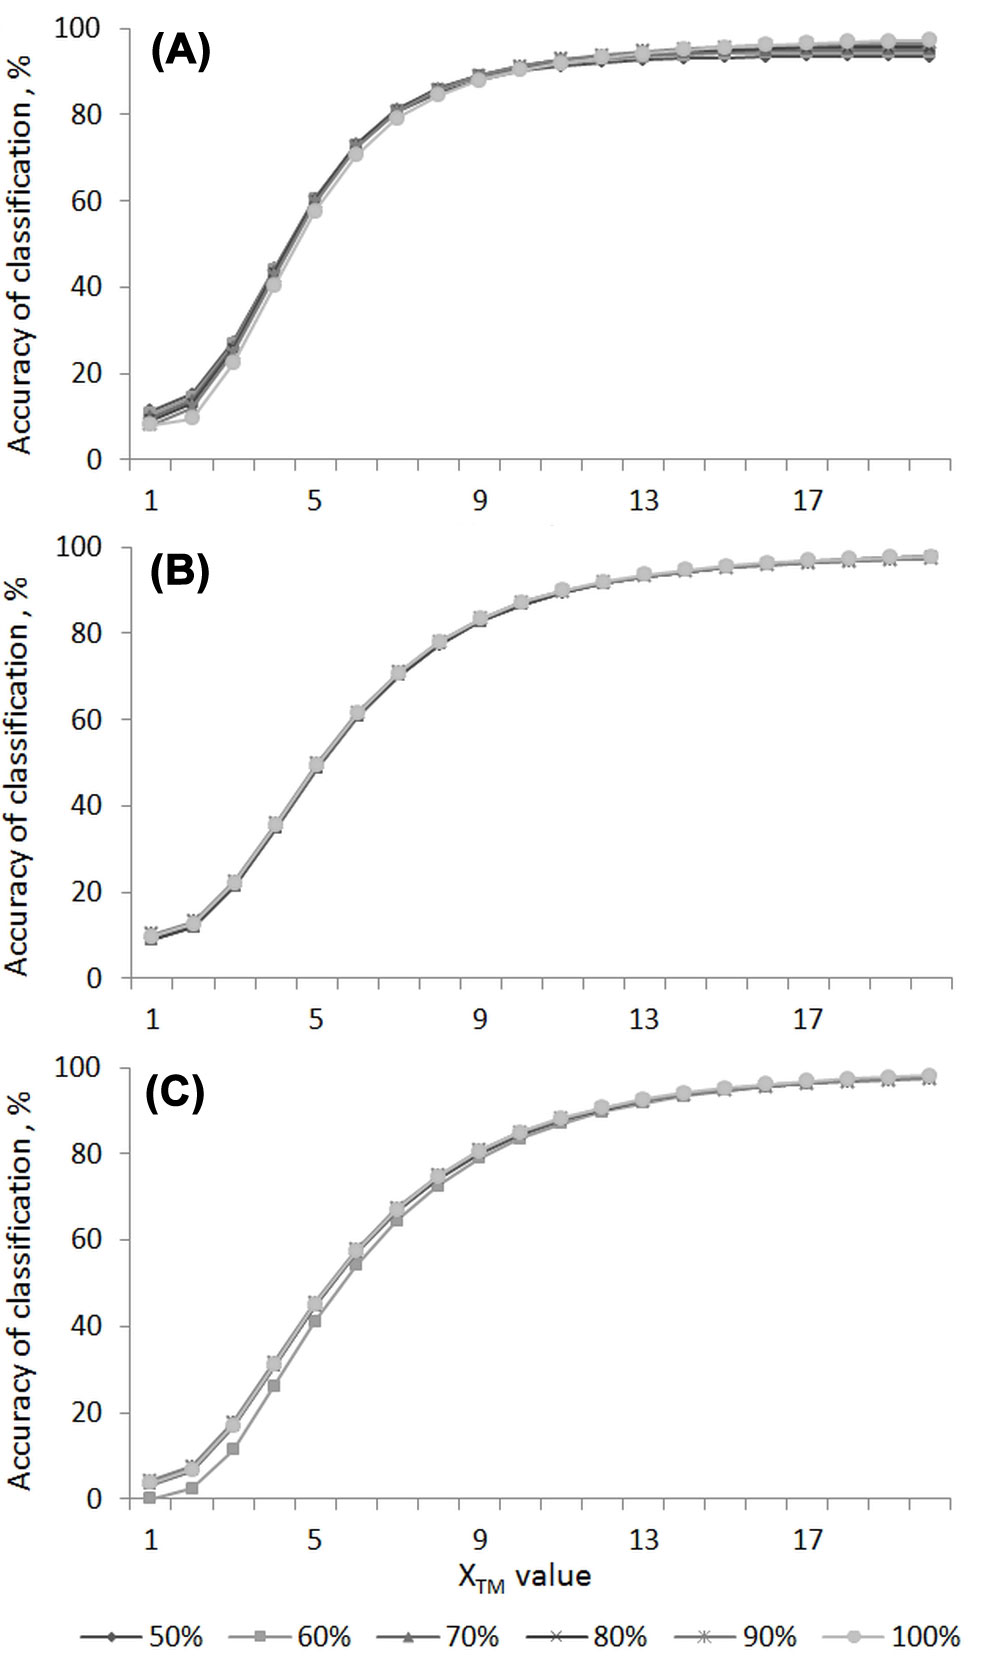
Increasing the threshold value to consider the value of a difference image caused an increase in the overall identification accuracy of wind-damaged areas (Fig. 2) up to a value of XTM= 13, then effectively stabilized at 95-98%. The same trends were observed (not shown in Fig. 2) regarding the correlation of XTM with the κ statistic ([19]). The absolute values of κ, which is a measure of how much the classification being validated exceeds a chance classification, were moderate (about 0.5-0.6), indicating that the relationship is independent of tree species, and also of the interpretation of “change” - that is, the percentage of the volume actually damaged being considered as a “change”.
Fig. 2 - Overall accuracy of classification of wind-damaged areas, with respect to the percentage of volume actually damaged being considered as a change, and the threshold value of difference image identifying a change: (A) pine stands; (B) spruce stands; (C) deciduous stands.
The percentage of volume damaged by the wind storm was estimated for almost 64 000 forest compartments in the study area using the selected “change/no change” grid. However, only 17.3% of the forest compartments were actually damaged (20.1% in pine stands, 13.9% for spruce and 12.9% for deciduous trees). The Kolmogorov-Smirnov test was used to check the null hypothesis that the distribution of damaged volumes per unit area in the compartment was normal, but the p-value was lower than the significance level α = 0.05 (p < 0.0001) in all cases, thus rejecting the null hypothesis.
An inspection of the classified image difference grid revealed that approximately 17% of all forest compartments contained at least one “change” cell; however, the area of a compartment identified as “changed” was practically always less than the actual damage percentage. Therefore, the total volume of damaged forest in the study area estimated using the Solution 1 (i.e., using only the difference between two satellite images) was much less than the estimates obtained from the labor- and time-consuming interpretation of aerial imagery based orthophotos (Tab. 1). The total volume was underestimated by 41.8%; for predominantly pine compartments, underestimation was even greater at 44.9%. This might be explained as being a result of the dispersed nature of the distribution of wind-damaged trees throughout the whole area of the compartment, especially when the damage classes were low, such as 1 or 2. Thus, the value XTM was too low at some locations to identify a “change”. The difference between actual damage percentage and the percentage of “changed” area for the compartment was found to be correlated weakly, yet still at a significant level statistically, with the characteristics of the forest stand in the compartment (those used later as auxiliary data in the k-NN prediction). The largest Pearson’s correlation coefficients were observed for stand volume (0.14 for pine, 0.16 for spruce and 0.13 for deciduous stands), area of the compartment (respectively -0.14, -0.13 and -0.08), and age class (0.08, 0.10 and 0.09).
Tab. 1 - Total volumes of wind-damaged trees in the study area. (Solution 1): prediction using only difference of two satellite images; (Solution 2): prediction using k-NN and information from satellite images and stand-wise forest inventory; (Validation): aerial photography-based inventory. For more details, see text.
| Prevailing species |
No of compartments |
Total volume of wind damaged trees (1000 m3) |
Difference compared to aerial photography-based inventory data (%) |
|||
|---|---|---|---|---|---|---|
| Solution 1 | Solution 2 | Validation | Solution 1 | Solution 2 | ||
| Pine | 37 632 | 649 | 1153.4 | 1178.8 | -44.9 | -2.1 |
| Spruce | 8 633 | 152.3 | 227.4 | 233.5 | -34.7 | -2.6 |
| Deciduous | 17 495 | 133.6 | 186.3 | 194.5 | -31.3 | -4.2 |
| All | 63 760 | 934.9 | 1567.1 | 1606.8 | -41.8 | -2.5 |
To summarize, the forest damage estimates arrived at by using Solution 1 lay outside the acceptable range for Lithuanian forestry. However, the introduction of auxiliary information other than satellite imagery, which is readily available from the State Forest cadastre (Solution 2), improved the total estimates of wind-damaged forest volume notably (Tab. 1). The total volume of damaged trees was underestimated by just 2.5%, while the underestimation for the most significant economically and more abundant pine-dominated stands was even less, at 2.1%. We may consider the achieved underestimations to be well within acceptable limits, since a general requirement of the Lithuanian forest inventory is to aim to have the total estimated volume of an inventory object larger than 1000 ha to be true within ±5%.
The use of the k-NN method in forest inventories is usually connected to sampling-based inventories and for generating statistics, basically volume, for areas larger than a forest compartment. As mentioned above, attempts to analyze data at the forest compartment level have not always been successful, and studies of this topic are only modestly represented in the literature. In USA, forest inventory sample plot data, Landsat TM satellite imagery, and the k-NN technique have been used to produce stand-level estimates ([20]). He found that estimates of stand-level stem density and basal area means were within confidence intervals for validation estimates for around 90% of stands. Other research projects used potentially more accurate - therefore more costly - remote sensing data, or else considered somewhat elementary forest conditions. Previously, the approach to obtain forest compartment-level estimates has mainly involved the use of aerial imagery and historical forest inventory records ([25], [36]), aerial images together with, or independently of, data derived from laser scanning ([29], [30], [31], [24], [12], [28], [11], [4]). More recently, similar research in Lithuania reached the conclusion that summary statistics only, such as the mean volume of growing stock per hectare for some areas, could be applicable operationally if the k-NN predictions were done at a forest compartment level ([15]). However, it seems that the estimation of the stand volume lost due to natural disasters using a similar approach has not previously been studied.
Similarly to most of the research mentioned above, the prediction unit in the present study was a forest compartment. The prediction accuracies expressed in terms of root mean square error are usually quite poor at the prediction unit level using non-parametric methods ([26]) and the bias is low. The root mean square error tends to drop further for larger aggregations. We did not report in details the prediction accuracies at a forest compartment level (they were used to choose the settings for k-NN prediction), bearing in mind that most of the compartments did not exhibit any damage neither in the field nor in predictions. Aggregated damage estimation for the whole study area is compatible with the major objective of such assessment, which is to provide general statistics for strategic planning related to the elimination of the consequences of a natural calamity.
One of the major features of non-parametric methods is that we may expect no unrealistic predictions to occur if the reference material is appropriate. In fact, although all forest compartments in the study area were inventoried using color infrared orthophotos and provided with the forest damage characteristics, under operational conditions it may be quite difficult to construct such a set of second-phase observations. The extents of natural calamities such as wind storm damage are first roughly audited in Lithuania by field visits by state forest officers, as has been done in this particular case. Data is usually collected for some parts of compartments that are accessible, known, concentrated on state-owned land, etc. Assuming that the total damage estimates may differ under other conditions, for rapid assessment of forest damage caused by wind storms we still consider the approach using satellite images and stand-wise forest inventory data described in this paper as possessing some potential. The main reason for such optimism is the fact that both satellite images and forest inventory data are available free of charge.
Conclusion
Rapid changes in a forest may be assessed using a combination of satellite images and stand-wise forest inventory data. The overall accuracy of identification of wind-damaged areas achieved, based solely on difference images available from two-date satellite imagery, was 95-98%. The proposed solution for predicting the percentage of damage in terms of wind-fallen or broken stem volume for each forest compartment inside the zone potentially affected by the wind storm using the non-parametric k-nearest neighbors technique and classified difference images originating from two satellite images captured on dates before and after the wind storm event, together with forest compartment characteristics accessed from the Lithuanian State Forest cadastre, resulted in acceptable accuracies at a study area level. Total wind-damaged volume in predominantly pine compartments (~1 180 000 m3) was underestimated by 2.2%, in predominantly spruce compartments (~233 000 m3) by 2.6%, and in predominantly deciduous compartments (~195 000 m3) by 4.2%. The overall underestimation was 2.5%.
References
Gscholar
Gscholar
Gscholar
Gscholar
Gscholar
Gscholar
Gscholar
Gscholar
CrossRef | Gscholar
Gscholar
Gscholar
Gscholar
Gscholar
Gscholar
Gscholar
Gscholar
Gscholar
Gscholar
Gscholar
Authors’ Info
Authors’ Affiliation
Laboratory of Geomatics, Institute of Land Management and Geomatics, Aleksandras Stulginskis University, Studentu 11, LT-53361 Akademija, Kaunas distr. (Lithuania)
Institute of Forest Management and Wood Science, Aleksandras Stulginskis University, Studentu 11, LT-53361 Akademija, Kaunas distr. (Lithuania)
Corresponding author
Paper Info
Citation
Jonikavičius D, Mozgeris G (2013). Rapid assessment of wind storm-caused forest damage using satellite images and stand-wise forest inventory data. iForest 6: 150-155. - doi: 10.3832/ifor0715-006
Academic Editor
Agostino Ferrara
Paper history
Received: Jul 31, 2012
Accepted: Feb 26, 2013
First online: Apr 08, 2013
Publication Date: Jun 01, 2013
Publication Time: 1.37 months
Copyright Information
© SISEF - The Italian Society of Silviculture and Forest Ecology 2013
Open Access
This article is distributed under the terms of the Creative Commons Attribution-Non Commercial 4.0 International (https://creativecommons.org/licenses/by-nc/4.0/), which permits unrestricted use, distribution, and reproduction in any medium, provided you give appropriate credit to the original author(s) and the source, provide a link to the Creative Commons license, and indicate if changes were made.

Web Metrics
Breakdown by View Type
Article Usage
Total Article Views: 59837
(from publication date up to now)
Breakdown by View Type
HTML Page Views: 48970
Abstract Page Views: 4271
PDF Downloads: 4858
Citation/Reference Downloads: 83
XML Downloads: 1655
Web Metrics
Days since publication: 4830
Overall contacts: 59837
Avg. contacts per week: 86.72
Article Citations
Article citations are based on data periodically collected from the Clarivate Web of Science web site
(last update: Mar 2025)
Total number of cites (since 2013): 16
Average cites per year: 1.23
Publication Metrics
by Dimensions ©
Articles citing this article
List of the papers citing this article based on CrossRef Cited-by.
Related Contents
iForest Similar Articles
Review Papers
Accuracy of determining specific parameters of the urban forest using remote sensing
vol. 12, pp. 498-510 (online: 02 December 2019)
Research Articles
Change Detection methods for forest expansion assessment in the last twenty years in the Mediterranean Basin
vol. 18, pp. 69-78 (online: 16 April 2025)
Review Papers
Remote sensing-supported vegetation parameters for regional climate models: a brief review
vol. 3, pp. 98-101 (online: 15 July 2010)
Review Papers
Remote sensing support for post fire forest management
vol. 1, pp. 6-12 (online: 28 February 2008)
Technical Advances
Detecting mistletoe infestation on Silver fir using hyperspectral images
vol. 7, pp. 85-91 (online: 18 December 2013)
Review Papers
Remote sensing of selective logging in tropical forests: current state and future directions
vol. 13, pp. 286-300 (online: 10 July 2020)
Research Articles
Mapping the vegetation and spatial dynamics of Sinharaja tropical rain forest incorporating NASA’s GEDI spaceborne LiDAR data and multispectral satellite images
vol. 18, pp. 45-53 (online: 01 April 2025)
Research Articles
Landsat TM imagery and NDVI differencing to detect vegetation change: assessing natural forest expansion in Basilicata, southern Italy
vol. 7, pp. 75-84 (online: 18 December 2013)
Technical Reports
Detecting tree water deficit by very low altitude remote sensing
vol. 10, pp. 215-219 (online: 11 February 2017)
Research Articles
Integrating area-based and individual tree detection approaches for estimating tree volume in plantation inventory using aerial image and airborne laser scanning data
vol. 10, pp. 296-302 (online: 15 December 2016)
iForest Database Search
Search By Author
Search By Keyword
Google Scholar Search
Citing Articles
Search By Author
Search By Keywords
PubMed Search
Search By Author
Search By Keyword


