
Multi-scale drivers of wildfire burn severity in Central Zagros: insights from remote sensing and machine learning
iForest - Biogeosciences and Forestry, Volume 19, Issue 5, Pages 359-368 (2026)
doi: https://doi.org/10.3832/ifor5027-019
Published: Sep 08, 2026 - Copyright © 2026 SISEF
Research Articles
Abstract
Over the past few decades, wildfire activity has increased globally. In the Central Zagros Mountains of Iran, widespread oak decline has significantly altered fuel structures and raised ecological concerns. However, the specific contribution of long-term vegetation degradation to wildfire burn severity remains under-quantified. This study addresses this gap by investigating whether decadal declines in the Normalized Difference Vegetation Index (NDVI) are associated with higher burn severity, while assessing their relative importance against short-term pre-fire environmental conditions, fuel types, topography, and human access gradients. Focusing on a major wildfire in June 2024 in the Kashkan Watershed, we mapped burn severity using the differenced Normalized Burn Ratio (dNBR) derived from Sentinel-2 imagery. A comprehensive suite of predictors was evaluated, including the long-term NDVI trend (May- September 2014-2023), pre-fire Normalized Difference Moisture Index (NDMI), Land Surface Temperature (LST), fuel categories based on ESA WorldCover, slope, aspect, spatial texture contrast, and distance to roads and settlements. A stratified sampling design supported statistical inference using ordinary least squares regression and predictive modeling via Random Forest and XGBoost algorithms with five-fold cross-validation. XGBoost demonstrated the highest predictive performance (cross-validated R2 = 0.70; RMSE = 0.11), outperforming Random Forest (R2 = 0.64) and linear regression (R2 = 0.34). Fuel moisture (NDMI) and thermal stress (LST) emerged as the primary drivers of severity, followed by land cover, topography, and spatial texture. While the long-term NDVI decline showed a small but consistent positive association with dNBR at the landscape scale, the results highlight a distinct multi-scale mechanism. In this dynamic, pre-fire moisture and temperature establish the broad watershed-scale environmental susceptibility, whereas specific fuel types and their spatial configurations drive the local-level amplification or damping of burn severity. These findings provide a framework for proactive vulnerability mapping in Zagros oak woodlands, suggesting that integrating dynamic fire-weather data and field-based fuel measurements could further refine future predictability.
Keywords
Wildfire, Kashkan Watershed, dNBR (burn Severity), Oak Decline, Random Forest, Vegetation Degradation
Introduction
Wildfire regimes across the globe are changing significantly, with fires becoming more frequent, severe, and widespread than in previous decades; current models predict continued increases due to climate change and forest management practices ([20]). This intensification represents a major shift in how fire behaves in natural systems, moving beyond historical patterns that ecosystems and species have adapted to over thousands of years ([46]). The combination of climate change effects, such as rising temperatures and altered precipitation patterns, with increased human pressures has created conditions that promote more destructive fire behavior, a trend particularly evident in Mediterranean-type ecosystems ([35], [8]). This global surge has been particularly dramatic since 2017, with unprecedented fire behavior occurring in the Mediterranean Basin ([49]), Siberia ([27]), Australia, the Amazon basin, and the Western US ([14]).
Anthropogenic activities, specifically land-use shifts, management practices, and human-caused climate change, serve as critical drivers of global wildfire intensification ([1]). These land-use shifts are often driven by socioeconomic factors such as rural abandonment and the loss of agricultural mosaics, which can lead to large accumulations of combustible biomass or the expansion of flammable plantations ([34], [21]). This results in vast accumulations of combustible material, making the landscape more prone to burning and leading to increasingly large, catastrophic wildfires ([21], [4]). Concurrently, the expansion of human development into the wildland-urban interface (WUI) has significantly increased both ignition sources and fire risks, as proximity to settlements facilitates higher anthropogenic ignition density ([31], [42]). In many regions, this is coupled with reduced cultural or prescribed burning, which, along with high-biomass invasive species, has changed spatial patterns of wildfire risk ([44], [4]). These changes depart from indigenous fire stewardship practices that historically maintained ecosystem balance ([21]).
Burn severity represents a fundamental measure of fire’s environmental impact, defined as the extent of fire-induced change to physical ecosystem components such as vegetation and soil ([22], [40]). This metric is most commonly operationalized through the Differenced Normalized Burn Ratio (dNBR), which allows for a standardized assessment of fire-induced ecological change across diverse forest types ([29]). This metric goes beyond simple fire occurrence to capture the degree of environmental change, making it a critical factor for understanding post-fire ecological dynamics ([40]). The need to better understand factors controlling fire severity stems from concerns about public safety, infrastructure, critical wildlife habitat, and watershed health ([39]). Research has consistently shown that fire severity is controlled by both top-down weather and climate factors and bottom-up spatial controls from fuels and topography ([41]). However, these relationships are complex, as burn severity is co-influenced by forest structural attributes that dictate flammability traits, such as fuel loads and density ([54]).
Modeling the environmental drivers of wildfire is a critical scientific field, as confirmed by global datasets such as the Global Fire Emissions Database (GFED) and MODIS burned area products, which have been developed specifically to link fire occurrence to key environmental drivers, including climate, vegetation, topography, and human factors ([51], [13]). To capture the non-linear and complex interactions among these diverse environmental drivers, recent studies have increasingly used machine learning models to predict fire outcomes with high accuracy. These models frequently utilize vegetation indices, such as the Normalized Difference Vegetation Index (NDVI), as robust proxies for fuel biomass and ecosystem state ([10]). While prior machine learning studies have successfully modeled burn severity using short-term pre-fire conditions ([12], [47]), they often overlook long-term vegetation decline. This is a significant limitation, as decadal NDVI trends reveal gradual forest degradation and mortality that fundamentally alter fuel characteristics and forest structure over time, making fire behavior in chronically stressed forests harder to predict ([23]). To address this, our study focuses on the Zagros Mountains, where forest decline is operationalized as decadal NDVI trends (2014-2023 Landsat data), serving as a proxy for chronic vegetation stress associated with Zagros oak decline syndrome ([28]). By integrating decadal forest degradation into wildfire modeling, this study advances the current state of the art from short-term predictive snapshots to a more holistic ecological framework. Therefore, the primary objectives of this study are: (i) to statistically test the hypothesis that long-term forest decline impacts recent wildfire burn severity; (ii) to assess the relative importance of this long-term trend against critical short-term variables; and (iii) to develop a comprehensive regression model that analyzes the complex interactions between these ecological factors and human factors (distance to roads and settlements) within the Zagros ecosystem.
This study offers practical value for Zagros forest management by developing a predictive framework to map vulnerability hotspots, integrating chronic decline with biophysical risks. It supports local stakeholders (forest services, communities) in preventive strategies like fuel management prioritization and early interventions, enhancing resilience against escalating fire threats ([28]).
Material and methods
Study area
The Kashkan Watershed is situated within the Central Zagros Mountains, which host Iran’s most extensive forest ecosystem, oak-dominated woodlands covering 5-6 million hectares across western Iran and representing 40-44% of the nation’s total forest area ([9]). These ancient semi-arid systems (origins ~5500 years ago - [11]) play a vital role in environmental balance ([28]), but face escalating wildfire frequency and human disturbances, including land use changes, unregulated grazing, deforestation, and tourism ([33], [43])
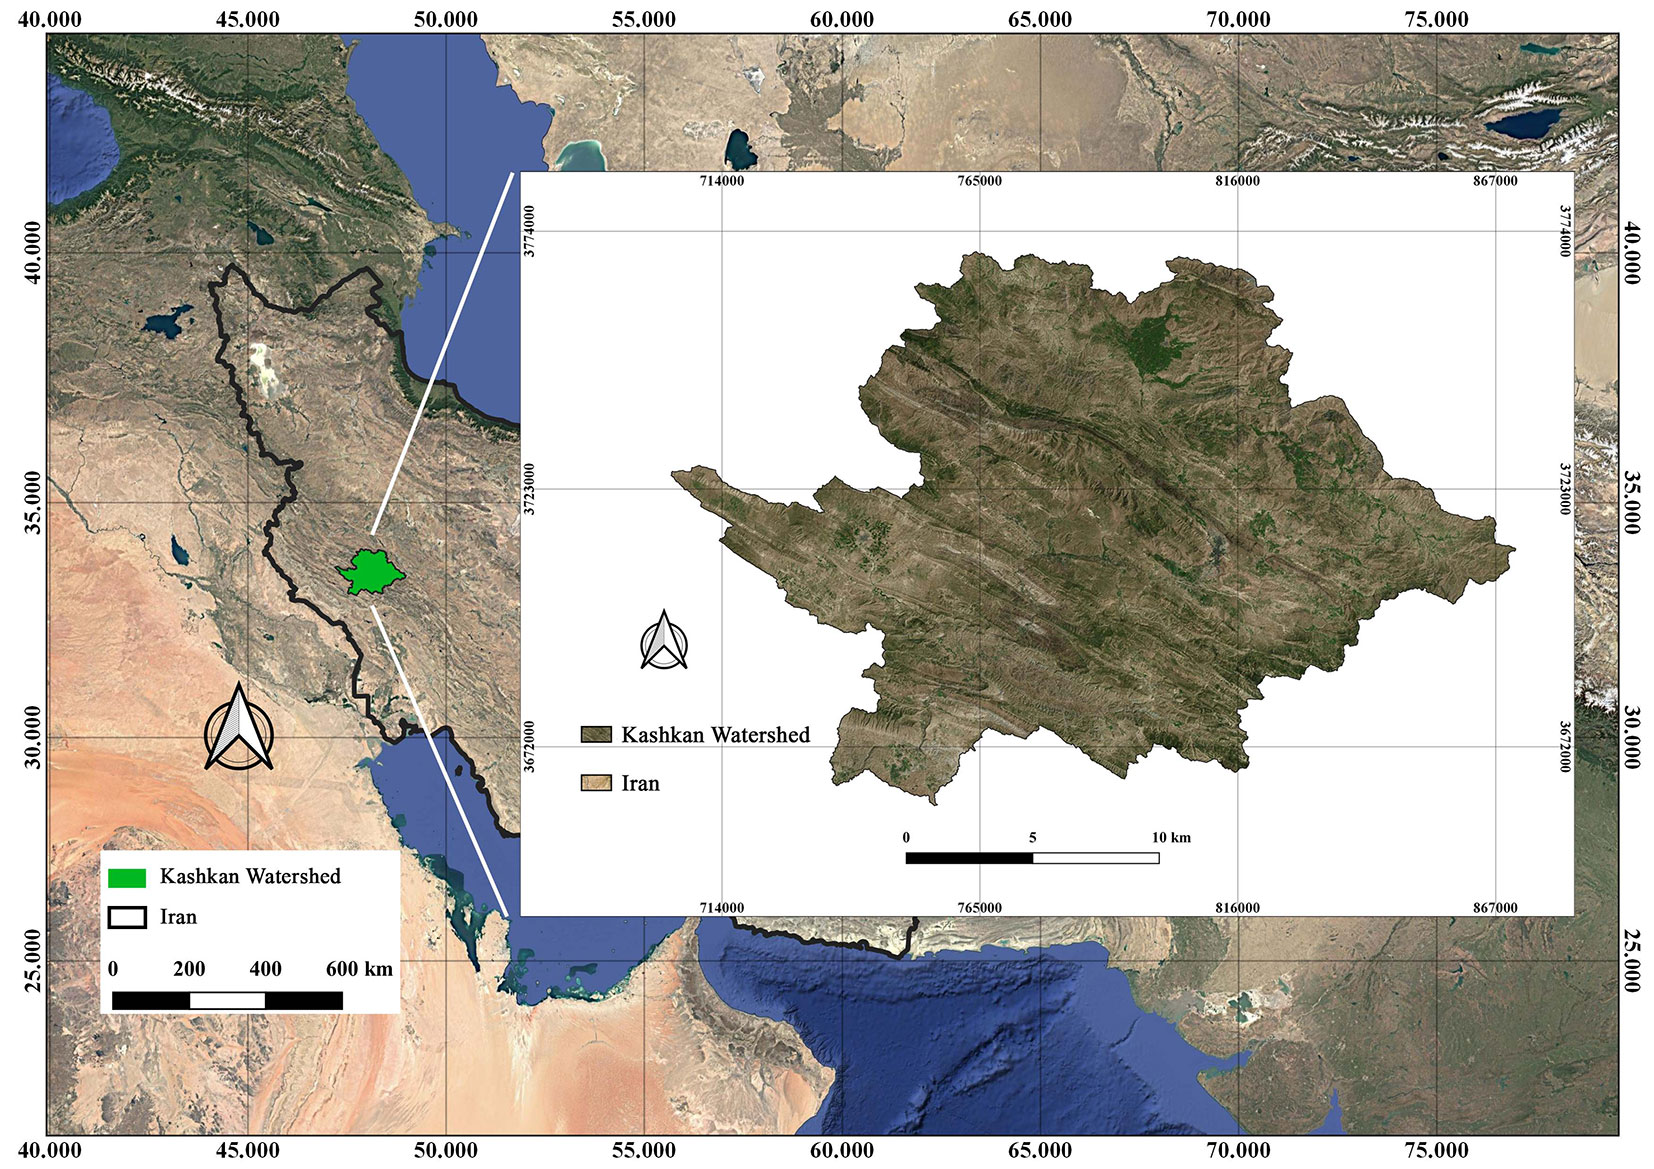
The study was conducted in the Kashkan Watershed (approximately 9540 km2) of Lorestan Province, Central Zagros Mountains, western Iran (Fig. 1). This region features rugged topography (elevation 500-2500 m a.s.l.) and a semi-arid Mediterranean climate, with cool-wet winters (mean annual precipitation ~500 mm) and hot-dry summers (mean temperature ~30 °C) that promote intense fire seasons. Vegetation comprises a mosaic of open oak woodlands, shrublands, grasslands, and rainfed croplands, dominated by Persian oak (Quercus brantii - [28], [45]).
Fig. 1 - Geographical location of the study area. The map illustrates the Kashkan Watershed within the Central Zagros Mountains, Lorestan Province, western Iran. The main panel shows the region’s rugged topography, while the inset map indicates its location in Iran. This area has a semi-arid Mediterranean climate and a vegetation mosaic dominated by Quercus brantii woodlands.
The area is an ideal site for fire-ecosystem analysis because of overlapping pressures: high wildfire susceptibility ([45]) and ongoing Zagros oak decline, which has simplified fuel structures from dense to open woodlands and shrublands ([28]). A major wildfire in June 2024 (~5000 ha burned - [18]) provides a documented case for evaluating burn severity.
Dependent variable: burn severity (dNBR)
Burn severity was mapped using dNBR from Sentinel-2 MSI Level-2A surface reflectance ([58]). Cloud-free composites were created for pre-fire (10-20 June 2024) and post-fire (23 June-12 July 2024) periods to capture the event while minimizing phenological bias. Clouds/ cirrus were masked via the QA60 bitmask. NBR was calculated as per eqn. 1 ([50]):
and dNBR as per eqn. 2:
where NBRpre and NBRpost are the NBR values pre-fire and post-fire, respectively (higher values = greater severity - [50]). Rasters were reprojected to a 30-m UTM grid (EPSG: 32638, Zone 38N) for alignment. The nearest-neighbor resampling method was applied to all layers to preserve the original radiometric integrity of the spectral bands and avoid the artificial smoothing of fire-periphery pixels that results from bilinear interpolation. Land-cover classes such as water bodies and barren lands, which comprised a negligible fraction of the study area (~1.7%), were retained in the modeling phase to ensure a spatially continuous dataset. While these surfaces occasionally exhibited spectral artifacts (false-high dNBR values) due to moisture or turbidity changes, their limited frequency ensured they did not significantly influence the overall performance or generalization of the machine learning model. Additionally, we retained negative dNBR values to preserve the full statistical distribution of the dataset, allowing the model to learn from the complete range of post-fire spectral responses.
Independent variables (predictors)
Tab. 1 - Summary of datasets used in this study.
| Data Category | Data Source / GEE Asset ID |
Resolution | Temporal Coverage | Purpose in Study |
|---|---|---|---|---|
| Long-Term Vegetation & Thermal | Landsat 8 OLI/TIRS C2 T1 L2 | 30 m | 2014-2023 | NDVI trend, LST |
| Fire Event & Fuel Moisture | Sentinel-2 MSI (Level-2A) | 20 m | June-July 2024 | dNBR, NDMI |
| Land Cover (Fuel Type) | ESA WorldCover 2021 | 10 m | 2021 | LandCover |
| Topography | DEM (User Asset) | 30 m | Static | Slope, Aspect |
| Human Factors 1 (Roads) | Roads Vector | Vector | 2023 | Road distance |
| Human Factors 2 (Villages) | Settlements Vector | Vector | 2023 | Distance to villages |
| Image Texture (from NDVI) | Derived in GEE: GLCM from pre-fire NDVI (3×3) and local variance | 10 m (sampled at 30 m) | June 2024 | Texture Contrast; Texture Homogeneity; Texture Variance |
| Study Boundary | AOI Vector | Vector | Static | Analysis Boundary |
To model burn severity drivers, we selected predictor variables encompassing long-term vegetation dynamics, pre-fire biophysical conditions, topography, fuel structures, and anthropogenic proximity; all features are detailed in Tab. 1. To address our primary research aim regarding forest decline, we operationalized long-term vegetation dynamics as annual May-September NDVI trends (2014-2023). We derived these trends on a pixel-wise basis from Landsat-8/9 Collection 2 imagery using ordinary least squares (OLS) slope calculation with the “linearFit” reducer in Google Earth Engine® (GEE). To ensure data quality, we applied cloud and shadow masking via the QA PIXEL band. We further mitigated potential atmospheric artifacts by calculating the annual mean NDVI for each growing season before trend estimation. Negative slope values indicate chronic vegetation decline ([57]). To capture immediate pre-fire conditions, we utilized the Normalized Difference Moisture Index (NDMI) derived from multi-scene median composites of Sentinel-2 imagery (June 10-20, 2024) to represent canopy moisture (eqn. 3):
Additionally, Land Surface Temperature (LST) was calculated from multi-scene mean composites of Landsat-8 Collection 2 imagery (May 1 - June 20, 2024). These biophysical metrics were aggregated using temporal averaging (median for NDMI and mean for LST) to ensure a representative baseline that aligns with the phenology of the dNBR evaluation period ([50]).
We incorporated topographic controls on fire spread using a 30-m SRTM Digital Elevation Model to extract slope and aspect, with the latter encoded into sine and cosine components to account for its circular nature ([56]). To represent fuel models, we utilized the ESA WorldCover 2021 (10 m) product, reclassified into five fuel-oriented categories: Closed Forest, Open Forest, Shrub/Grassland, Cropland, and Bare/Water. The decision to merge shrublands and grasslands into a single class was based on their ecologically similar fire behavior in semi-arid ecosystems. Both vegetation types serve as fine surface fuels with high combustibility and rapid drying rates, acting as the primary carriers of fire. In the Zagros context, these classes often form a continuous surface fuel complex that facilitates fire spread, justifying their consolidation for improved modeling robustness. The categorical data were one-hot encoded (drop-first) to prevent multicollinearity ([19], [59]). Spatial structural heterogeneity was quantified using the Gray-Level Co-occurrence Matrix (GLCM) contrast. To ensure spatial consistency with the 30-m dependent variable (dNBR) and other environmental predictors, the Sentinel-2 NIR band was first aggregated to 30-m resolution before texture computation. We then applied a 3×3 kernel to capture stand-level horizontal fuel continuity and canopy complexity, providing the machine learning model with contextually relevant structural information ([61]). Finally, we mapped human access gradients, key drivers of ignition probability, using vector layers of road networks and settlements. Euclidean distances to the nearest road and village were calculated at a 30-m resolution across the entire study area to ensure a continuous and accurate distance gradient. We then masked these proximity layers to vegetated and burnable surfaces during final data stacking. To accommodate the non-linear decay effects of these proximity variables within our models, we retained both raw distances and their log1p-transformed versions ([12], [24]). We aligned and stacked all spatial layers into a unified raster mosaic for subsequent sampling.
Sampling strategy and statistical analysis
To construct a robust analytical dataset from the continuous raster mosaic, we employed a stratified random sampling approach based on burn severity classes. We stratified dNBR values into four categories to ensure a balanced, representative sample across the full spectrum of fire effects: Unburned/Regrowth (dNBR < 0.10), Low (0.10 ≤ dNBR < 0.27), Moderate (0.27 ≤ dNBR < 0.44), and High severity (dNBR ≥ 0.44). This stratification ensured balanced representation, extracting five points per class per square kilometer. Following multiple iterations and strict quality control to remove non-finite values, the final dataset comprised 89,314 valid points ([58] - see Appendix 1 in Supplementary material).
For statistical inference, we established a baseline using Ordinary Least Squares (OLS) regression. Multicollinearity was assessed by computing Variance Inflation Factors (VIF) after all transformations (log1p) and dummy encoding (drop-first) were applied. We used an iterative screening process in which we recursively removed the variable with the highest VIF and recalculated VIF values for the remaining predictors until all variables met the threshold (VIF < 8). Finally, we applied HC3 robust standard errors to account for potential heteroscedasticity ([25], [26]). To capture complex, non-linear relationships, we employed Random Forest and XGBoost algorithms. To ensure optimal performance and prevent overfitting, we tuned hyperparameters using a grid search across a predefined parameter space (e.g., tree depth, number of estimators, and learning rate). We then selected the best-performing configurations for the final models: Random Forest (500 estimators, max depth of 15) and XGBoost (600 estimators, learning rate of 0.08). Model performance was rigorously evaluated using five-fold cross-validation (4×4 grid bins) to account for spatial autocorrelation, relying on cross-validated R2 and Root Mean Square Error (RMSE) to assess generalization ([3], [5], [47], [38]). Furthermore, feature importance was extracted to rank driver influence, utilizing “Mean Decrease in Impurity” (MDI) for the Random Forest model and the “Gain metric” for the XGBoost model. Finally, non-parametric tests (Mann-Whitney U and Kruskal-Wallis) were utilized to assess group-level differences, as preliminary Shapiro-Wilk tests indicated that the dNBR data violated the assumption of normality.
All geospatial data were processed in Google Earth Engine (GEE) for consistency and reproducibility ([32] - see also Appendix 1 in Supplementary material).
Results
Descriptive statistics and spatial patterns
The cleaned analytical dataset contains 89,314 valid records. Descriptive statistics for all continuous variables are summarized in Tab. 2 as the basis for subsequent inference and modeling. The dependent variable dNBR showed a mean of 0.25 with substantial spread (standard deviation, SD = 0.20), indicating wide heterogeneity in burn severity across the landscape. The long-term decadal NDVI trend prior to the fire was near-neutral on average (mean = 0.01; SD = 0.01), suggesting overall stability with localized decline or recovery signals rather than a strong basin-wide trend.
Tab. 2 - Descriptive statistics for continuous variables used in the analysis (N = 89,314). (SD): standard deviation.
| Variable | Mean | SD |
|---|---|---|
| dNBR | 0.25 | 0.20 |
| NDVItrend | 0.001 | 0.01 |
| Slope | 9.19 | 8.71 |
| Aspect | 181.87 | 105.29 |
| LST | 33.19 | 6.58 |
| NDMI | 0.08 | 0.22 |
| Road distance | 1976.79 | 2346.26 |
| Distance to villages | 1717.55 | 2163.50 |
| Log-transformed distance to roads | 6.84 | 1.38 |
| Log-transformed distance to villages | 6.99 | 0.93 |
| Texture Contrast | 169.02 | 346.05 |
| Texture Homogeneity | 0.18 | 0.11 |
| Texture Variance | 83.45 | 168.94 |
Pre-fire biophysical conditions depict moderately warm and variably moist canopies, with Land Surface Temperature (LST) averaging 33.19 °C (SD = 6.59) and NDMI averaging 0.08 (SD = 0.22), consistent with semi-arid summer conditions that modulate available fuel moisture. The landscape exhibits complex terrain, with a mean slope of 9.19° (SD = 8.72) and an aspect covering the full directional range (mean = 181.88°), creating diverse physical and microclimatic conditions that locally influence fire spread and resulting burn-intensity patterns.
Human-access gradients exhibit pronounced right-skewness typical of proximity variables: mean distance to the nearest road is 1976.79 m (SD = 2346.26), and mean distance to the nearest settlement is 1717.55 m (SD = 2163.50), motivating the use of log1p transformation in the learning models, along with raw distances, to capture non-linear decay effects. The transformed counterparts reflect this stabilization, with the log-transformed distance to roads averaging 6.84 (SD = 1.38) and the log-transformed distance to villages averaging 6.99 (SD = 0.93). This transformation improves numerical behavior without losing critical information at zero distances.
Fine-scale structural heterogeneity of the pre-fire landscape is evident in the spatial texture distributions. Specifically, texture contrast exhibits a high mean and substantial dispersion (mean = 169.02; SD = 346.05), texture homogeneity is concentrated near low values (mean = 0.18; SD = 0.11), and texture variance is broadly spread (mean = 83.45; SD = 168.94). These patterns collectively support the inclusion of a single screened texture metric (contrast) to reduce redundancy while retaining critical signals of fuel continuity.
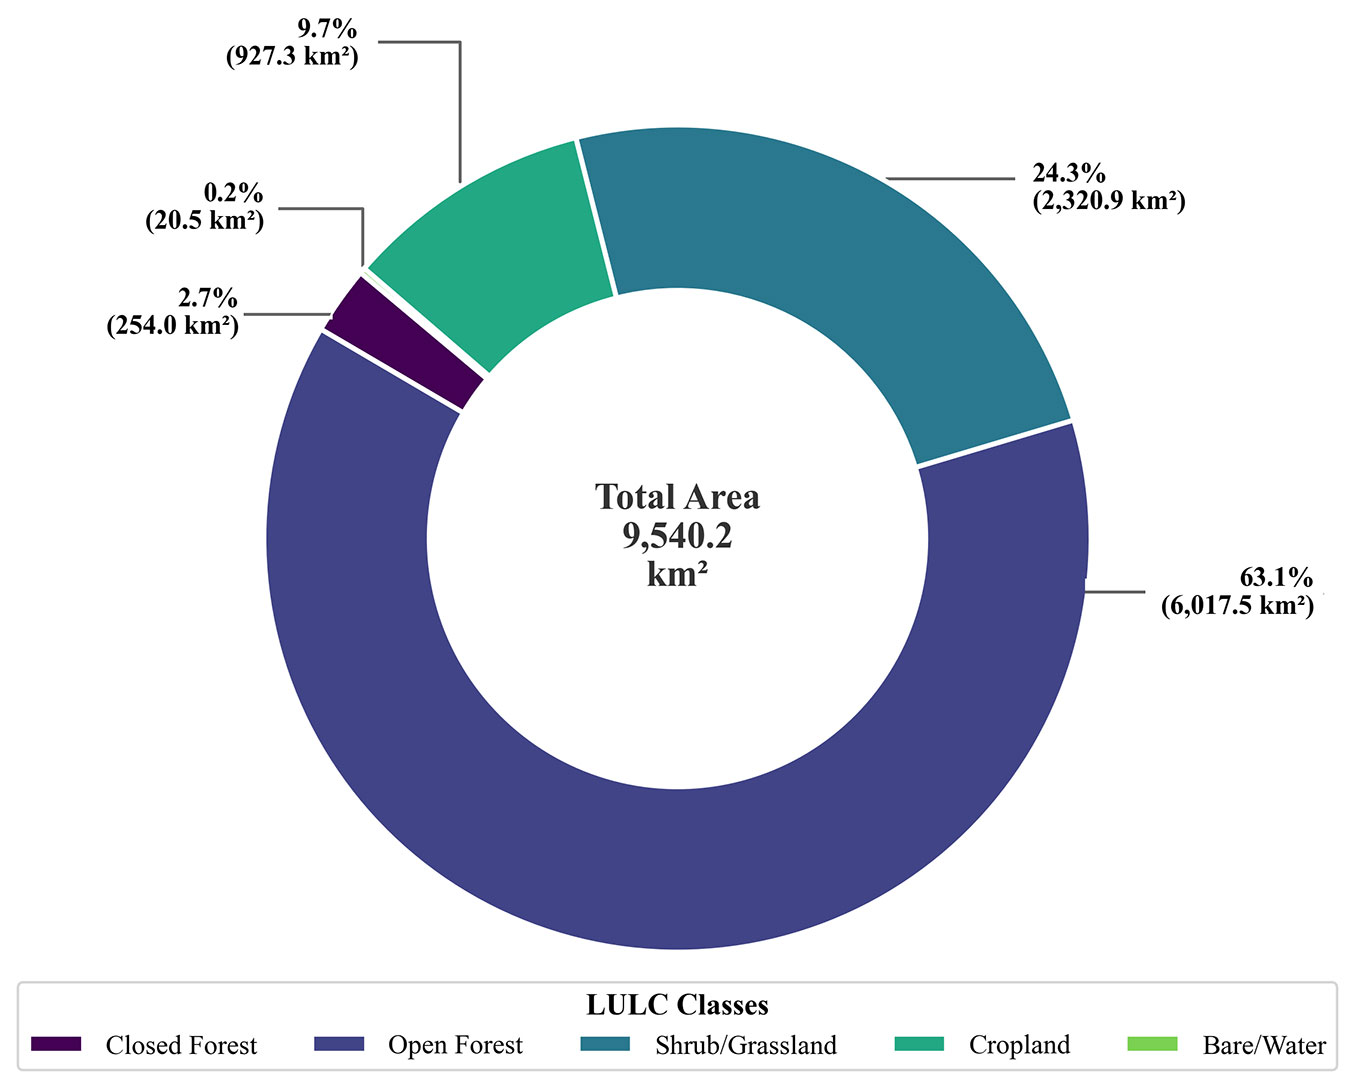
The land cover composition over the 9540.20 km2 study area is illustrated in Fig. 2. The landscape was predominantly characterized by Open Forest, which constituted 63.10% (6017.50 km2) of the total area. Shrub/Grassland was the second most prevalent category, covering 24.30% (2320.90 km2). Other significant land cover types included Cropland at 9.70% (927.3 km2) and Closed Forest at 2.70% (254 km2). The Bare/Impervious/Water class represented a negligible fraction of the total area at just 0.20% (20.5 km2).
Fig. 2 - Distribution of land cover and fuel types in the Kashkan Watershed. The donut chart illustrates the area (km2) and percentage of the five reclassified ESA WorldCover 2021 categories used in the modeling process. Open Forest and Shrub/Grassland represent the dominant fuel complexes in the study area, while non-burnable surfaces (Bare/Water) constitute a negligible fraction (0.2%).
Spatial distribution of key variables
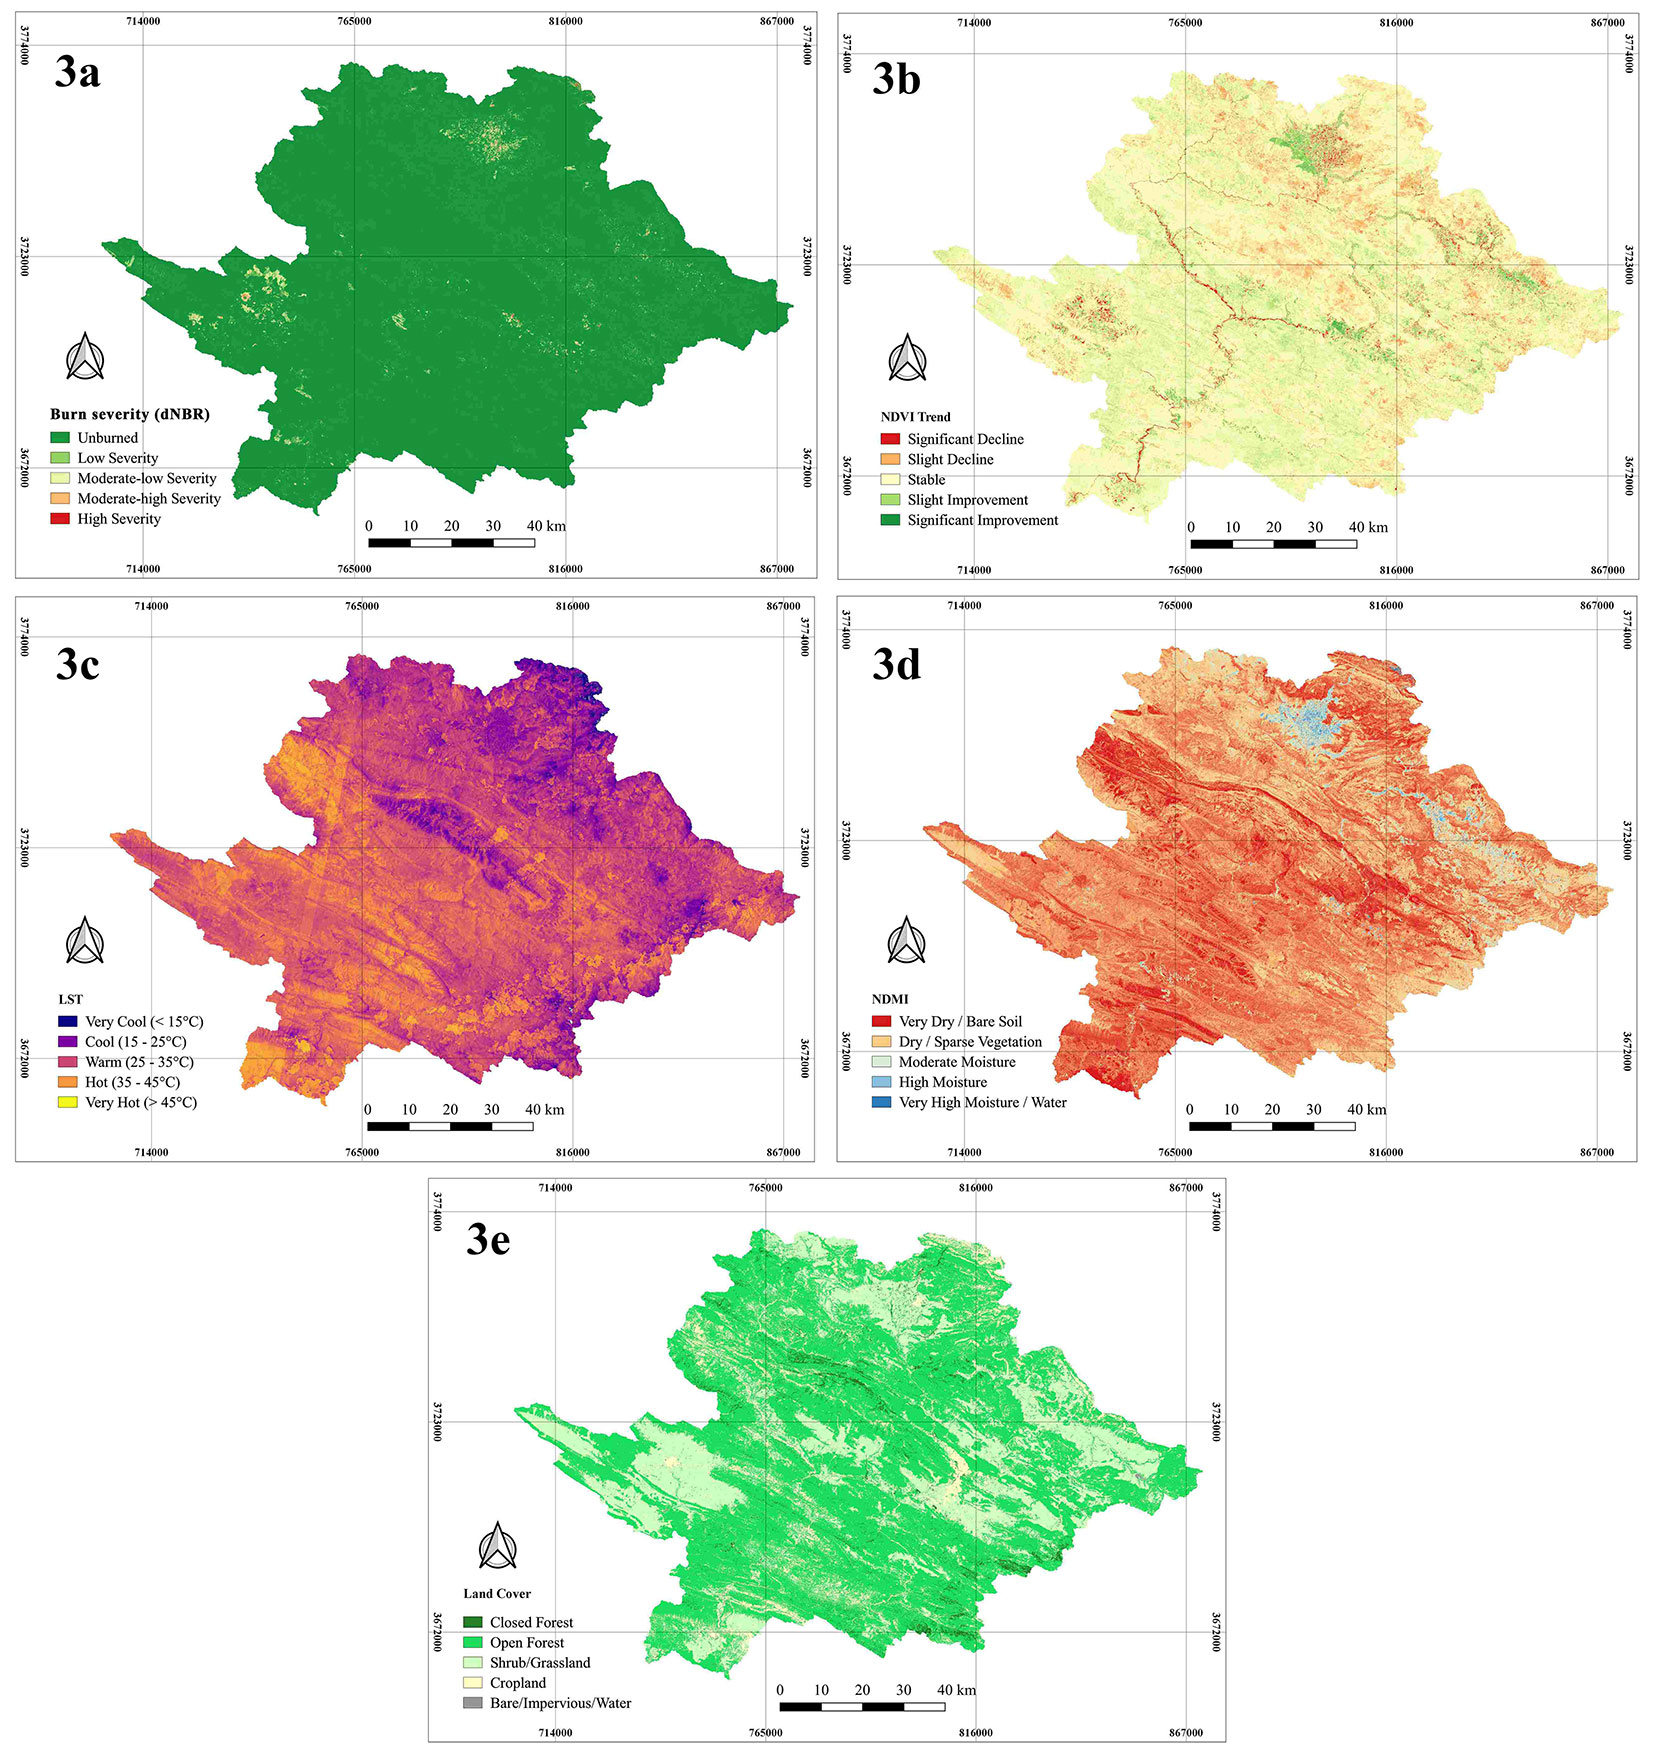
The spatial distribution of burn severity (dNBR) across the basin was notably heterogeneous (Fig. 3a). While the landscape was predominantly affected by low and moderate-low severity burns, several distinct clusters of high severity were observed, particularly in the western and northern portions. Ecologically, this pattern corresponds spatially with the decadal NDVI trend (Fig. 3b), where many of the high-severity clusters coincided with areas exhibiting significant long-term vegetation decline. This visual correlation supports our hypothesis that prolonged ecosystem stress, which likely increases dead biomass and alters fuel continuity, exacerbates fire impacts. Conversely, areas characterized by vegetation stability or improvement were generally associated with lower burn severities. Pre-fire biophysical conditions also showed clear spatial structuring: Land Surface Temperature (LST) was highest in the lower-elevation, sparsely vegetated areas in the south, while NDMI indicated higher canopy moisture content in the densely forested northern highlands (Fig. 3c, Fig. 3d). Together, these spatial patterns highlight how moisture deficits and chronic forest decline converge to create pockets of high vulnerability, providing crucial context for interpreting the regression models.
Fig. 3 - Spatial distribution of environmental and fire-related variables. (a) dNBR: classified into Unburned (less than 0.10), Low (0.10-0.27), Moderate (0.27-0.44), and High severity (greater than or equal to 0.44) based on Key & Benson ([22]), adapted for Zagros canopy density. (b) NDVI Trend: 10-year Sen’s slope (2014-2023) categorized into Significant Decline (less than -0.04), Slight Decline (-0.04 to -0.01), Stable (-0.01 to +0.01), and Improvement (greater than +0.01). (c) LST: classified by 10 °C intervals to represent regional thermal gradients. (d) NDMI: thresholds represent moisture stress (less than 0) to high canopy moisture (greater than 0.4). (e) Land Cover: derived from ESA WorldCover 2021 standard classes.
Model performance and feature importance
Statistical comparisons of pixel groups further reinforced these spatial observations. Burn severity was significantly higher in areas with a negative long-term NDVI trend compared to areas with stable or positive trends (Z = 18.81, p < 0.001, r = 0.06). Group summaries showed higher severity for declining pixels (mean/median dNBR = 0.26/0.28, N = 38.619) than for healthy or stable pixels (mean/median = 0.24/0.23; N = 50.695). This quantitatively confirms the linkage between previous vegetation decline and elevated burn severity (Tab. 3). Across the primary land-cover classes, burn severity differed significantly (Kruskal-Wallis H = 13.616.97, p < 0.001). To account for the large sample size and ensure that our findings reflect meaningful ecological variation, we calculated the effect size using epsilon-squared (ε2), which was found to be 0.15, indicating a moderate and robust relationship between fuel type and fire severity. The shrub and grassland class exhibited the highest central tendency (mean = 0.30), while closed forest showed the lowest (mean = 0.07 - Tab. 4). This pronounced contrast, even after excluding non-burnable surfaces to mitigate spectral noise, highlights the role of fuel structure; the fine, contiguous surface fuels in shrublands facilitate more intense burning compared to the more moisture-buffered closed-canopy oak stands.
Tab. 3 - Comparison of burn severity (dNBR) between declined and healthy vegetation areas.
| Vegetation Trend Status | N | Mean dNBR |
Median dNBR |
Std. Dev. dNBR |
|---|---|---|---|---|
| Declined (NDVI trend < 0) | 38619 | 0.26 | 0.28 | 0.20 |
| Healthy / Stable (NDVI trend ≥ 0) | 50695 | 0.24 | 0.23 | 0.20 |
| Mann-Whitney U test | Z = 18.80, p < 0.0001, Effect size r = 0.06 | |||
Tab. 4 - Comparison of burn severity (dNBR) across land cover classes.
| Land Cover Class | N | Mean dNBR |
Median dNBR |
Std. Dev dNBR |
|---|---|---|---|---|
| Closed Forest (Class 1) | 819 | 0.07 | 0.001 | 0.13 |
| Open Forest (Class 2) | 25901 | 0.14 | 0.01 | 0.20 |
| Shrub/Grassland (Class 3) | 57253 | 0.30 | 0.30 | 0.17 |
| Cropland (Class 4) | 3794 | 0.19 | 0.002 | 0.27 |
| Kruskal-Wallis test | H = 13616.97, p < 0.001; Epsilon-squared (ε 2 ) = 0.155; k classes = 4 (burnable fuel types) | |||
Fig. 4 illustrates the out-of-sample performance under 5-fold cross-validation, demonstrating that XGBoost achieved the best generalization (cross-validated R2 ≈ 0.70, RMSE ≈ 0.11), followed by Random Forest (cross-validated R2 ≈ 0.64, RMSE ≈ 0.12). Both models displayed high stability across data splits (R2 standard deviation ≈ 0.00). The strong predictive capacity of these tree-based models indicates that burn severity in the Zagros ecosystem is driven by complex, non-linear interactions among predictors. The random k-fold cross-validation used here may yield optimistic performance metrics because of the strong spatial autocorrelation inherent in raster data. Consequently, the cross-validation metrics reported in Tab. 4 should be interpreted as upper-bound estimates of generalization.
Fig. 4 - Comparative performance analysis of Random Forest (RF) and XGBoost models. (a) Model goodness-of-fit based on training and 5-fold cross-validated R2 values. (b) Predictive error based on mean cross-validated RMSE. The red values above the bars in panel (b) represent the standard deviation of R2 across cross-validation folds, indicating the high stability and consistency of both ensemble learners.
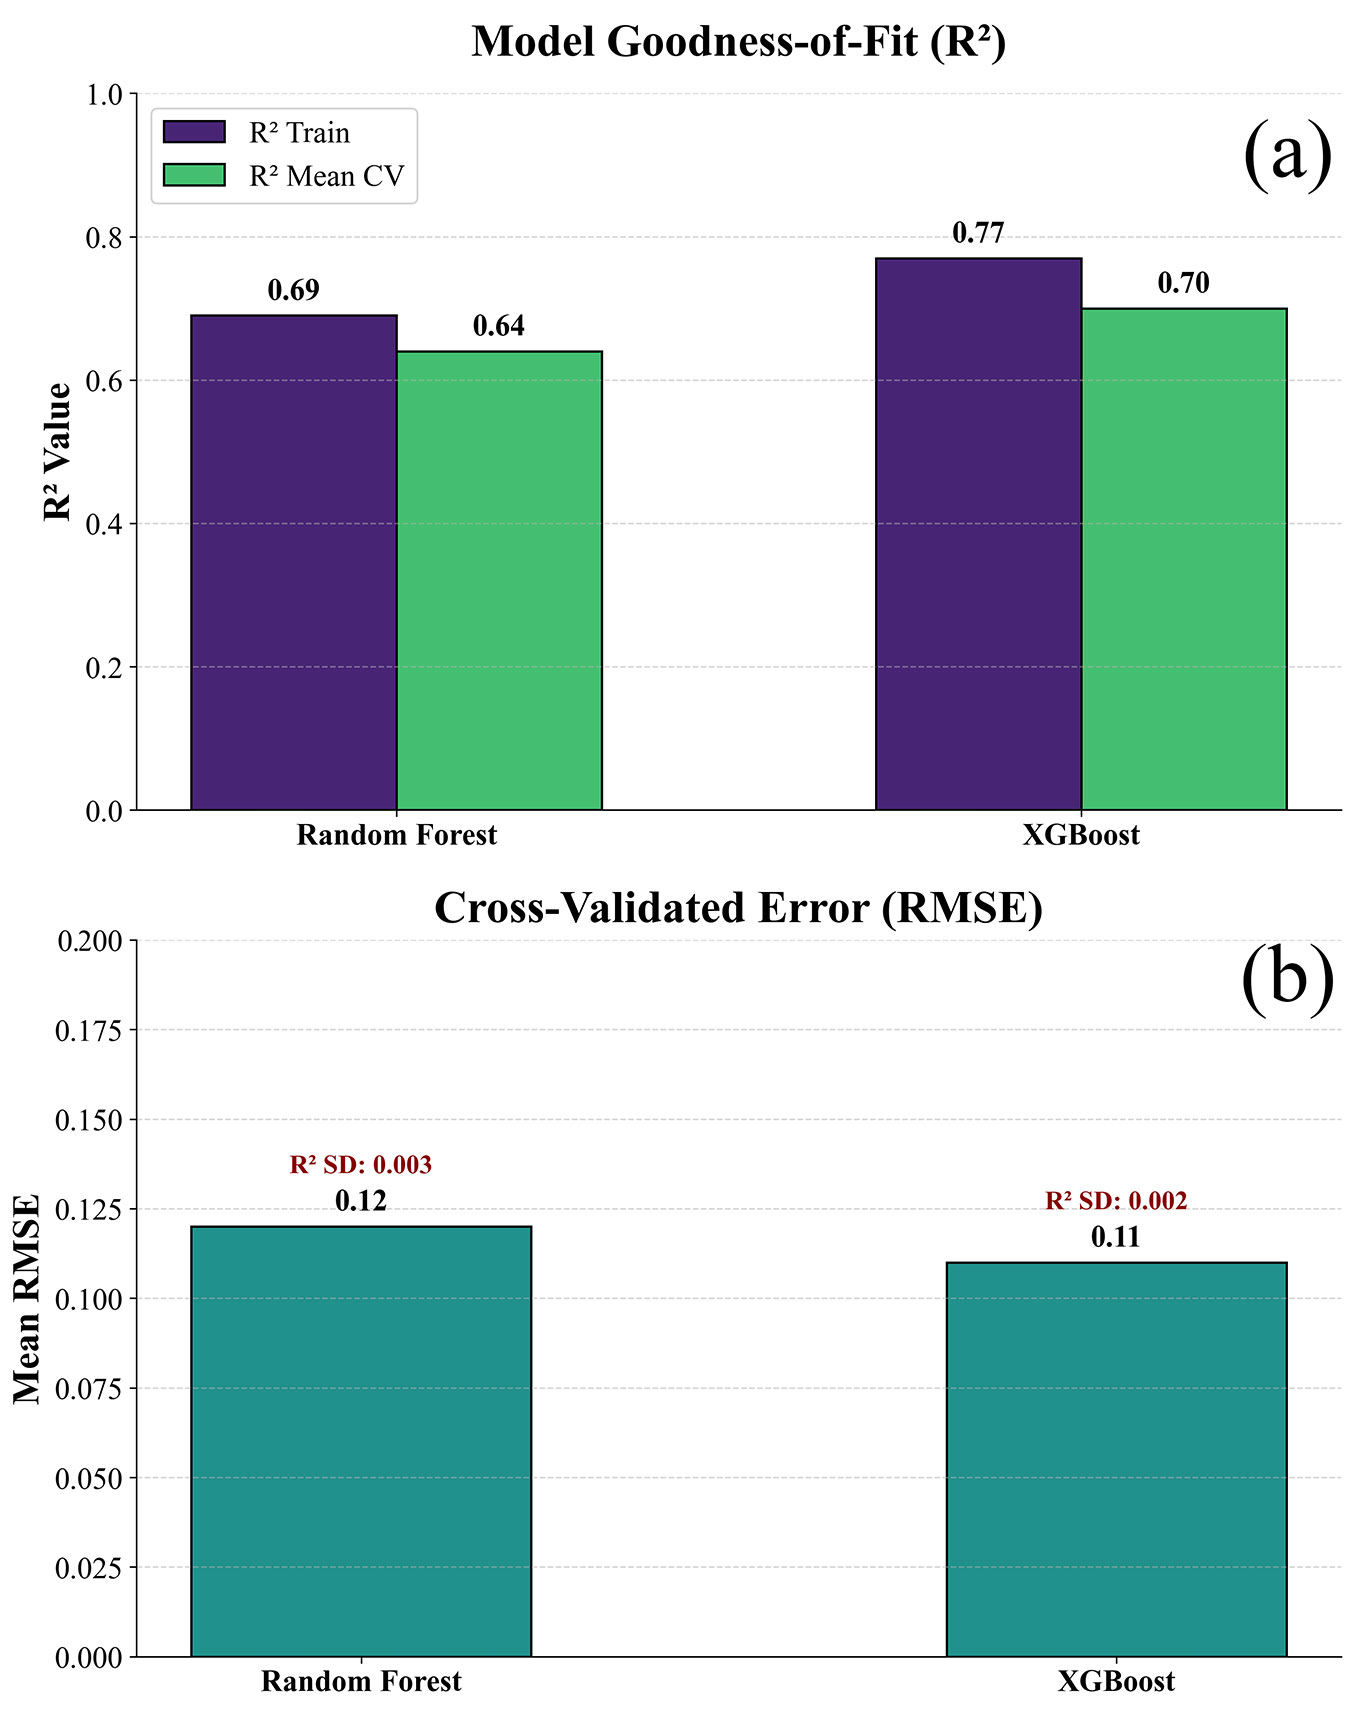
Regarding variable importance (Tab. 5), the Random Forest model identified moisture (NDMI) as the most influential predictor, followed by thermal stress (LST) and slope. Secondary drivers included proximity to roads, the decadal NDVI trend, and spatial texture contrast. For the XGBoost model, categorical land cover emerged as the primary feature, followed by NDMI, slope, and distance to roads.
Tab. 5 - Feature-importance rankings from Random Forest and XGBoost for predicting burn severity (dNBR). (Imp): Importance.
| RF Feature | Imp | XGB Feature | Imp |
|---|---|---|---|
| NDMI | 0.32 | Bare/Water (Class 5.0) | 0.51 |
| LST | 0.09 | NDMI | 0.12 |
| Slope | 0.09 | Cropland (Class 4.0) | 0.08 |
| Log-transformed distance to roads | 0.08 | Shrub/Open Forest (Classes 2 & 3) | 0.04 |
| Distance to roads | 0.07 | Slope | 0.03 |
| NDVItrend | 0.06 | Distance to roads | 0.03 |
| TextureContrast | 0.06 | LST | 0.02 |
| Distance to villages | 0.05 | Log-transformed distance to roads | 0.02 |
| Log-transformed distance to villages | 0.05 | NDVItrend | 0.02 |
| Bare/Water (Class 5.0) | 0.03 | TextureContrast | 0.02 |
| Aspect (sine) | 0.01 | Log-transformed distance to villages | 0.02 |
| Aspect (cosine) | 0.01 | Distance to villages | 0.02 |
| Cropland (Class 4.0) | 0.01 | Aspect (cosine) | 0.01 |
| Shrub/Open Forest (Classes 2 & 3) | 0.01 | Aspect (sine) | 0.01 |
Multicollinearity among continuous predictors was generally low to moderate (Tab. S1 in Supplementary material). For instance, LST and NDMI showed Variance Inflation Factors (VIF) of 2.74 and 3.17, respectively, while topographic, spatial texture, and proximity variables remained near 1.00 to 1.60. As expected, land-cover indicators exhibited larger VIFs (up to 7.19 for the combined shrub and grassland class). These diagnostics justify our use of tree-based learners, which robustly handle remaining categorical collinearity while effectively capturing the underlying ecological drivers of fire severity.
Linear regression results
The ordinary least squares (OLS) baseline model offered an interpretable approximation of burn-severity drivers, yielding a moderate fit (R2 = 0.34, adj-R2 = 0.34, F = 5041, p < 0.001, N = 89.314). While these linear relationships explain roughly one-third of the variance in dNBR, the substantial performance gap between OLS and the ensemble algorithms highlights that the ecological mechanisms driving fire severity in the Zagros Mountains are fundamentally non-linear and rely heavily on the synergistic effects of moisture gradients, terrain, and long-term degradation.
Discussion
Interpretation of key findings
The results indicate that machine learning algorithms, particularly tree-based ensembles, provide a robust predictive framework for modeling burn severity (dNBR) within the heterogeneous Zagros landscape ([47]). However, compared to simpler parametric models, these enhanced predictive capacities should be interpreted contextually, bearing in mind that random cross-validation yields upper-bound estimates due to spatial autocorrelation.
These values are particularly noteworthy because the analyzed fire event was dominated by low-to-moderate severity, which compresses the dynamic range of the response variable and lowers the theoretical ceiling for explained variance. The ability of these models to recover spatially coherent patterns under such circumstances indicates non-linear structures and complex interactions among the drivers of burn severity, which linear models cannot capture.
Model explainability from both ensembles converges on a moisture-thermal mechanism as the primary driver, which is further modulated by fuel type and its spatial structure ([47]). In the Random Forest model, moisture (NDMI) and temperature (LST) emerged as the most influential predictors, followed by slope, proximity to roads, the decadal NDVI trend, and spatial texture contrast. Consistent with well-established literature, this hierarchy confirms that pre-fire fuel moisture and surface temperature impose first-order constraints on fire effects, while topography and anthropogenic access gradients shape where intense burning is most likely to occur ([12], [41]). The XGBoost model corroborates the primacy of NDMI but elevates the importance of categorical land cover classes, most notably bare/impervious land (class 5.0) and, to a lesser extent, cropland (class 4.0) and the merged shrubland/open-forest class (classes 2 and 3), above many continuous predictors. Collectively, these results suggest a multi-layered dynamic. At the broader watershed scale, fuel moisture (NDMI) and thermal stress (LST), the top continuous predictors in our models, establish the baseline environmental susceptibility. Conversely, at the local patch level, specific fuel types and spatial configurations drive the amplification or damping of burn severity. This local modulation is empirically supported by the XGBoost model, which prioritized categorical land cover as the most critical feature, and the Kruskal-Wallis test results (H = 13.616.97, p < 0.001). Specifically, the significant contrast between the high severity in contiguous fine fuels (Shrublands/Grasslands, mean = 0.30) and the lower severity in more resilient, moisture-buffered structures (Closed Forest, mean = 0.07) provides clear evidence of how local fuel characteristics modify the fire’s impact.
These model-derived patterns are reinforced by independent statistical tests. The Mann-Whitney U test revealed that pixels with a negative long-term NDVI trend experienced significantly higher dNBR values ([48]), directly supporting the hypothesis that chronic vegetation decline predisposes ecosystems to more severe fires by reducing live fuel moisture and increasing the load of receptive fine fuels. Furthermore, the Kruskal-Wallis test confirmed significant differences in burn severity among land cover classes. Among vegetated types, shrubland/grassland exhibited the highest median severity, followed by open forest and cropland, while closed-canopy forest was the least severely burned ([30]). This pattern aligns with expected differences in fuel continuity, loading, and moisture-buffering capacity across these vegetation types.
Synthesizing these findings, burn severity in the Zagros is best understood as an outcome of multi-scale interactions. At the macro-scale, pre-fire moisture and surface temperature establish the primary constraints on watershed-level fire potential. Concurrently, at the local scale, fuel type and neighborhood structure, captured by spatial texture, govern fire propagation and intensification. Finally, contextual factors such as terrain and anthropogenic access gradients further modify fire exposure and spread potential. This integrated understanding explains why flexible, non-linear models that can learn complex interactions generalize far better than their linear counterparts in an environment characterized by a limited dynamic range and complex spatial controls ([47]).
Comparison with existing research
Our cross-validated model performance (XGBoost R2 ≈ 0.70 and Random Forest R2 ≈ 0.65) is consistent with results from other studies in structurally complex forests where modeling relies solely on static variables. Previous research has consistently affirmed the power of Random Forest for predicting burn severity ([17], [6]). As noted in literature reviews, a key challenge is that much of the unexplained variance in such static models do not stem from algorithmic limitations, but from the absence of dynamic fire-weather and fine-scale fuel moisture data ([30]).
Our finding that moisture (NDMI) and temperature (LST) are the most influential predictors aligns with other research highlighting the critical role of these factors. For instance, studies have shown that Land Surface Temperature (LST) is a foundational variable in developing burn severity indices ([60]). Similarly, a large-scale analysis in Canada’s mountain national parks found that variables related to vegetation moisture and temperature (like NDMI and LST) were among the most important drivers of burn severity (dNBR - [55]). This convergence underscores a widely applicable moisture-thermal mechanism.
This distinction resolves apparent contradictions in previous NDVI-burn severity studies. Current research on Normalized Difference Vegetation Index (NDVI) and burn severity relationships reveals seemingly contradictory findings that highlight this complexity. Studies have found that higher NDVI values immediately before fire events are associated with increased burn severity ([16]). However, pre-fire forest health as measured by NDVI also plays a crucial role in post-fire recovery patterns. Areas with higher pre-fire NDVI values showed significant increases in post-fire forest recovery metrics compared to areas with lower pre-fire NDVI values, suggesting that healthier pre-fire forest conditions may result in faster forest recovery ([53], [2]).
Our novel finding that a decadal negative NDVI trend enhances prediction is consistent with the principles of time-series analysis for forest monitoring. In this approach, long-term trends in satellite data, such as from Landsat, are used to detect and quantify changes in forest health and cover over time ([37]). The observed association between the decadal NDVI trend and high burn severity suggests that long-term vegetation decline may act as a slow-acting predisposing factor. Rather than directly driving fire intensity, this trend could reflect an ecosystem’s increasing vulnerability to severe fire over time.
Our models revealed that landscape structure, particularly vegetative land-cover types, plays a significant role in predicting fire severity. However, interpretations of land-cover influence must account for spectral artifacts; non-burnable surfaces (e.g., Bare/Water) can exhibit artificially high dNBR values due to edge effects, potentially confounding machine-learning outputs if not masked. The high importance of the land cover variable is consistent with findings that emphasize the need for vegetation-specific information to improve burn severity prediction ([15]). Furthermore, the higher severity observed in shrublands than in dense forests aligns with studies showing that severity varies significantly across vegetation layers ([36]). The importance of spatial texture has also been confirmed elsewhere; for example, Hultquist et al. ([17]) identified texture as a key predictor in their Random Forest model. While high dNBR values over bare surfaces are often artifacts of spectral edge effects ([7]), our conclusions regarding land-cover controls remain robust. By explicitly excluding these non-burnable surfaces from our core statistical evaluations (Tab. 5), we confirmed that structural differences among actual vegetative fuel types (e.g., shrublands vs. forests) genuinely drive the observed fire severity patterns. The high importance of non-burnable surfaces in the XGBoost model reflects the algorithm’s ability to maximize predictive accuracy by identifying “zero-severity” boundaries, although we excluded these areas from ecological mean-comparison tests to avoid biasing the drivers of actual fuel consumption.
A substantial portion of the residual uncertainty in our model likely stems from the absence of dynamic fire-weather data. While we do not directly test this in our study, the literature suggests these variables are critical, and studies that integrate them often report significant improvements in model accuracy. For instance, Vanderhoof et al. ([52]) increased their Random Forest model’s R2 from 0.46 to 0.78 by adding event-specific weather indices like wind speed. This confirms that the primary limitation in predictive precision is often limited access to top-down forcings, a challenge also identified as a barrier to comparing results across studies ([30]).
Novelty, limitations, and future research directions
The primary novelty of this work lies not in the individual methodological components, but in their regional integration; we combined long-term NDVI trends with short-term biophysical variables and texture metrics to create a comprehensive, multi-scale framework for burn-severity modeling specific to the Zagros ecosystem. This was achieved by jointly integrating (i) long-term ecosystem decline (the decadal NDVI trend), (ii) pre-fire biophysical status (NDMI, LST), and (iii) a collinearity-screened GLCM texture metric. While machine learning has been used to model fire in various contexts, integrating long-term ecological degradation with short-term biophysical drivers remains largely unexplored in semi-arid Mediterranean-type forest ecosystems. Addressing this gap is critical because chronic vegetation decline, such as the oak decline observed in the Zagros, represents a slow-acting predisposing factor that fundamentally alters fuel characteristics and fire vulnerability. This study therefore establishes a reproducible baseline for future research on fire effects in these chronically stressed environments. These contributions, however, should be considered in light of two principal limitations: (i) missing dynamic fire-weather forcings - hourly data fields for wind, humidity, and atmospheric stability were unavailable for the fire window; such variables are widely acknowledged as dominant “top-down” drivers of burn severity, and their exclusion is a recognized source of unexplained variance in remote sensing-based severity studies ([30], [52]); (ii) the proxy nature of fuel descriptors - satellite-derived indices and texture metrics capture fuel moisture and structure only indirectly. They cannot resolve fine-scale dead-fuel moisture content or live-fuel loading, both of which are identified in the literature as common blind spots that propagate uncertainty into model outputs ([47]).
These constraints define clear priorities for future research: (i) integrate high-resolution meteorology - future models should incorporate data from station networks or downscaled reanalysis products to explicitly represent event-scale fire-weather coupling; (ii) incorporate field-calibrated fuel data - collecting or accessing field-calibrated fuel measurements is essential to validate and refine the spectral and textural proxies used, thereby addressing a critical data gap highlighted in comparative severity assessments; (iii) conduct external validation - the framework’s generalizability must be tested across multiple fires in the Zagros region; this includes benchmarking its performance against standardized burn-severity products, whose classification thresholds and ecological relevance continue to face scientific scrutiny.
Strategic implications for fire management in the Zagros region
The modeling results provide a foundation for shifting Zagros fire management from a predominantly reactive posture to a proactive, data-driven strategy that anticipates, rather than merely responds to, severe fire events.
Proactive vulnerability mapping
The strong pre-fire signals associated with NDMI, LST, and the decadal NDVI trend suggest the potential to identify landscapes primed for high burn severity months in advance. However, as our current findings are derived from a single fire event, prospective validation across multiple independent fires is required to confirm this as an operational early-warning capability. Operationally, these variables can be composited in Google Earth Engine to generate dynamic “fire-vulnerability hotspot” maps at the start of each fire season. This allows agencies to strategically stage suppression resources and focus public-awareness campaigns where risk is greatest ([12], [45]).
Landscape-structure management
The significance of both spatial texture metrics and topographic variables indicates that fire severity is governed not only by terrain but also by the spatial arrangement and continuity of fuels. Management, therefore, should extend beyond simple fuel-type inventories to actively manipulate spatial patterns, for example, by constructing fuel breaks across high-continuity corridors and conserving highly fragmented patches as potential refugia.
Resilience-oriented stewardship
While the predominance of low-to-moderate severity in the studied event could suggest underlying ecosystem resilience, alternative factors like favorable weather conditions during the fire or effective local suppression efforts must also be considered. By running the model in reverse and identifying combinations of moisture status, vegetation trend, and texture associated with low dNBR, managers can prioritize maintaining landscape attributes that foster desirable, low-severity fire regimes. Such a shift aligns with emerging regional policy recommendations that call for resilience-focused planning rather than an exclusive reliance on full suppression.
Collectively, these implications argue for embedding the presented modeling framework within routine decision cycles, leveraging open-source platforms to deliver near-real-time risk products and guiding interventions that shape, not simply extinguish, future fire behavior.
Conclusions
This study aimed to develop a predictive model for burn severity within the complex, fire-prone ecosystems of the Zagros Mountains by integrating long-term ecosystem health trends, spatial texture metrics, and traditional biophysical variables. Our findings indicate that machine learning ensembles, particularly XGBoost, offer a robust predictive framework. The models revealed that pre-fire biophysical conditions (notably moisture and temperature) and fuel type (land cover) are strongly associated with fire effects. Furthermore, long-term vegetation decline (NDVI trend), topography, and landscape structural heterogeneity (texture) emerged as important secondary predictors of local burn severity. However, these findings must be interpreted in the context of several methodological limitations. Given the correlational design, the identified relationships represent plausible ecological associations rather than proven causal mechanisms. Additionally, the reported predictive performance likely reflects upper-bound estimates due to spatial autocorrelation, and accurate interpretation required the careful masking of spectral artifacts over non-burnable surfaces. Because this study is based on a single fire event, the current framework provides a foundational, data-driven understanding of regional vulnerability rather than an operationally ready management tool. Future research should prioritize prospective validation across multiple independent fires and integrate dynamic fire-weather data. Ultimately, this study advances the scientific understanding of spatial fire dynamics in the Zagros region, offering a vital first step toward developing proactive, spatially explicit landscape management strategies.
List of abbreviations
The following abbreviations have been used throughout the text:
- dNBR: differenced Normalized Burn Ratio
- GEE: Google Earth Engine
- GLCM: Gray-Level Co-occurrence Matrix
- HC3: Heteroscedasticity-Consistent Standard Errors (type 3)
- LST: Land Surface Temperature
- NDMI: Normalized Difference Moisture Index
- NDVI: Normalized Difference Vegetation Index
- NIR: Near-Infrared
- OLS: Ordinary Least Squares
- RF: Random Forest
- RMSECV: cross-validated Root Mean Square Error
- R2CV: cross-validated R-squared
- VIF: Variance Inflation Factor
- XGB: XGBoost
Acknowledgements
We thank the University of Tehran for providing access to research facilities. No external funding was received for this research.
References
CrossRef | Gscholar
Gscholar
CrossRef | Gscholar
CrossRef | Gscholar
CrossRef | Gscholar
CrossRef | Gscholar
CrossRef | Gscholar

Authors’ Info
Authors’ Affiliation
Department of Environmental Science, Faculty of Natural Resources, University of Tehran, Alborz, Karaj (Iran)
Amirreza Esfandyar 0009-0000-4262-4493
Department of Forestry and Forest Economics, Faculty of Natural Resources, University of Tehran, Alborz, Karaj (Iran)
Department of Arid and Mountainous Regions Reclamation, Faculty of Natural Resources, University of Tehran, Alborz, Karaj (Iran)
Corresponding author
Paper Info
Citation
Shahidinejad F, Jourgholami M, Pourhanifeh MM, Esfandyar A (2026). Multi-scale drivers of wildfire burn severity in Central Zagros: insights from remote sensing and machine learning. iForest 19: 359-368. - doi: 10.3832/ifor5027-019
Academic Editor
Davide Ascoli
Paper history
Received: Nov 02, 2025
Accepted: Jul 28, 2026
First online: Sep 08, 2026
Publication Date: Oct 31, 2026
Publication Time: 1.40 months
Copyright Information
© SISEF - The Italian Society of Silviculture and Forest Ecology 2026
Open Access
This article is distributed under the terms of the Creative Commons Attribution-Non Commercial 4.0 International (https://creativecommons.org/licenses/by-nc/4.0/), which permits unrestricted use, distribution, and reproduction in any medium, provided you give appropriate credit to the original author(s) and the source, provide a link to the Creative Commons license, and indicate if changes were made.

Web Metrics
Breakdown by View Type
Article Usage
Total Article Views: 1442
(from publication date up to now)
Breakdown by View Type
HTML Page Views: 409
Abstract Page Views: 490
PDF Downloads: 485
Citation/Reference Downloads: 0
XML Downloads: 58
Web Metrics
Days since publication: 46
Overall contacts: 1442
Avg. contacts per week: 219.43
Article Citations
Article citations are based on data periodically collected from the Clarivate Web of Science web site
(last update: Jul 2026)
(No citations were found up to date. Please come back later)
Publication Metrics
by Dimensions ©
Articles citing this article
List of the papers citing this article based on CrossRef Cited-by.
Related Contents
iForest Similar Articles
Research Articles
Near zero mortality in juvenile Pinus hartwegii Lindl. after a prescribed burn and comparison with mortality after a wildfire
vol. 12, pp. 397-402 (online: 31 July 2019)
Review Papers
Monitoring the effects of air pollution on forest condition in Europe: is crown defoliation an adequate indicator?
vol. 3, pp. 86-88 (online: 15 July 2010)
Research Articles
Fire influence on forest cover in the Caparaó microregion, state of Espírito Santo, Brazil
vol. 18, pp. 267-272 (online: 14 October 2025)
Technical Reports
Air pollution regulations in Turkey and harmonization with the EU legislation
vol. 4, pp. 181-185 (online: 11 August 2011)
Research Articles
Diversity, distribution and vegetation assessment in the Jahlmanal watershed in cold desert of the Lahaul valley, north-western Himalaya, India
vol. 3, pp. 65-71 (online: 17 May 2010)
Research Articles
Remote sensing of Japanese beech forest decline using an improved Temperature Vegetation Dryness Index (iTVDI)
vol. 4, pp. 195-199 (online: 03 November 2011)
Research Articles
Dust collection potential and air pollution tolerance indices in some young plant species in arid regions of Iran
vol. 12, pp. 558-564 (online: 17 December 2019)
Research Articles
Bioaccumulation of long-term atmospheric heavy metal pollution within the Carpathian arch: monumental trees and their leaves memoir
vol. 17, pp. 370-377 (online: 27 November 2024)
Research Articles
Evaluation of hydrological and erosive effects at the basin scale in relation to the severity of forest fires
vol. 12, pp. 427-434 (online: 01 September 2019)
Research Articles
Moderate wildfire severity favors seed removal by granivores in a Mexican pine forest
vol. 18, pp. 121-127 (online: 24 May 2025)
iForest Database Search
Search By Author
Search By Keyword
Google Scholar Search
Citing Articles
Search By Author
Search By Keywords
PubMed Search
Search By Author
Search By Keyword