
Dust collection potential and air pollution tolerance indices in some young plant species in arid regions of Iran
iForest - Biogeosciences and Forestry, Volume 12, Issue 6, Pages 558-564 (2019)
doi: https://doi.org/10.3832/ifor3063-012
Published: Dec 17, 2019 - Copyright © 2019 SISEF
Research Articles
Abstract
Dust is one of the main environmental challenges in most arid zone cities of Iran. Tree plantation and forest belts can provide a cost-effective and eco-friendly solution to mitigate dust pollution. Air pollution tolerance index (APTI) based on a combination of total chlorophyll (TChl), relative water content (RWC), ascorbic acid (AsA), and leaf pH is considered as one of the most important means for determining sensitive and tolerant plant species for greening. The present study aimed to evaluate the dust capturing efficiency and APTI of Fraxinus rotundifolia Mill., Morus alba L., Celtis caucasica Willd., and Melia azedarach L., four tree species commonly used in urban green areas of most cities in Iran. As a completely randomized design, 256 saplings were grown in four plastic sheets (64 saplings of four species in each chamber) and the dust was applied at concentrations of 0, 300, 750, and 1500 μg m-3 once a week for 70 days. The results revealed that dust accumulation was greatest in the 750 and 1500 μg m-3 treatment in the following order: M. alba > C. caucasica > F. rotundifolia > M. azedarach. In all species, pH, RWC, AsA, and TChl diminished with increasing dust concentration. A decline in APTI of 0 to 1500 μg m-3 was observed in all species. At 750 μg m-3, only M. alba was tolerant to dust and the other species were intermediate. At 1500 μg m-3, M. alba and M. azedarach showed to be intermediate while two other species were sensitive. The greatest relationship was found between APTI and RWC (R2= 0.85), followed by APTI and AsA (R2 = 0.82). Although C. caucasica showed a high capacity for dust accumulation at 1500 μg m-3, it was found to be sensitive and can, therefore, be used as a dust pollution bioindicator. F. rotundifolia and C. caucasica are not suitable for plantation in urban green spaces where dust concentration is 1500 μg m-3. M. alba appeared to be a tolerant species adaptable to arid urban environments with a potential for reducing dust levels by sinking its particles.
Keywords
APTI, Ascorbic Acid, Dust Pollution, Persian Lilac, White Mulberry
Introduction
Considered as a common air pollutant, dust is defined as a collection of fine solid particles of natural or anthropogenic origins which is usually formed by disintegration processes ([5]). Dust pollution is harmful for human health and environment, causing major problems and incurring staggering costs in various socio-economic sectors ([35], [11]). A set of atmospheric, geomorphic, and ecological processes and human activities are involved in the mechanism of production, transfer, and deposition of dust particles ([34]). An estimated amount of 2 × 10¹² tons of dust is emitted into the atmosphere annually ([37]), where dust particles originating from wind (aeolian) erosion claim about 40% of aerosols in the troposphere ([40]). The major sources of soil dust include arid and semi-arid regions, particularly subtropical latitudes where the great deserts are located, including Africa, Middle East, Southwest Asia, the central Australia, Mongolia, and parts of Europe and the Americas ([10]).
Plants are the primary recipients of deposited dust and endure it more than other living organisms, because of their immobility and continuous exposure to dust ([9]). Dust particles directly affect plants via deposition on aerial parts or indirectly through altering the chemical characteristics of soil ([22]). Dust deposition on plants usually affects the quantity and quality of the light that reaches plant surfaces and elevates leaf temperature ([14]). Furthermore, accumulation of dust particles on leaves may lead to stomata blocking which interferes with gas exchange ([39]). All of the above changes can adversely affect leaf physiological and biochemical traits and negatively impact the plant growth and productivity ([22]). The intensity of the dust pollution on plants depends on its chemical and physical properties, duration and frequency of occurrence of dust events as well as leaf morphology and species tolerance to such stress. Also, climatic characteristics such as temperature, relative humidity, wind speed, and precipitation events influence the intensity of dust stress on plants ([38]).
To mitigate the impact of dust pollution in the air, environmentalists emphasize benefiting from perennial green belts in and around urban areas ([31]). Urban vegetation improves air quality by absorbing and accumulating dust pollutants on leaves ([18]). The dust accumulation potential on plants’ leaves depends on leaf structure, leaf geometry, leaf epidermal and cuticular features, leaf phyllotaxy, as well as height and canopy of trees ([28]). The key to maximizing the benefits of urban green zones is the proper selection of tree species for a proposed dust reduction and dust tolerance. Leaves constitute the most sensitive plant organ which are highly exposed to dust stress ([38]), making them as bioindicators for air quality in several studies ([1], [21], [6]). When exposed to dust, the leaves experience physiological changes before exhibiting visible damage symptoms ([15]). On the other hand, tolerance to dust pollution can be conferred through physiological and biochemical adjustments of the leaf, such as pH, relative water content (RWC), total chlorophyll (TChl), and ascorbic acid (AsA or Vitamin C - [29]). Therefore, these four parameters are utilized to calculate “air pollution tolerance index- APTI” in plants ([1]). Sensitive species can act as biological indicators or biomonitors for air quality where tolerant species as sink can be used to combat dust pollutant in green belt development plans ([21]). Although most studies on APTI are related to industrial activities and vehicles ([29], [1], [18], [6]), there are very few reports on APTI with natural dust ([8], [30], [23]).
Recent climatic changes in Iran and subsequent droughts combined with indiscriminate use of water resources have led to intensification and frequency of dust storms represented by formation of new dust centers and increased intensity, durability, and transition distance from the source region. For these reasons, more than half of the Iranian provinces are suffering from critical aerosol dust pollution ([3], [33]), among which some places are ranked as first to third in the world in terms of dust pollution ([44]). For instance, the daily maximum dust concentration reaches up to 5337 μg m-3 in Ahvaz ([36]) and 3094 μg m-3 in Zabol ([32]). The maximum number of dusty days in Zabool and Dezful is about 166 and 188 days per year, respectively. Also, the data provided by the Iranian Meteorological Organization (IMO) revealed that during the period 2001-2005, the average number of dusty days for Dezful, Kermanshah, and Abadan cities were 87.8, 73, and 58.2 days, respectively. Based on the United Nations Environment (UNE), the per capita urban green space (UGS) in Iran (7-12 m2) is far lower than either the standard index (20-25 m2) or the ideal global index (50 m2) by World Health Organization ([43]), highlighting the importance of additional green space in urban and suburban areas.
Fraxinus rotundifolia Mill., Morus alba L., Celtis caucasica Willd. and Melia azedarach L. are commonly used in urban green spaces of central Iran, as well as in arid and semi-arid regions, particularly where the dust pollution is high. Accordingly, this investigation aimed to assess the collection potential and estimation of APTI of the mentioned tree species under dusty air pollution and to introduce the most suitable species for planting in urban green space of dusty regions.
Materials and methods
The experiment was conducted at a research greenhouse at the Faculty of Agriculture, Tarbiat Modares University, Tehran, Iran (35° 44′ N, 51° 10′ E; elevation: 1215 m a.s.l.). The climate of the area is arid and semi-arid, with average annual relative humidity of 34% and average annual rainfall of 161 mm.
Plant materials
The four target species (F. rotundifolia, M. alba, C. caucasica and M. azedarach) were initially grown for two years in polypropylene pots containing soil mixture (sand, clay, animal manure and cocopeat in 2:1:1:1 proportion) in a nursery (35° 44′ N, 51° 10′ E; 1312 m a.s.l.). Sixty-four uniform saplings (in terms of collar diameter and height) from each species were selected and transferred to the greenhouse. Twenty days later, the saplings were transplanted to a 5L plastic pot containing the same soil used at nursery and irrigated daily at constant parameters (temperature 26 ± 2 °C; 14 hours photoperiod; relative humidity 54 ± 5% and photosynthetically active radiation-PAR 1000 μmol m- 2 s- 1).
Preparation of soil dust
Soil samples for dust preparation were collected at depths of 0-10 cm from the largest source of dust generation in the southern province of Khuzestan, Iran ([12]). The blended soil was passed through a 106 μm sieve and oven dried at 80 °C for 48 hours. A detailed soil analysis is provided in Tab. 1.
Tab. 1 - Some of the physical and chemical properties of soil dust samples (0-10 cm depth).
| Soil Dust Property | Value |
|---|---|
| Texture | Clay-loam |
| Sand (%) | 44 |
| Clay (%) | 48.66 |
| Silt (%) | 7.33 |
| EC (ds m-1) | 7.29 |
| pH | 6.65 |
| N (%) | 0.04 |
| P (ppm) | 13 |
| K (ppm) | 292 |
| O.M (%) | 0.68 |
| SiO2 (%) | 30.42 |
| Al2O3 (%) | 6.2 |
| TiO2 (%) | 0.41 |
| Fe2O3 (%) | 4.21 |
| Na2O (%) | 2.25 |
| CaO (%) | 24.15 |
| MnO (%) | 5.11 |
| K2O (%) | 0.35 |
| P2O2 (%) | 0.12 |
| V2O2 (%) | 0.01 |
| NiO (%) | 0.01 |
| Cr2O3 (%) | 0.03 |
| MgO (%) | 15.01 |
| CuO (%) | 0.01 |
| ZrO2 (%) | 0.02 |
| P2O5 (%) | 0.12 |
| CdO (%) | 0.0002 |
| Sb2O3 (%) | 0.00001 |
Application of dust
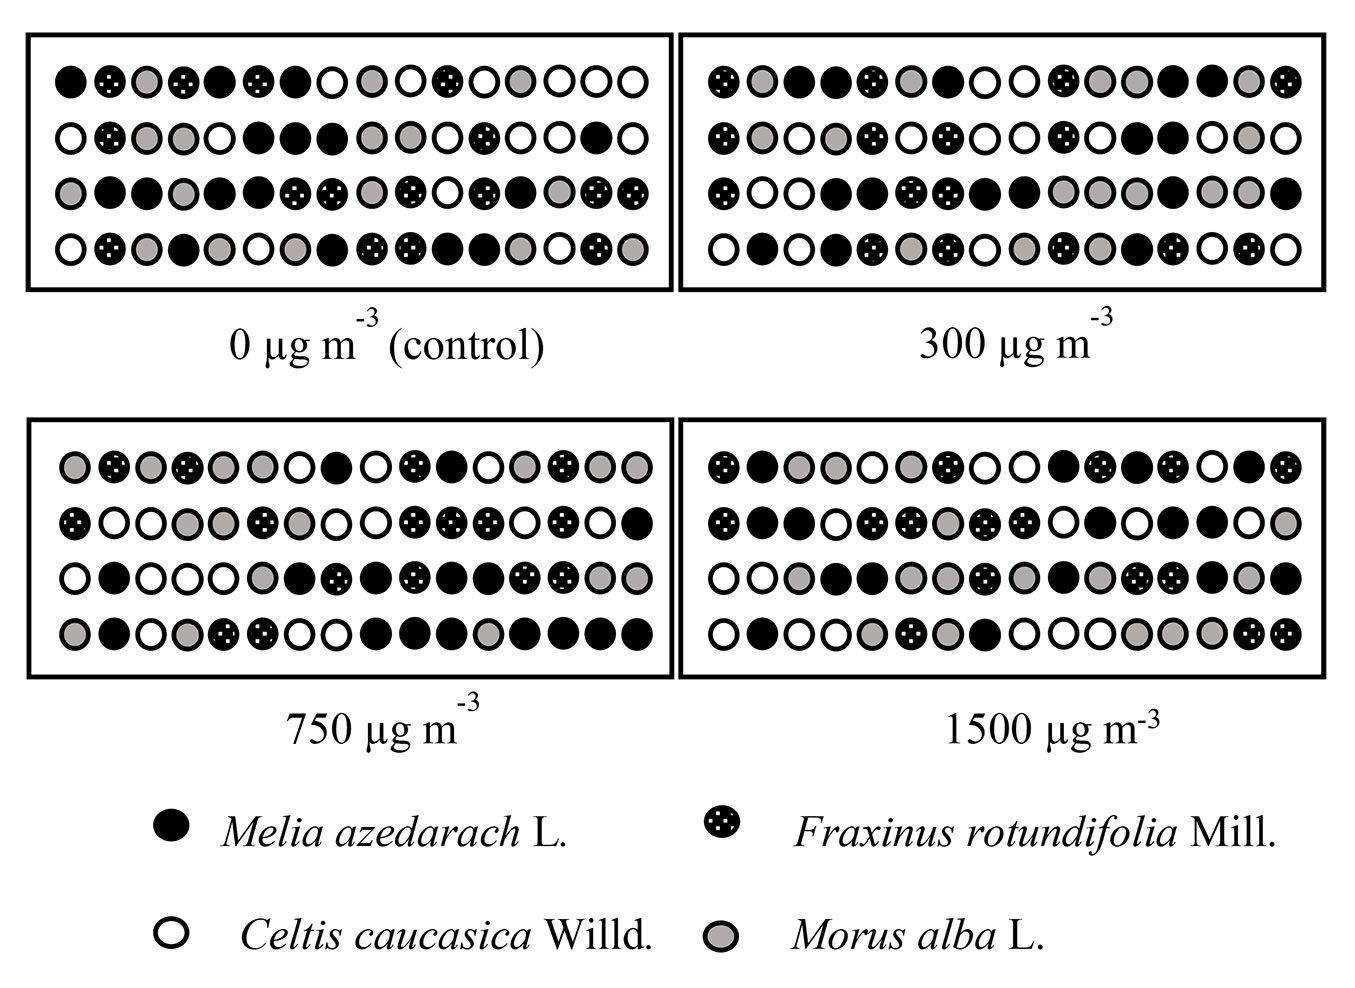
The selected dust concentrations (300, 750 and 1500 µg m-3) were based on the typical concentrations recorded in suspended particles (TSP) in Khuzestan Province ([36], [11]), taking 0 µg m-3 as control. Four plastic covered chambers (5 × 2 × 3 m) for the four dust concentrations were made based on an earlier work ([38]) with some modification. Each chamber contained 64 saplings (Fig. 1). Dust was applied on plants over 10 weeks with one-week intervals (from 09:00 to 12:00) using a dust simulator. Each treatment was carried in four replicates (with four saplings per replicate). The saplings were irrigated as needed. Calibration of dust chambers for the concentration and method of particle size distribution in the air was conducted by the dust monitor (model 176000A Microdust Pro Dust Monitoring®, Casella, Buffalo, NY, USA).
Fig. 1 - Experimental design map (a randomized complete design with four replicates of four saplings per species at each dust concentration).
Dust collection potential
At the end of the experiment, five fully expanded leaves from selected saplings per treatment (from each dust level-each tree species) were severed, placed individually in plastic bags and transferred to the laboratory. The leaf samples were weighed using an electric digital balance. Individual leaves were then cleaned using a fine brush to remove dust and then reweighed. The area of each leaf was measured using a Leaf Area Meter (Model LI-3000®, Li-Cor, Lincoln, NE, USA). The amount of dust accumulation was calculated following Prusty et al. ([28]) as (eqn. 1):
where W is the dust accumulation amount (mg cm-2), W1 is the weight of leaf without dust (mg), W2 is the weight of leaf with dust (mg), and a is the total area of leaf in cm2.
Leaf extract pH
The leaf extract pH was determined by the protocol of Rai & Panda ([29]). For each treatment, four samples of 0.5 g of the fresh leaves were crushed and homogenized in 50 ml deionized water, after which the mixture was centrifuged at 7000×g for 10 minutes. The pH of the supernatant was measured using a digital pH meter (model μ pH system 361, Systronics AG, Baden-Dättwil, Switzerland).
Relative water content (RWC)
The RWC of leaf was determined according to Karami et al. ([17]). Four samples of fully matured leaves for each treatment were collected and immediately taken to the laboratory. These leaves were washed completely, and the excess was removed by a filter paper. The fresh leaves were weighed to obtain the fresh weight (FW), and then placed in a water-filled Petri plate overnight (24 hours). The samples were weighed again to achieve the turgid weight (TW). Then, the turgid leaves were oven dried at 70 °C for 48 hours, and the dry weight (DW) was recorded. The RWC was calculated as follows (eqn. 2):
Total chlorophyll (TChl)
For measuring TChl content, sapling leaves from each treatment were collected at the end of the experiment and their surface was cleared off dust particles by a soft brush ([38]). About 0.1 g of fresh leaves (four samples for each treatment) was extracted in 10 ml of chilled 80% acetone. The liquid portion was decanted into another test tube and centrifuged at 4 °C in the dark at 6000×g for 15 minutes. The supernatant was collected with the absorbance being captured at 645 and 663 nm using a spectrophotometer (FCC Compliance, Epoch, Biotek Instrument, USA). The contents of chlorophyll a (Chl a), chlorophyll b (Chl b), and total chlorophyll (TChl - mg g-1 FW) were determined as follows ([4] - eqn. 3 to eqn. 5):
Ascorbic acid (AsA)
The spectrophotometric method was used to determine the AsA of the leaves ([19]). About 1 g of fresh leaf (four samples for each treatment) was homogenized with 20 ml oxalic acid-EDTA solution (5 g oxalic acid + 0.75 g EDTA in 1 ml of distilled water), and then centrifuged at 6000×g for 15 minutes at room temperature where the liquid supernatant was separated. The supernatant (1 ml) was mixed with 5 ml of 2,6-dichlorophenol indophenol (DCPIP). The optical density (OD) of the solution (Es) was read at 520 nm. One drop of AsA solution was added in order to bleach the supernatant sample where optical density was measured at the same wavelength (Et). The optical density of DCPIP solution was also taken at 520 nm (Eo). The standard curve was prepared using 1% aqueous solution of AsA. The concentration of AsA (mg g-1) was calculated by the following equation (eqn. 6):
where W is the weight of the fresh leaf taken, V1 is the volume of the supernatant taken, V is the total volume of the mixture. The value of [Eo-(Es-Et)] is estimated by the standard curve.
Air pollution tolerance index (APTI)
APTI was calculated by measuring the leaf extract pH, RWC, TChl and AsA content. APTI is formulated as follows ([26] - eqn. 7):
where AsA is expressed in mg g-1, TChl in mg g-1, P is the pH of leaf extract and RWC is expressed as percentage.
Based on the computed APTI values, the plant species were classified as sensitive (≤11), intermediate (12 to 16), and tolerant (≥17), according to Ogunkunle et al. ([26]).
Statistical analysis
The effects of dust concentration and tree species were analyzed using a GLM procedure. The means were declared significantly different using the Duncan’s multiple range test. All statistical analyses were performed using SPSS® version 23.0 (SPSS Inc., Chicago, IL, USA). Linear regression (R2) analysis was carried out to assess changes in APTI (dependent variable) governed by leaf pH, RWC, TChl, and AsA (independent variables) of plant species, using Microsoft Excel 2013®.
Results
The two-way analysis of variance revealed that dust concentration significantly affected the extract pH in all tested tree species, while the effect of dust concentration and tree species was significant on RWC and TChl. There was a significant interaction between dust concentration and tree species on dust potential collection as well as AsA content (Tab. 2).
Tab. 2 - The effect of dust application on dust collection potential and many physiological and biochemical traits of four trees species. (*): p < 0.05; (**): p < 0.01
| Parameter measured | Factors (F-values) | ||
|---|---|---|---|
| Dust concentration (D) |
Tree species (T) |
D × T | |
| Dust collection potential | 59.879** | 12.624** | 2.964* |
| Leaf extract pH | 5.220** | 0.722 | 0.067 |
| Ascorbic acid content | 150.265** | 45.042** | 10.696** |
| Relative water content | 76.988** | 4.747** | 1.218 |
| Total chlorophyll content | 27.289** | 3.652* | 0.297 |
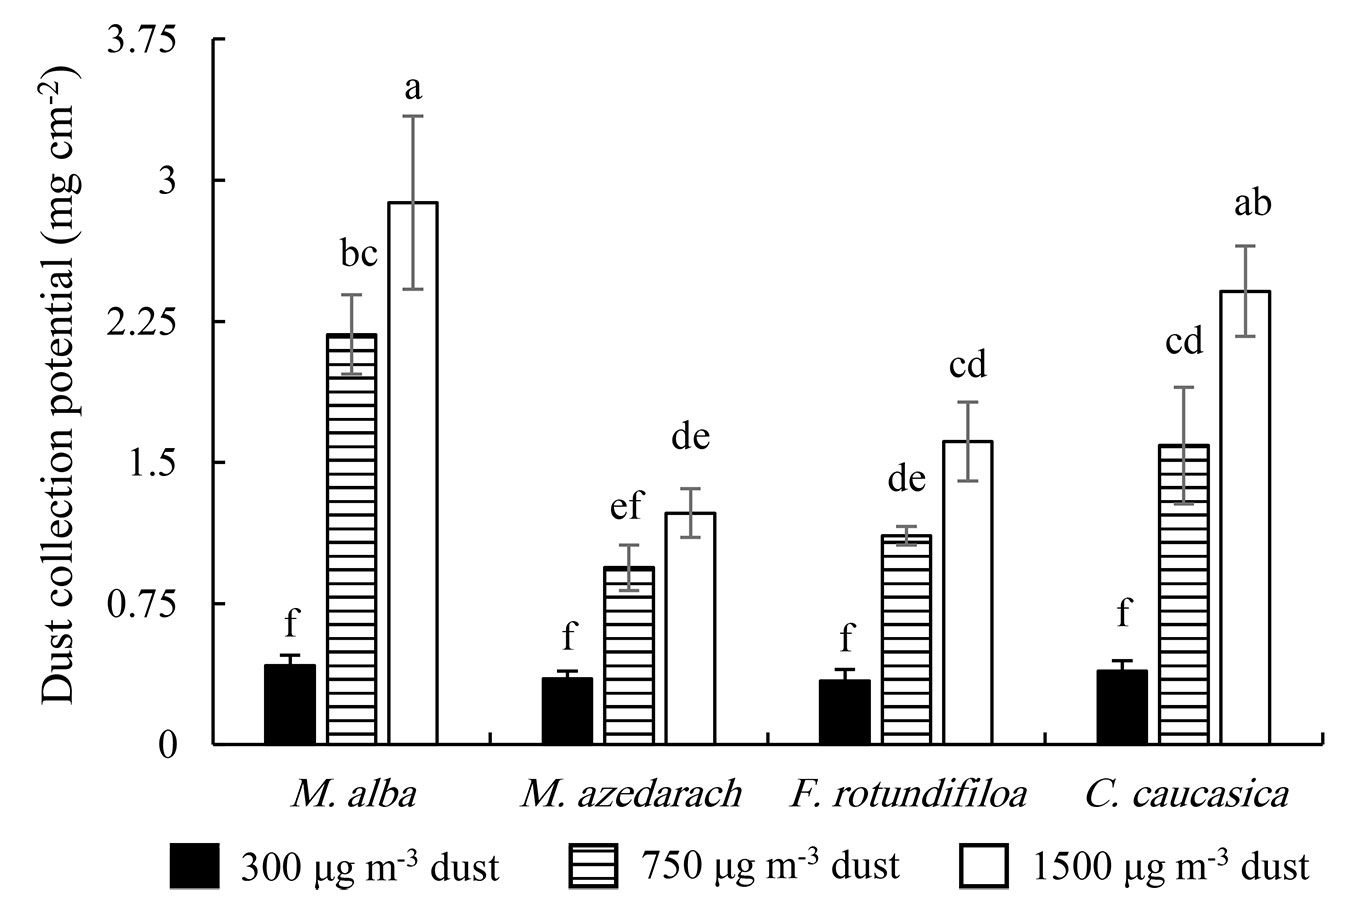
Increased dust concentration enhanced foliar dust accumulation capacity in all species. High dust collection potential at 750 and 1500 μg m-3 in the tested plants was noted in the sequence of M. alba > C. caucasica > F. rotundifolia > M. azedarach. At 1500 μg m-3, the maximum dust load was noticed on leaves of M. alba (2.88 mg cm-2), followed by C. caucasica (2.41 mg cm-2), F. rotundifolia (1.61 mg cm-2) and M. azedarach (1.23 mg cm-2); similar trends were observed at 750 μg m-3, where dust load was 2.18, 1.59, 1.11, and 0.94 mg cm-2 for the same species, respectively (Fig. 2).
Fig. 2 - Dust collection potential during the 70 days dust exposure treatment for four common Iranian urban trees species. Different letters indicate significant differences among 12 treatment combinations (interaction of dust level × tree species) after Duncan’s test (p<0.05). Values are mean ± SE. n=4 saplings from each treatment (dust level-tree species).
The pH of leaf extract of all species diminished when subjected to increased dust concentrations (Fig. 3), which ranged within 7.57-6.35 in M. alba, 7.29-6.28 in M. azedarach, 7.69-6.46 in F. rotundifolia, and 7.4-6.0 in C. caucasica. Rising soil dusting was associated with reduction in AsA of all species; from 0 to 1500 μg m-3, the AsA of M. alba, M. azedarach, F. rotundifolia, and C. caucasica dropped by 21%, 16%, 36%, and 42%, respectively (Fig. 3).
Fig. 3 - Leaf pH, Ascorbic acid (AsA), relative water content (RWC) and total chlorophyll (TChl) during the 70 days dust exposure treatment for four common Iranian urban trees species. Different letters indicate significant difference among four dust levels (in leaf pH), and interaction of dust level × tree species (in AsA). In RWC and TChl, lowercase letters indicate significant differences among four dust levels in each plant species, and capital letters indicate significant differences among four plants species after Duncan’s test (p<0.05). Values are the mean ± SE. n=4 saplings from each treatment (dust level-tree species).
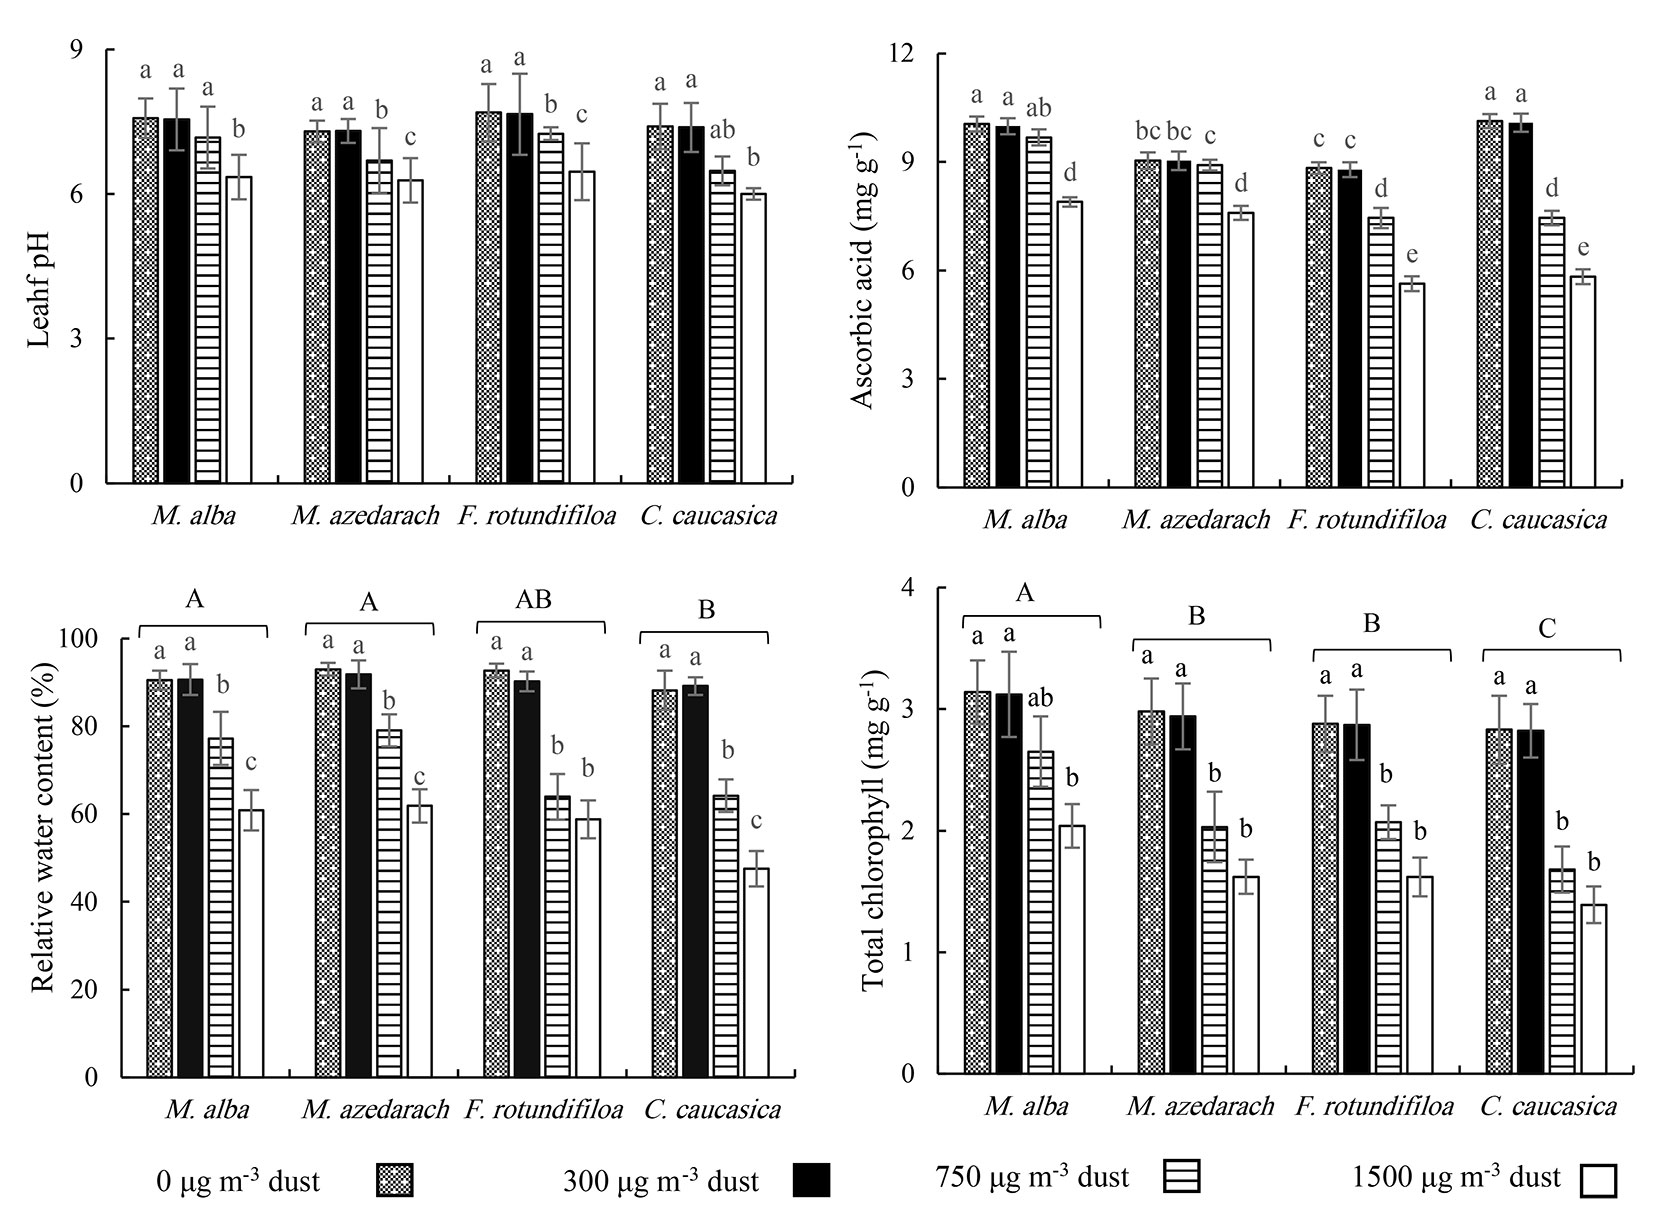
Increase in dust concentration induced a significant decrease in the RWC and TChl concentrations in all plant species (Fig. 3). For instance, at 1500 μg m-3, the relative water content (RWC) in leaves was reduced by 33%, 33%, 37%, and 46% for M. alba, C. caucasica, F. rotundifolia and M. azedarach, respectively, while TChl declined by 35%, 46%, 44%, and 51% for the same species, respectively. Irrespective of dust concentrations, the highest RWC was found in M. alba and M. azedarach. Further, the maximum TChl value was observed in M. alba, while the lowest RWC and TChl values were found in C. caucasica (Fig. 3).
The APTI value diminished with increase in dust levels in all plant species (Fig. 4), which varied from 19.8 to 9.05. In 0 μg m-3, the APTI value was found as the following order: M. alba > C. caucasica > M. azedarach and F. rotundifolia; at 300 μg m-3, the trend of APTI score was M. alba > C. caucasica > M. azedarach and F. rotundifolia; at 750 μg m-3, the order was: M. alba (17.25) > M. azedarach (15.69) > F. rotundifolia (13.34) > C. caucasica (12.48); at 1500 μg m-3, the ATPI scores were 12.70, 12.19, 10.45, and 9.05 in M. alba, M. azedarach, F. rotundifolia and C. caucasica, respectively (Fig. 4).
Fig. 4 - APTI score and plant species response under different dust concentrations during the 70 days dust exposure treatment for four common Iranian urban trees species. (T): Tolerant, (I): Intermediate, (S): Sensitive.
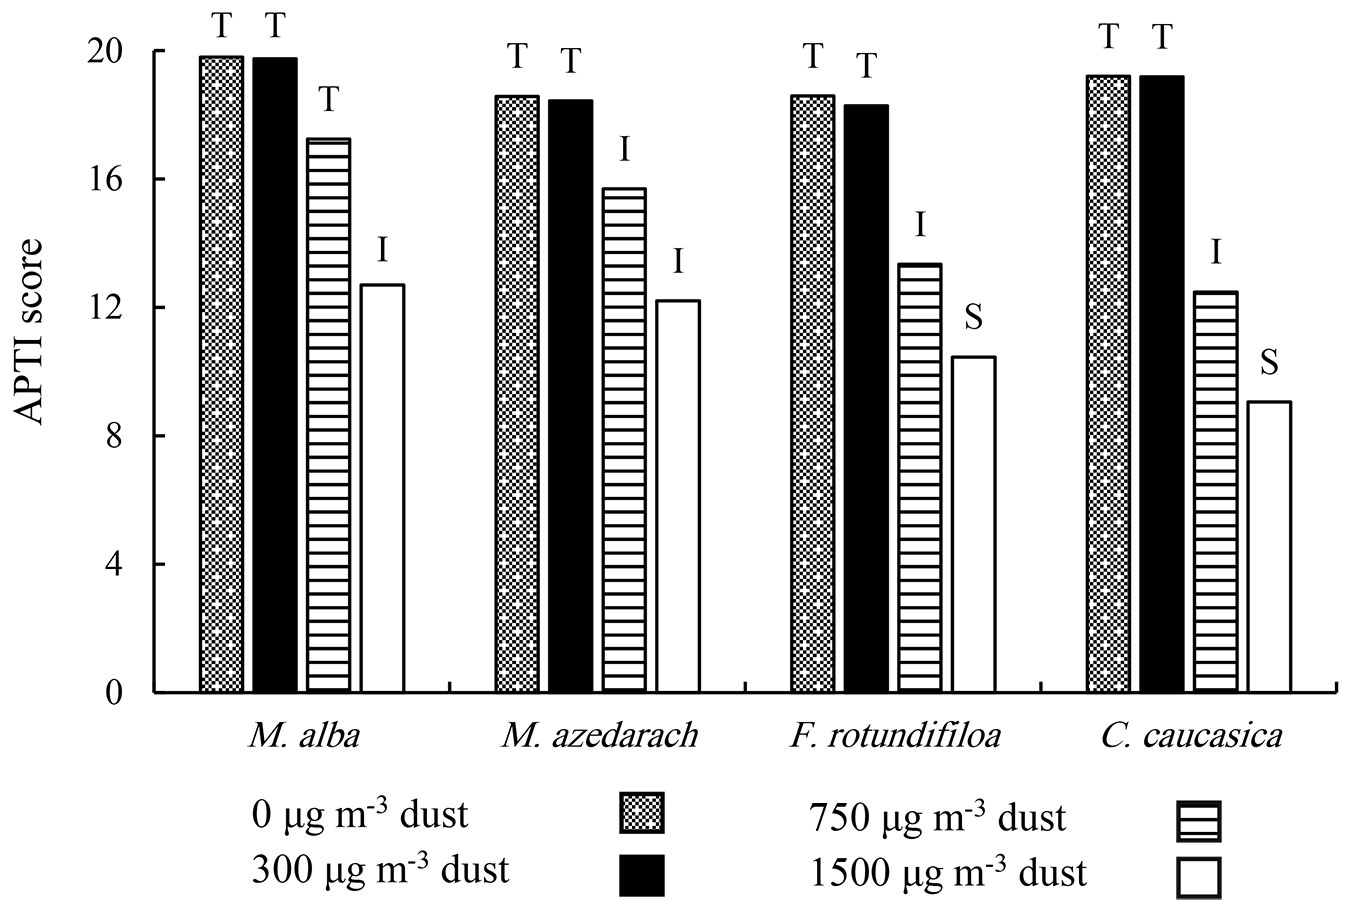
All plant species were found to be tolerant at 0 and 300 μg m-3. On the other hand, at 750 μg m-3, M. alba was tolerant, while the other three species were intermediate. At 1500 μg m-3, M. alba and M. azedarach responded like intermediate-tolerant species, but C. caucasica and F. rotundifolia were found to be sensitive (Fig. 4).
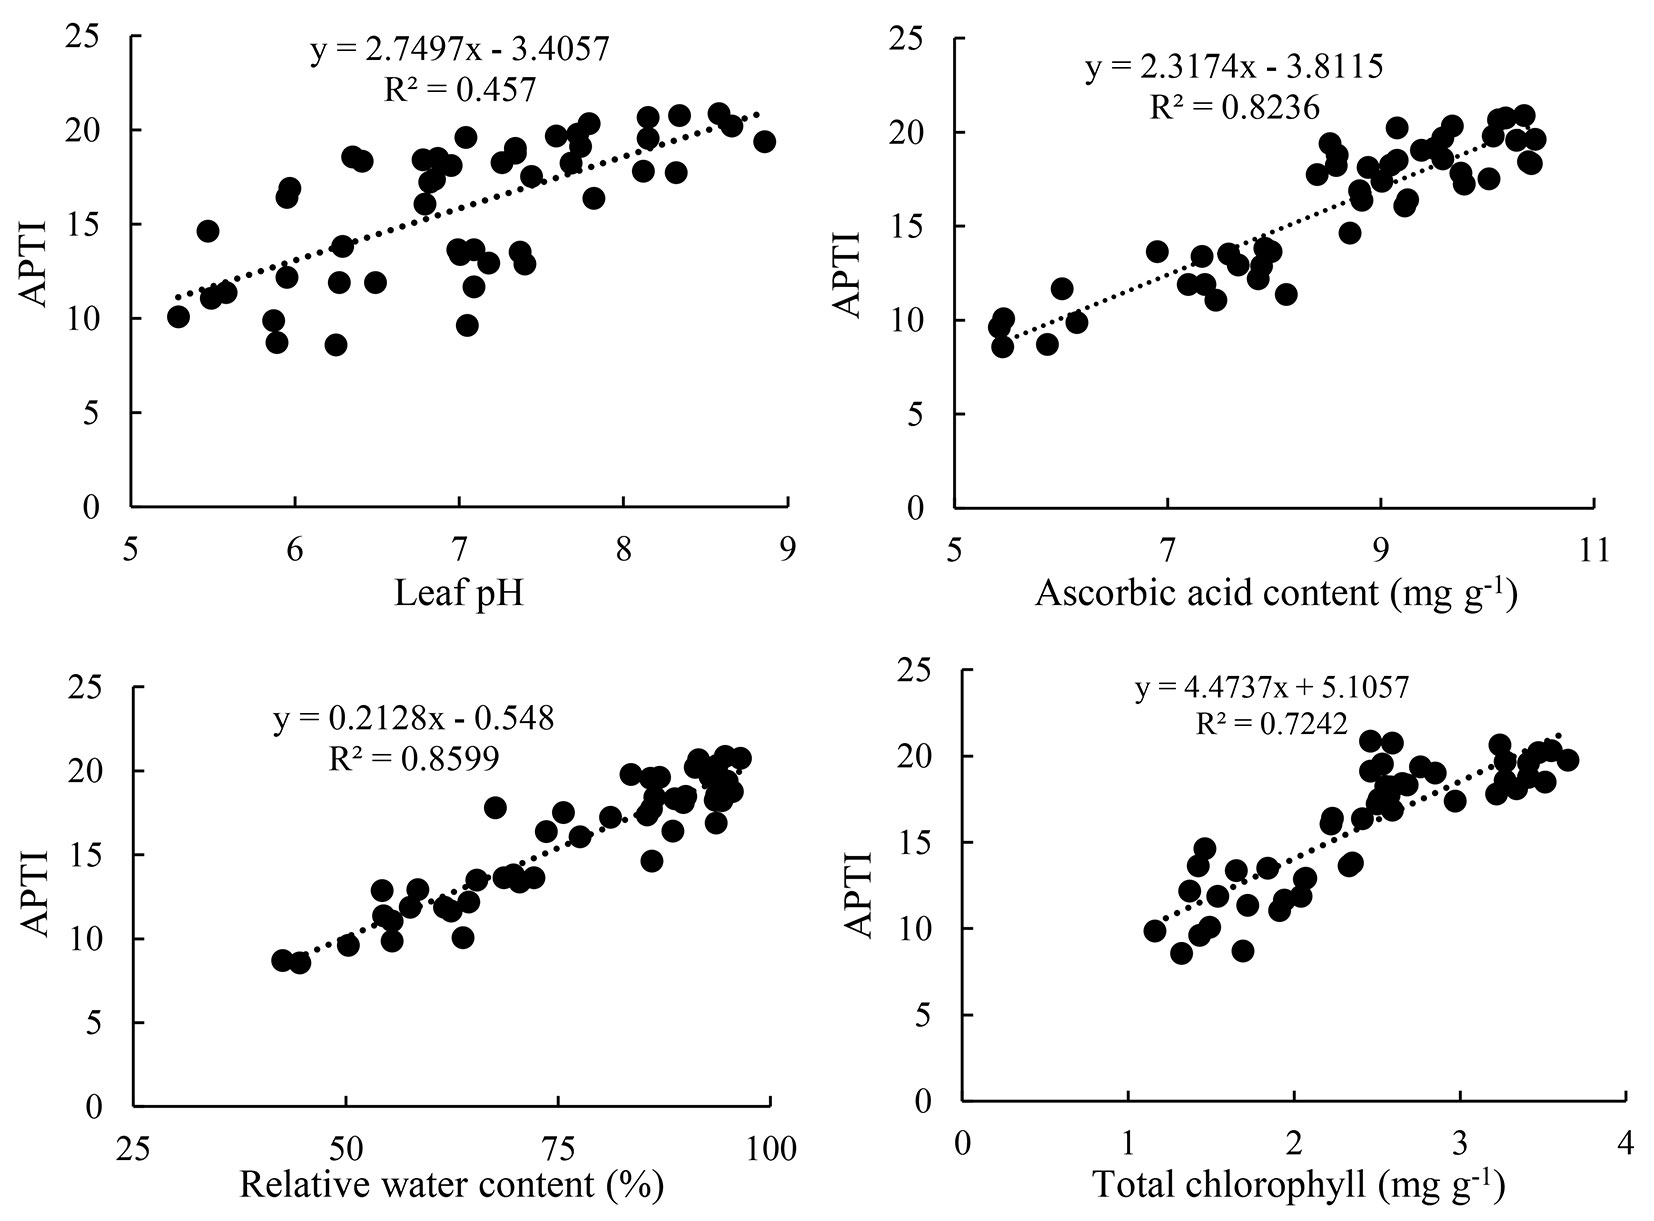
A high positive correlation was found between APTI and RWC (R2 = 0.85), and between APTI and AsA (R2 = 0.82). On the other hand, a low and moderate positive correlation was found between APTI and pH (R2= 0.45) and between APTI and TChl (R2 = 0.72), (Fig. 5).
Fig. 5 - Linear regression analysis of individual variables (physiological and biochemical variables) with APTI.
Discussion
In the present study, increase in dust concentration promoted dust accumulation potential in all species. At 750 and 1500 μg m-3, the trend of dust accumulation among the species was M. alba > C. caucasica > F. rotundifolia > M. azedarach. The high dust accumulation in M. alba can be explained by the ovate shape of the leaves with depressions in the middle, uneven surface, and high area of leaves. However, in C. caucasica, this may be due to the relatively high, rough and uneven surface of the leaves and presence of tiny hairs on the abaxial surface. Principally, greatest dust deposition is found in species with leaves of thick, rough and hairy surfaces; consequently, such species are suitable for the accumulation of dust ([28]). In our findings, low dust removal capacity in F. rotundifolia was probably because of smooth surface and low area of leaves. The low dust-retention amount of M. azedarach might be due to small area, thin lamina, as well as flat and smooth surface of leave. Indeed, these two species display a low dust accumulation potential since dust is shed by air movement.
In the current study, increase in dust stress led to a significant reduction in pH of leaves across all tested plant species, which was in line with the results in Pistacia vera L. ([30]). The leaf pH is an index of detoxification mechanism in plants for improving tolerance capacity against air pollution ([24]). The penetration of chemical dust particles with an acidic nature into the cell sap and their conversion to acidic radicals cause reduction of leaf extract pH, where the decline is greater in sensitive plants than in tolerant plants ([7]). Low leaf pH reduces the efficiency of the conversion from hexose to ascorbic acid ([42]). In the current study, it seems that more probable penetration of acidic dust particles (pH 6.65) into the leaf tissues along with growing dust accumulation on the leaf surface caused diminished pH of leaf extracts.
The elevated dust concentration resulted in reduced AsA content, which was in correspondence with another study employing the marble crushing-caused dust deposition on the leaf surface of some tree species ([25]). AsA concentration is directly proportional to the pH value of the leaf. Likewise, acidic pH of dust deposited on leaf surface alters cell sap pH towards acidic and declines the efficiency of the conversion of hexose sugar to AsA formation ([42]). The descending trend in AsA content as well as leaf extract pH with increase in dust concentration may be attributed to the positive relationship between these two parameters. Another reason for reduction of AsA under dust stress may be its consumption for scavenging reactive oxygen species (ROSs) produced in chain reactions following the penetration of pollutant particles into foliar tissues ([25]).
Increase in dust concentration resulted in a descending trend of RWC across the examined species, which is in line with earlier studies in sweet potato ([45]), peach ([22]), grapevine ([17]), and pistachio ([30]). RWC is a useful indicator of plant’s water status whose high value is considered as a resistance index against stresses ([41], [8]). In our findings, the maximum RWC was detected in M. alba and M. azedarach, while the lowest was found in C. caucasica. Under dust stress, low RWC may be due to the effect of dust pollutant on leaf transpiration, since the crust formed by dust deposition on the leaf can lead to the blockage of the stomata and reduced transpiration ([46], [16]). Also, the reaction of dust particles with the cell membrane results in foliar injury and higher membrane permeability in dusted leaves which may be another reason for the low RWC value ([27]).
Increase in dust concentration was associated with a marked reduction of TChl across all tested species; the highest and the lowest values were recorded in M. alba and C. caucasica, respectively. Similar trend of reduced TChl in response to dust pollution has also been reported on Haloxylon aphyllum Bunge ([13]), Vigna radiata L. ([2]), P. persica ([22]) and on P. vera ([30]). Dust deposition on the leaf surface may reduce the synthesis of chlorophyll due to shading effects. Another reason may be related to pigment degradation and the inhibition of enzymes essential for biosynthesis of pigments due to the incorporation of dust particles into the leaf tissue ([20]).
Increase in the dust level was associated with a decline in the APTI value. At high dust concentrations (750 and 1500 μg m-3), the APTI value was found to be in the order of: M. alba > M. azedarach > F. rotundifolia > C. caucasica. It can be stated that plant species respond differently to different dust concentrations. Higher accumulation of dust particles changes the physiological and biochemical variables of the leaf which can be measured by the APTI ([1]). Hence, different APTI values represent the ability of a plant to combat against air dust pollution ([29]).
Plant species are classified in terms of their tolerance level to the air pollution as ([26]): sensitive (≤11 APTI), intermediate (12-16 APTI), and tolerant (≥17 APTI). In the present study, at 750 μg m-3 of dust, only M. alba fell under tolerant category; at 1500 μg m-3, M. alba and M. azedarach were classified as intermediate, while the other two species were sensitive. Species with higher APTI values show greater tolerance to air pollution and can act as a dust sink ([21]). It can, therefore, be stated that M. alba is a potential species to be planted in polluted sites and for reducing air dust pollution, while C. caucasica and F. rotundifolia are suitable for biomonitoring of air dust pollution. In our study, the highest correlation existed between APTI and RWC (R2= 0.85), followed by between APTI and AsA (R2 = 0.82), indicating that RWC and AsA of the leaf are important variables in the estimation of APTI.
Conclusion
The trend of dust accumulation capacity among the four tested tree species at 750 and 1500 μg m-3 of dust levels was Morus alba > Celtis caucasica > Fraxinus rotundifolia > Melia azedarach. Growing concentrations of soil dust caused a significant reduction in the leaf extract pH, RWC, AsA, and TChl for all species examined. A decline in APTI score of 0 to 1500 μg m-3 was observed in all species. Among the four species, M. alba was only tolerant to 750 μg m-3 of dust. At 1500 μg m-3, M. alba and M. azedarach were classified as intermediate, while the other two species were sensitive. RWC and AsA were the most crucial factors promoting tolerance to dust stress in the plants. Despite the high capacity of dust accumulation at 1500 μg m-3, C. caucasica was sensitive and could be used only as a bioindicator for dusty air. M. azedarach showed to be an intermediate species and was more resistant than F. rotundifolia and C. caucasica; therefore, the two latter species cannot be introduced for urban plantation in arid regions with dusty air of 1500 μg m-3. Overall, due to the maximum potential for dust accumulation and the higher tolerance than the other three species (at 750 and 1500 μg m-3), M. alba can be suitable for plantation in arid urban environments and serves as a sink for dust particles.
List of abbreviations
(APTI): Air Pollution Tolerance Index; (RWC): Relative Water Content; (TChl): Total Chlorophyll; (AsA): Ascorbic Acid; (IMO): Iranian Meteorological Organization; (UNE): United Nations Environment; (UGS): Urban Green Space; (WHO): World Health Organization; (ROS): Reactive Oxygen Species.
Authors’ contributions statement
The study was conducted by contributions from all authors. ZJ and MTK shaped the structure of the scientific design. ZJ, HAB and SAMMS performed greenhouse and laboratory works. ZJ and MTK carried out data analysis. The text was written by ZJ and MTK. It also was improved from view point of technical and English language by DS.
Acknowledgments
We wish to thank Dr. Saham Mirzaei Tork and Mr. Akbari for helps in the greenhouse. We gratefully acknowledge the technical assistance of Dr. Nezam Asgharipour for dust information in Khuzestan Province. We further thank Dr. Seyed Jafar Seyfabadi for help in revising of the manuscript.
References
Gscholar
Gscholar
Gscholar
CrossRef | Gscholar
CrossRef | Gscholar
CrossRef | Gscholar
CrossRef | Gscholar
Gscholar
Authors’ Info
Authors’ Affiliation
Masoud Kouchaksaraei Tabari 0000-0003-3267-1872
Seyed Mohsen Hosseini
Department of Forestry, Faculty of Natural Resources, Tarbiat Modares University, P.O. Box 14115-111 (Iran)
Department of Soil Science, Faculty of Agriculture, Tarbiat Modares University, P.O. Box 14115-111 (Iran)
Department of Agronomy, Faculty of Agriculture, Tarbiat Modares University, P.O. Box 14115-111 (Iran)
Department of Horticulture and Crop Science, The Ohio State University, 386 E Torrence Road, Columbus, OH 43214 614-313-5975 (USA)
Corresponding author
Paper Info
Citation
Javanmard Z, Kouchaksaraei Tabari M, Bahrami H, Hosseini SM, Sanavi SAMM, Struve D (2019). Dust collection potential and air pollution tolerance indices in some young plant species in arid regions of Iran. iForest 12: 558-564. - doi: 10.3832/ifor3063-012
Academic Editor
Silvano Fares
Paper history
Received: Feb 09, 2019
Accepted: Oct 12, 2019
First online: Dec 17, 2019
Publication Date: Dec 31, 2019
Publication Time: 2.20 months
Copyright Information
© SISEF - The Italian Society of Silviculture and Forest Ecology 2019
Open Access
This article is distributed under the terms of the Creative Commons Attribution-Non Commercial 4.0 International (https://creativecommons.org/licenses/by-nc/4.0/), which permits unrestricted use, distribution, and reproduction in any medium, provided you give appropriate credit to the original author(s) and the source, provide a link to the Creative Commons license, and indicate if changes were made.

Web Metrics
Breakdown by View Type
Article Usage
Total Article Views: 47679
(from publication date up to now)
Breakdown by View Type
HTML Page Views: 39774
Abstract Page Views: 4054
PDF Downloads: 2901
Citation/Reference Downloads: 6
XML Downloads: 944
Web Metrics
Days since publication: 2375
Overall contacts: 47679
Avg. contacts per week: 140.53
Article Citations
Article citations are based on data periodically collected from the Clarivate Web of Science web site
(last update: Mar 2025)
Total number of cites (since 2019): 8
Average cites per year: 1.14
Publication Metrics
by Dimensions ©
Articles citing this article
List of the papers citing this article based on CrossRef Cited-by.
Related Contents
iForest Similar Articles
Research Articles
Evaluating anatomical and biochemical responses to cement dust pollution in Quercus castaneifolia C.A. Mey. and Zelkova carpinifolia (Pall.)
vol. 18, pp. 102-108 (online: 10 May 2025)
Review Papers
Monitoring the effects of air pollution on forest condition in Europe: is crown defoliation an adequate indicator?
vol. 3, pp. 86-88 (online: 15 July 2010)
Research Articles
Effect of dust accumulation on Quercus cerris L. leaves in the Ezer forest, Lebanon
vol. 15, pp. 322-330 (online: 23 August 2022)
Technical Reports
Air pollution regulations in Turkey and harmonization with the EU legislation
vol. 4, pp. 181-185 (online: 11 August 2011)
Research Articles
Bioaccumulation of long-term atmospheric heavy metal pollution within the Carpathian arch: monumental trees and their leaves memoir
vol. 17, pp. 370-377 (online: 27 November 2024)
Editorials
COST Action FP0903: “Research, monitoring and modelling in the study of climate change and air pollution impacts on forest ecosystems”
vol. 4, pp. 160-161 (online: 11 August 2011)
Commentaries & Perspectives
Clean air policy under the UNECE Convention on long-range transboundary air pollution: how are monitoring results “translated” to policy action
vol. 2, pp. 49-50 (online: 21 January 2009)
Research Articles
A fast screening approach for genetic tolerance to air pollution in Scots pine field tests
vol. 6, pp. 262-267 (online: 01 July 2013)
Research Articles
Long-term monitoring of air pollution effects on selected forest ecosystems in the Bucegi-Piatra Craiului and Retezat Mountains, southern Carpathians (Romania)
vol. 4, pp. 49-60 (online: 05 April 2011)
Research Articles
First results of a nation-wide systematic forest condition survey in Turkey
vol. 4, pp. 145-149 (online: 01 June 2011)
iForest Database Search
Search By Author
Search By Keyword
Google Scholar Search
Citing Articles
Search By Author
Search By Keywords
PubMed Search
Search By Author
Search By Keyword


