

Functional traits and functional diversity metrics in aboveground biomass estimation in different physiognomies of Cerrado
iForest - Biogeosciences and Forestry, Volume 19, Issue 5, Pages 329-338 (2026)
doi: https://doi.org/10.3832/ifor4984-019
Published: Sep 01, 2026 - Copyright © 2026 SISEF
Research Articles
Abstract
Growing concerns about climate change and biodiversity loss have increased the importance of research on vegetation ecology and ecosystem functioning for understanding forests and savannas. Functional diversity is a field of study that has expanded in recent years, aiming to explain ecosystem functions through organisms’ functional characteristics. The Cerrado, the second-largest biome in South America, is regarded as the world’s most biodiverse savanna and plays a crucial role in biomass accumulation. In this context, the present study aimed to investigate the role of functional traits in the accumulation of woody aboveground biomass (AGB) in the Cerrado by analyzing the relationship between Community Weighted Means (CWMs) of functional traits and functional diversity metrics across three distinct physiognomies (Cerrado Típico, Cerrado Denso, and Cerradão). We hypothesized that the relationships between biomass and functional diversity metrics would differ among physiognomies. To assess these relationships, we tested correlations between biomass and both CWMs and functional diversity metrics. We measured five traits for dominant species selected according to cumulative abundance criteria in each physiognomy: specific leaf area (SLA), wood density (WD), crown area (CA), maximum diameter (Dmax), and maximum height (Htmax). These traits were used to calculate the respective CWMs, along with five functional diversity metrics: Functional Richness (Fric), Functional Evenness (FEve), Functional Divergence (FDiv), Functional Dispersion (FDis), and Rao’s Quadratic Entropy (RaoQ). We used forest inventory data from the study areas to fit linear models for each physiognomy and mixed-effects models for the complete dataset, with physiognomic type as a random effect. The physiognomies differed in structural and taxonomic characteristics, displaying growth patterns proportional to vegetation stature. Functional differences were also observed: biomass in Cerradão was more strongly associated with functional traits, whereas biomass in Cerrado Denso and Cerrado Típico was more strongly associated with functional diversity metrics. The CWMs Dmax, WD, and CA, along with the diversity metrics Fric and FEve, were the predictors most frequently retained in the best-performing models. General models that included both CWMs and functional diversity metrics, or only CWM Dmax, outperformed models that included only Fric or excluded random effects.
Keywords
Functional Diversity, Brazilian Savanna, Biomass Equation, Mixed Models
Introduction
Tropical forests and savannas are two of the world’s most important ecosystems, containing a large diversity of endemic trees, animals, and other lifeforms that are fundamental to carbon sequestration and other ecosystem services ([33]). Together, they account for about two-thirds of the global gross primary production (GPP) of carbon ([6]), despite covering only 45% of the world’s forested area. Brazil, the fifth-largest country by land area, hosts the world’s largest reserve of tropical forests, including the Amazon and Atlantic forests, as well as the Cerrado, the most biodiverse tropical savanna ([16]). The Cerrado is a highly heterogeneous seasonal savanna biome, characterized by a mosaic of vegetation types that forms a continuum from grassland to forest physiognomies ([11]). Although the Cerrado is the second-largest biome in Brazil, occupying about 20% of the national territory, the expansion of human activities threatens it and has reduced its native vegetation ([18]).
Measuring biomass and carbon stocks in vegetation is challenging, given the vast extent of forests and the difficulty of measuring even a few trees. Because of these challenges, researchers often rely on statistical methods, such as allometric equations. In recent approaches, Artificial Neural Networks (ANNs) and other machine learning tools are employed with promising results ([44]). Typically, biomass is estimated at the individual-tree level ([40], [32]), scaled up to the plot, and then extrapolated across landscapes using remote sensing and geoprocessing tools ([7], [51]). Because few studies cover different forest physiognomies, pan-tropical equations calibrated for various species and regions are often used ([1]). However, these equations tend to be less accurate than locally adjusted equations ([23], [1]). A promising alternative approach that can improve our understanding of biomass accumulation and storage, as well as other ecosystem processes, while reducing modeling errors, is using functional diversity in modeling ([26]).
Functional diversity components can be divided into functional traits and functional diversity metrics, similar to components of phylogenetic diversity. Functional traits are defined as morphological, physiological, or phenological features of a species that confer competitive advantages ([49], [4]). Examples include specific leaf area, maximum height, photosynthetic rate, and wood density, which define the ecological niche occupied by the species ([49], [26]). Each trait is usually weighted by population abundance to produce the Community Weighted Mean (CWM), allowing extrapolation to the community level ([3]). Functional diversity metrics describe the distribution of species within a functional space or niche ([27], [31], [24]). The main indices are Functional Richness (Fric), Functional Evenness (FEve), and Functional Divergence (FDiv) ([27], [35], [46]), but there are other metrics, such as Functional Dispersion (FDis), and redundancy ([9], [24]).
Understanding whether functional traits or diversity metrics can better explain ecosystem processes might shed light on the mechanisms driving them ([47]). If functional diversity metrics can explain these processes, the underlying mechanism is niche complementarity ([45]), where resource partitioning among species minimizes interspecific competition with less niche overlap. The underlying hypothesis is that communities with greater niche diversity exhibit stable ecosystem functioning. If traits can explain ecosystem functioning, the mass-ratio hypothesis applies ([19]), where dominant species’ traits determine productivity, such as large trees increasing biomass levels ([3]). Other proposed mechanisms include the “green soup” and soil fertility hypotheses ([37]). The influence of functional diversity on biomass is often undervalued; however, multiple studies have shown that it positively affects biomass. For example, in a Cerrado community, biomass was positively correlated with several traits and diversity metrics, particularly height, suggesting tall individuals are important contributors ([26]). Similarly, studies in tropical forests ([15]) found biomass storage driven by height, and biomass increment driven by leaf traits, reinforcing the role of mass ratio. Some studies found little to no support for niche complementarity, although it may be more relevant in highly stressful, disturbed environments, such as dry ecosystems ([15], [37]).
This study aimed to evaluate the relationship between functional traits, functional diversity metrics, and aboveground woody biomass in three Cerrado phytophysiognomies and identify the best predictors. We addressed the following question: Does including functional diversity metrics and traits in modeling improve aboveground biomass estimation and ecological interpretation in Cerrado phytophysiognomies? If so, which components contribute the most to physiognomy-specific models and help identify the main ecological drivers of biomass? The physiognomies assessed in this study were: Cerradão (Forested savanna), Cerrado Denso (Dense savanna), and Cerrado Típico (Typical savanna). In order to answer these questions, we proposed the following hypotheses: (i) functional traits and diversity metrics will be significantly associated with biomass and contribute to accurate models; (ii) traits of dominant species will play a more important role in biomass accumulation in more forested physiognomies (Cerradão), whereas functional diversity metrics will be more important in savannas (Cerrado Típico), with both components contributing in the intermediate Cerrado Denso. Additionally, we tested the performance of general models on our dataset.
Material and methods
Study area
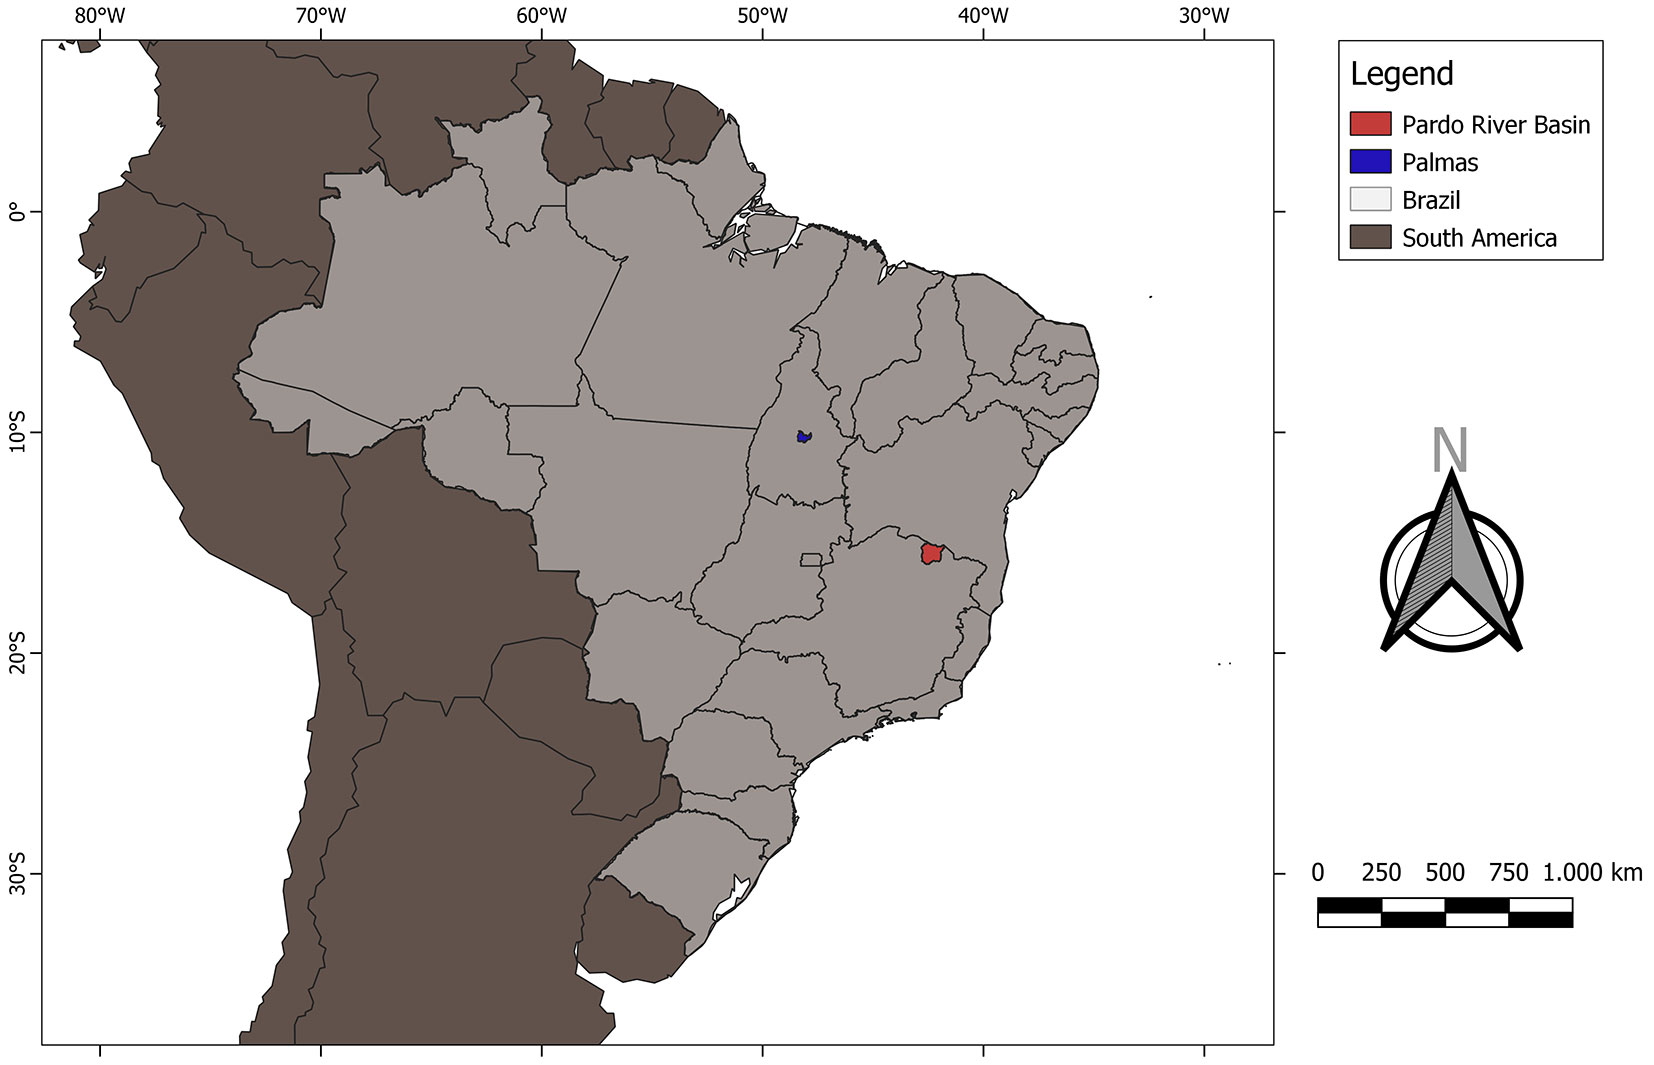
We collected data from sampling units distributed in two locations in Brazil, coming from two independent projects: the Lajeado State Park in Palmas, Tocantins, sampled in 2023, and the Pardo River Basin in Minas Gerais, sampled in 2024 (Fig. 1). Palmas features typical savanna vegetation of the Cerrado, with the study area composed mainly of Cerradão, located in a transitional region between Cerrado and Amazon forest ([26]). Cerrado Denso formation was found in the area adjacent to Cerradão, characterized by smaller trees and little or no canopy formation. The region has a tropical savanna climate (Aw) with a distinct dry season and annual rainfall of approximately 1750 mm. The Pardo River Basin is located in the transition zone between the Caatinga and Cerrado biomes. Cerrado Típico formations dominate the landscape. The area is typically characterized by dystrophic yellow Latosols and has a mean annual rainfall of 741 mm, with a Köppen climate classification of Aw.
Fig. 1 - Location of the study areas in Palmas, Tocantins, and Pardo River Basin, Minas Gerais, Brazil.
Data collection
We sampled 33 plots for Cerradão and 17 for Cerrado Denso in Tocantins, both 20 × 20 m, and 31 plots for Cerrado Típico in Minas Gerais, 20 × 50 m, following the protocol by Felfili et al. ([14]) for plot implementation in Cerrado. The authors recommend larger plot sizes in Cerrado Típico to better capture the sparse distribution of trees, and a diameter measurement at 30 cm due to their shorter average height and tendency to bifurcate. In Tocantins, we collected the following variables: diameter at breast height (DBH) for all trees using calipers, with a minimum inclusion diameter of 5 cm; total tree height (HT) using a telescopic rod; and botanical identification of each individual. Species identification followed the Angiosperm Phylogeny Group (APG IV) classification system. We deposited botanical vouchers in the herbarium of the University of Brasília (UnB). In Minas Gerais, we measured tree diameter at 30 cm above ground (D30) with calipers, using a minimum diameter of 5 cm, and estimated total height visually. We recorded botanical identification for later collection and validation in the CENARGEN herbarium.
Tab. 1 - List of functional traits.
| Trait | Acronym | Explanation |
|---|---|---|
| Maximum height (m) | Htmax | Plant growth attributes that indicate the maximum dimensions that plant species are expected to reach in a given habitat. Estimated from the sampled individuals with the greatest height (Htmax) and diameter (Dmax). |
| Maximum diameter (cm) | Dmax | |
| Crown area (m2) | CA | Horizontal projection of tree crown. It indicates the potential for capturing light and is proportional to non-stem biomass. |
| Wood density (g cm-3) | WD | It influences the growth-survival relationship and is inversely proportional to growth. |
| Specific leaf area (mm2 mg-1) | SLA | Leaf area weighted by dry mass. It relates to photosynthetic potential and the rate of relative plant growth. |
To assess functional diversity, we selected tree species that collectively accounted for 80% of cumulative relative abundance within each physiognomy, according to the functional trait protocol by Pérez-Harguindeguy et al. ([36]). Because dominant species account for most of the woody abundance and biomass within each physiognomy, we considered their functional traits representative of the community component driving biomass accumulation. The functional traits evaluated (Tab. 1) were as follows: specific leaf area (SLA), wood density (WD), crown area (CA), maximum diameter (Dmax), and maximum height (Htmax). For each selected species, we measured ten individuals with the largest values of HT and DBH or D30 among the individuals sampled in the forest inventories for Htmax and Dmax, respectively, and five individuals for SLA and CA, following Pérez-Harguindeguy et al. ([36]). For SLA and CA measurements, we sampled individuals of different sizes within each species. We calculated Crown Area (CA, in m2) using the two perpendicular crown diameters, based on eqn. 1:
where Dc1 is the major crown diameter (in m), and Dc2 is the crown diameter perpendicular to Dc1 (in m).
For SLA, we collected five mature, sun-exposed leaves per species without visible herbivory or disease symptoms, from different positions in the tree crown. We scanned the leaves along with the petiole and rachis, avoiding overlaps. We then calculated leaf area using the software ImageJ via the “LeafArea” package in R ([20]). After scanning, we stored leaves in paper bags and dried them at 70 °C until constant weight. We calculated specific leaf area (SLA, in mm² mg-1) as the ratio of green leaf area to dry leaf mass ([36]), according to eqn. 2:
where AFV is the green leaf area (in mm2), and M0 is the dry leaf mass (in mg).
For each trait, other than wood density (WD), we calculated the arithmetic mean of individual measurements to obtain species-level trait values. Wood density values were obtained using the “getWoodDensity” function from the “BIOMASS” package in R or from literature when species density values were not available ([26]).
Data analysis
We estimated aboveground biomass for individual trees using the pan-tropical allometric equation from Chave et al. ([10] - eqn. 3) for the Cerradão and Cerrado Denso physiognomies, and the equation of Morais et al. ([30] - eqn. 4) for the Cerrado Típico. For phytosociological structure, we used the Importance Value Index (IVIi) for each species, obtained by the sum of Relative Density (RDi - eqn. 5), Relative Dominance (RDoi - eqn. 6), and Relative Frequency (RFi - eqn. 7). This allowed us to explore the differences and similarities between the studied communities and describe their dominant species.
where Y is the biomass estimate (in kg), d is the wood density (in g cm-3), DBH is the diameter at breast height (in cm), D30 is the diameter at 30 cm, and HT is the total height (in m).
where Di, Gi, and Fi are the density, basal area, and frequency of the i-th species, respectively, while Dall, Gall, and Fall are the density, basal area, and frequency of all the species, respectively.
We calculated the Community Weighted Mean (CWM) for each functional trait, weighting species trait values by their relative abundance. Functional diversity metrics were also computed, derived from the functional traits of the dominant trees within each community: Functional Richness (Fric), Functional Evenness (FEve), Functional Divergence (FDiv), and Functional Dispersion (FDis), following Villéger et al. ([48]), as well as Rao’s Quadratic Entropy (RaoQ). We computed all diversity metrics and CWMs using the “FD” package in R ([21]). We computed Spearman’s correlation matrices for AGB, functional-trait CWMs, and functional diversity metrics to detect collinearity and, secondarily, to assess relationships among biomass, functional traits, and functional diversity metrics.
We used modeling to evaluate relationships between biomass and functional traits and functional diversity metrics by identifying the variables most frequently retained among the best-ranked models. We also evaluated the potential accuracy of biomass estimates in those models. For each physiognomy, we fitted linear models using stepwise regression with the “dredge” function from the “MuMin” package. This function fits several models with different parameter combinations and ranks them according to a given criterion. We selected the three models with the lowest Akaike Information Criterion (AIC) values for each physiognomy (Tab. 2), excluding models with collinearity among parameters (rxy ≥ 0.7). To assess potential circularity arising from using wood density in individual-level biomass estimation, we performed a sensitivity analysis by recalculating plot-level AGB using a fixed mean wood density value for each physiognomy. Mean wood density values were calculated from all sampled trees (using species-specific wood density values) within each physiognomy, resulting in values of 0.673 g cm-3 for Cerradão and 0.695 g cm-3 for Cerrado Denso. Using these alternative AGB estimates, we fitted simple linear models relating AGB to CWM WD for each physiognomy and compared their performance with equivalent models fitted using the original AGB estimates derived from species-specific wood density values. Comparisons were based on correlation coefficients (rxy) and root mean square error (RMSE) to assess whether the observed relationships were robust to the biomass estimation method.
Tab. 2 - Aboveground biomass models adjusted for the study areas. (y): aboveground biomass (Mg ha-1); (βi): estimated fixed effect parameters; (γ): random effect parameters; (ε): random error.
| Model | Physiognomy | Formula |
|---|---|---|
| 1 | Cerradão | y = β0 + β1 Dmax + ε |
| 2 | y = β0 + β1 Dmax + β2 FEve + ε | |
| 3 | y = β0 + β1 CA + ε | |
| 4 | Cerrado Denso | y = β0 + β1 FEve + ε |
| 5 | y = β0 + β1 FEve + β2 WD + ε | |
| 6 | y = β0 + β1 FDiv + ε | |
| 7 | Cerrado Típico | y = β0 + β1 Fric+ β2 WD + ε |
| 8 | y = β0 + β1 CA + β2 Fric + β3 Htmax + ε | |
| 9 | y = β0 + β1 Fric + ε | |
| 10 | General | y = β0 + β1 Dmax + β2 Fric + γ + ε |
| 11 | y = β0 + β1 Dmax + γ + ε | |
| 12 | y = β0 + β1 Fric + γ + ε | |
| 13 | y = β0 + β1 Dmax + β2 Fric + ε |
Additionally, three linear mixed models were fitted (Tab. 2), incorporating physiognomy (Cerradão, Cerrado Denso, Cerrado Típico) nested within site (Tocantins, Minas Gerais) as a random effect. Physiognomy nested within site was included as a random effect to model unobserved structural variability between physiognomic units of the Cerrado, account for hierarchical dependence in the data, control for structural and methodological differences between datasets, and improve model accuracy. However, interpreting a 3-level factor as a random effect requires caution. We also fitted a fourth, non-mixed model for the general data. We fitted mixed models using the “lmer” function from the “lme4” package in R ([5]) with the REML algorithm. All models were compared based on the sum of ranks for the following criteria: (i) lowest root mean square error in absolute (RMSE) and relative values (RMSPE); (ii) highest Spearman correlation coefficient (rxy); (iii) lowest AIC (not including mixed models); and residual analysis. We subjected the selected models to k-fold validation with five folds to assess tendencies toward overfitting by noting discrepancies in RMSE values.
Results
Phytosociological parameters, functional traits and diversity metrics
Absolute tree density across the 81 sampled plots ranged from 240 to 1755 individuals per hectare, with an average of 974 ind ha-1. Aboveground biomass ranged from 11.84 to 278.08 Mg ha-1, with an average of 77.28 Mg ha-1. Mean values of density of individuals for Cerrado Típico, Cerrado Denso and Cerradão were 612, 1404 and 1198 ind ha-1, respectively. Mean biomass values for Cerrado Típico, Cerrado Denso, and Cerradão were 23.36, 70.85, and 130.86 Mg ha-1, respectively. While Cerradão and Cerrado Denso shared 43 species (see Fig. S1 in Supplementary material for more details), only four of the top 10 species by Importance Value Index (IVI) were common to both (Fig. S2). Cerrado Típico shared 14 species with Cerrado Denso and 15 with Cerradão. Among the species with the highest IVI, only two overlapped with Cerrado Denso, and none with Cerradão. In Cerradão, the top 10 species in biomass averaged 89 Mg ha0, representing 68% of the total aboveground biomass (see Fig. S2 for IVI and biomass values). There, Emmotum nitens alone stored 25 Mg ha-1. In Cerrado Denso, these species contributed 58 Mg ha-1, or 82% of total biomass, with Myrcia fenzliana standing out at 17.7 Mg ha-1. In Cerrado Típico, they contributed 18 Mg ha-1, representing approximately 77% of total biomass. Species like Caryocar brasiliensis, Eugenia dysenterica, and Tachigali fagifolia collectively stored 9.5 Mg ha-1. Genera such as Caryocar, Pouteria, and Tachigali were prominent contributors across all physiognomies.
Seventeen species were selected for functional trait collection in Cerradão, twelve in Cerrado Denso, and sixteen in Cerrado Típico (see Tab. S1 in Supplementary material for mean values of functional traits per species). They accounted for 101.23, 54.61, and 19.30 Mg ha-1, respectively, corresponding to approximately 80% of total biomass in each physiognomy. Trait values showed wide variation: Htmax ranged from 4.97 to 19.10 m (mean = 11.00 m); CA from 2.87 to 63.99 m2 (mean = 24.20 m²); Dmax from 6.80 to 55.10 cm (mean = 29.61 cm); SLA from 36.72 to 164.34 mm2 mg-1 (mean = 92.52 mm2 mg-1); and WD from 0.36 to 1.00 g.cm-3 (mean = 0.67 g.cm-3). When separated by physiognomy, the most notable differences were found between Cerrado Típico and Cerradão: Htmax averaged 6.6 and 14.0 m, CA averaged 15.5 and 30.6 m2, and Dmax averaged 20.2 and 35.5 cm, respectively. WD and SLA showed little variation between physiognomies, with WD averaging between 0.64 and 0.68 g cm-3, and SLA between 85.8 and 96.3 mm2 mg-1 (Tab. S1 in Supplementary material).
Correlation and modeling
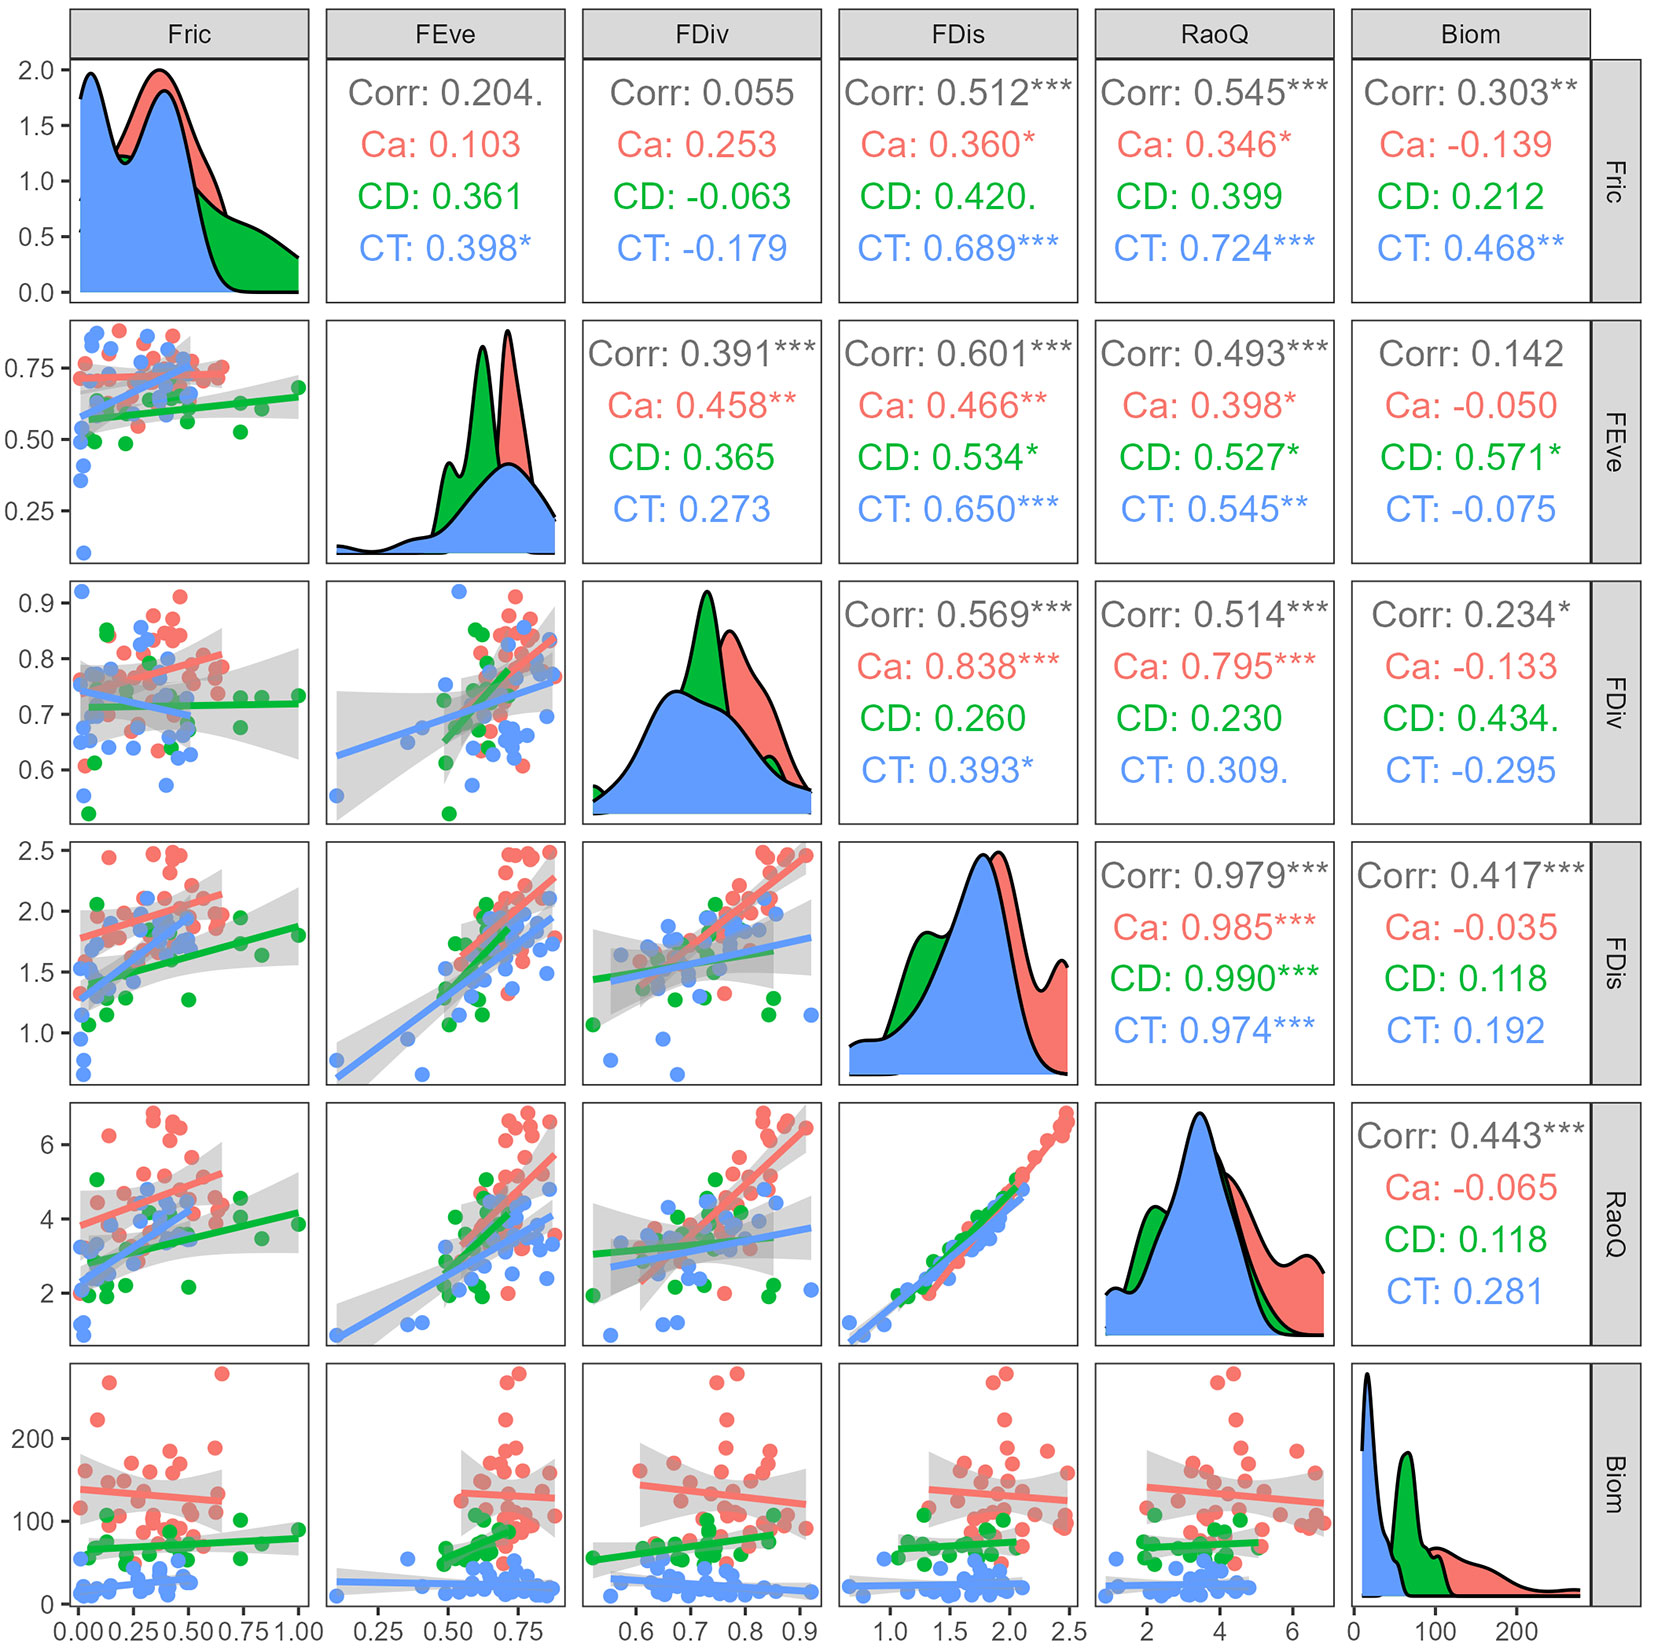
Significant correlations between biomass and CWM Htmax, CA, and Dmax were observed in Cerradão, as well as across all sampled plots (Fig. 2). In Cerrado Típico, and Cerrado Denso, no CWM trait was significantly correlated with biomass. Among functional diversity metrics, Fric, FDis, FDiv and RaoQ correlated significantly with biomass overall. When stratified by physiognomy, Fric was a significant parameter in Cerrado Típico, and FEve in Cerrado Denso (Fig. 3). CWM mean values across the 81 plots were: Htmax = 10.67 m, CA = 22.51 m2, Dmax = 29.34 cm, SLA = 94.96 mm2 mg-1, and WD = 0.69 g cm-3 (Tab. S2 in Supplementary material). Means for Fric, FEve, FDiv, FDis, and RaoQ were 0.32, 0.68, 0.74, 1.73, and 3.72, respectively. See Tab. S3 for individual plot functional diversity metrics and CWMs, and Fig. S3 for the full correlation matrix.
Fig. 2 - Spearman’s correlation between functional traits and aboveground biomass of sampled woody communities. (Biom): Aboveground biomass (Mg ha-1); (Htmax): maximum height (m); (CA): crown area (m²); (Dmax): maximum diameter (cm); (SLA): specific leaf area (mm² mg-1); (WD): wood density (g cm-3). Colors: blue (CT) = Cerrado Típico; green (CD) = Cerrado Denso; pink (Ca) = Cerradão. (*): p<0.05; (**): p<0.01; (***): p<0.001.
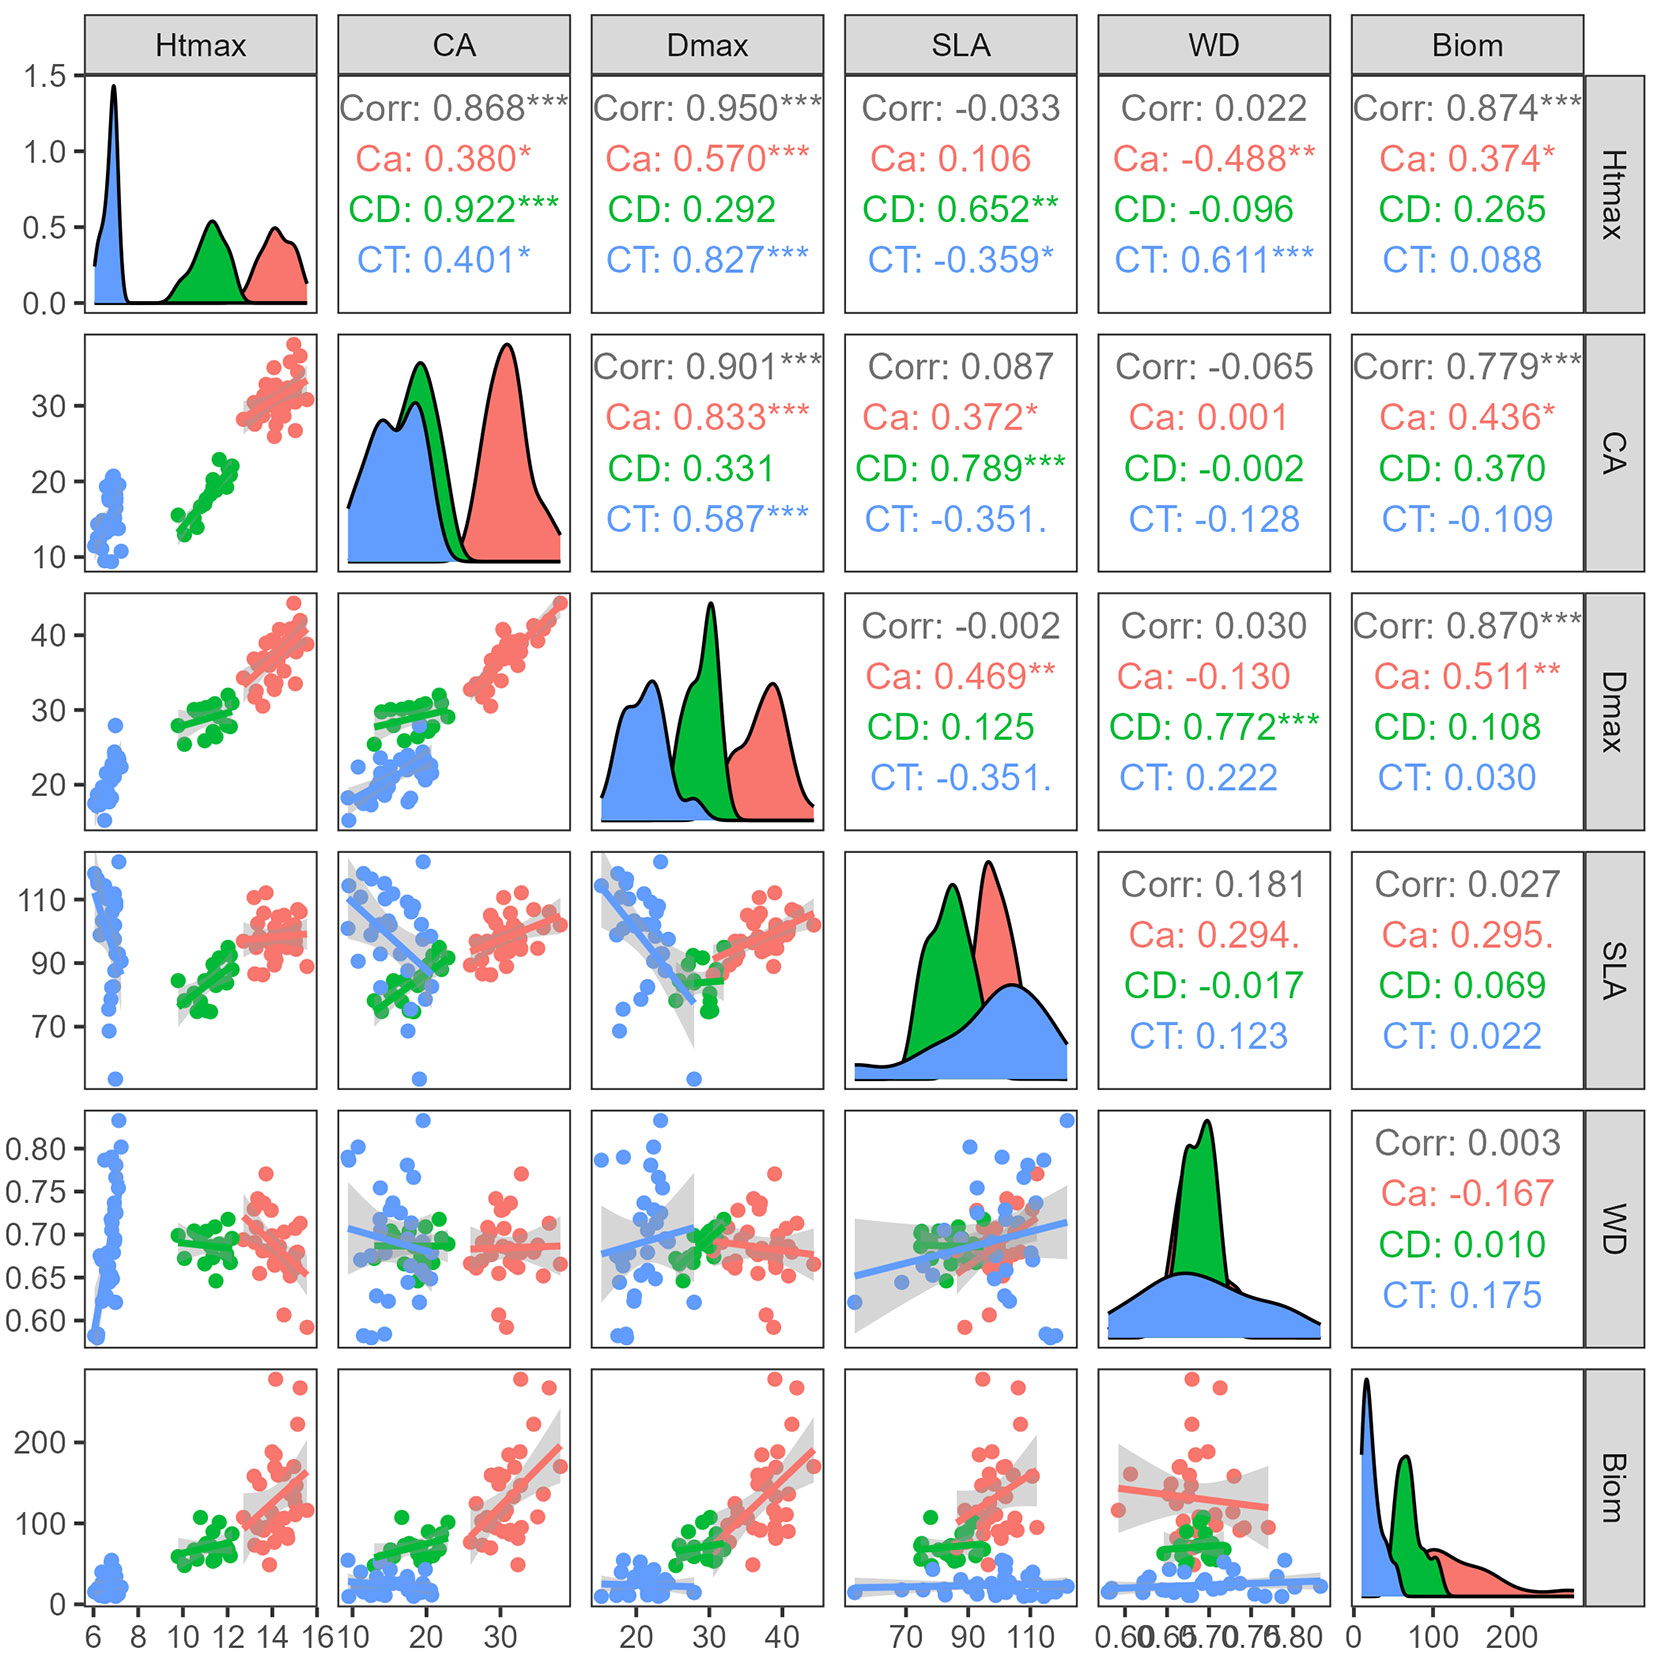
Fig. 3 - Spearman correlation between functional diversity metrics and aboveground biomass of sampled tree communities. (Biom): Aboveground biomass (Mg ha-1); (Fric): Functional Richness; (FEve): Functional Evenness; (FDiv): Functional Divergence; (FDis): Functional Dispersion; (RaoQ): Rao’s Quadratic Entropy. Colors: blue (CT) = Cerrado Típico; green (CD) = Cerrado Denso; pink (Ca) = Cerradão. (*): p<0.05; (**): p<0.01; (***): p<0.001.
Model accuracy varied greatly, particularly when comparing model groups (Tab. 3). The Spearman’s correlation coefficient ranged from 0.370 to 0.448 for models specific to Cerradão, while those adjusted for Cerrado Denso yielded higher values, between 0.434 and 0.647. In terms of RMSPE, models for Cerrado Denso had the lowest values, ranging from 18.662% to 20.768%, whereas models for Cerrado Típico had the highest errors, all above 40%. All multiple regression models tested outperformed their simple regression counterparts, although the improvement in accuracy was modest. The most commonly used parameters were FEve and Fric, each used in three models, as well as CWM Dmax, WD, and CA, each used twice. The sensitivity analysis yielded similar rxy and RMSPE values between the original and alternative AGB estimates in both physiognomies (Tab. S4 in Supplementary material), indicating that including species-specific wood density values did not substantially affect the relationship between AGB and CWM WD. Fric was concentrated in the Cerrado Típico models, while Dmax was primarily used in Cerradão models. According to the ranking, models 2, 5, and 8 were selected as the best estimators of AGB for Cerradão, Cerrado Denso, and Cerrado Típico, respectively. Residual plots showed that Model 2 had no apparent trends of over- or underestimation, with only two residuals falling below -50% (Fig. 4a, Fig. 4b, Fig. 4c). Predictions for Model 5 were highly accurate and closely matched observed values (Fig. 4d), with most residuals within a ±25% range (Fig. 4e), though slightly skewed toward negative values (Fig. 4f). Model 8 exhibited the widest range of residuals, including values below -100% (Fig. 4h, Fig. 4i). K-fold validation indicated no overfitting, with RMSE values similar to the corresponding fitted model RMSE values (RMSE: Model 2 = 29.428; Model 5 = 12.686; Model 8 = 10.045).
Tab. 3 - Fixed-effect parameters and accuracy measures for biomass models adjusted to the study areas. (rxy): Spearman’s correlation; (RMSE): root mean square error (Mg ha-1); (RMSPE): root mean square percentage error (%); (AIC): Akaike information criterion.
| Physiognomy | Model | Parameter | Standard error |
r xy | RMSE | RMSPE | AIC |
|---|---|---|---|---|---|---|---|
| Cerradão | 1 | β0 = - 59.218 | 70.204 | 0.402 | 30.747 | 25.463 | 288.0 |
| β1 = 4.864 | 1.891 | ||||||
| 2 | β0 = - 12.515 | 82.094 | 0.448 | 30.070 | 24.903 | 289.4 | |
| β1 = 5.335 | 1.933 | ||||||
| β2 = - 88.667 | 81.527 | ||||||
| 3 | β0 = - 34.520 | 70.114 | 0.370 | 31.544 | 26.123 | 289.4 | |
| β1 = 5.069 | 2.281 | ||||||
| Cerrado Denso | 4 | β0 = - 12.73 | 33.36 | 0.571 | 13.743 | 19.396 | 145.2 |
| β1= 139.51 | 55.37 | ||||||
| 5 | β0 = - 167.26 | 149.63 | 0.647 | 13.223 | 18.662 | 147.4 | |
| β1 = 154.40 | 56.91 | ||||||
| β2 = 212.02 | 200.18 | ||||||
| 6 | β0 = 4.132 | 35.273 | 0.434 | 14.715 | 20.768 | 147.5 | |
| β1 = 93.347 | 49.061 | ||||||
| Cerrado Típico | 7 | β0 = - 27.960 | 25.500 | 0.549 | 10.887 | 44.108 | 222.9 |
| β1 = 31.010 | 13.390 | ||||||
| β2 = 64.280 | 34.760 | ||||||
| 8 | β0 = - 79.871 | 50.065 | 0.628 | 10.402 | 42.144 | 223.3 | |
| β1 = - 1.325 | 0.715 | ||||||
| β2 = 32.724 | 13.009 | ||||||
| β3 = 17.324 | 7.858 | ||||||
| 9 | β0 = 18.622 | 4.137 | 0.388 | 11.608 | 47.027 | 223.8 | |
| β1 = 23.359 | 13.315 | ||||||
| General | 10 | β0 = - 51.791 | 26.062 | 0.893 | 22.788 | 31.244 | - |
| β1 = 4.136 | 0.835 | ||||||
| β2 = 9.689 | 13.634 | ||||||
| 11 | β0 = - 46.516 | 26.342 | 0.891 | 22.835 | 31.308 | - | |
| β1 = 4.054 | 0.850 | ||||||
| 12 | β0 = 62.544 | 35.258 | 0.857 | 24.052 | 32.975 | - | |
| β1 = 6.884 | 14.383 | ||||||
| 13 | β0 = - 88. 874 | 11.194 | 0.892 | 23.571 | 32.317 | - | |
| β1 = 5.468 | 0.371 | ||||||
| β2 = 10.886 | 13.685 |
Fig. 4 - Relation between observed values and estimates (a, d, g), residual plot (b, e, h), and residual class distribution (c, f, i) of the selected biomass equation for each physiognomy. (a, b, c): Model 2; (d, e, f): Model 5; (g, h, I): Model 8; (j, k, l): Model 10. Colors: blue (CT) = Cerrado Típico; green (CD) = Cerrado Denso; pink (Ca) = Cerradão.
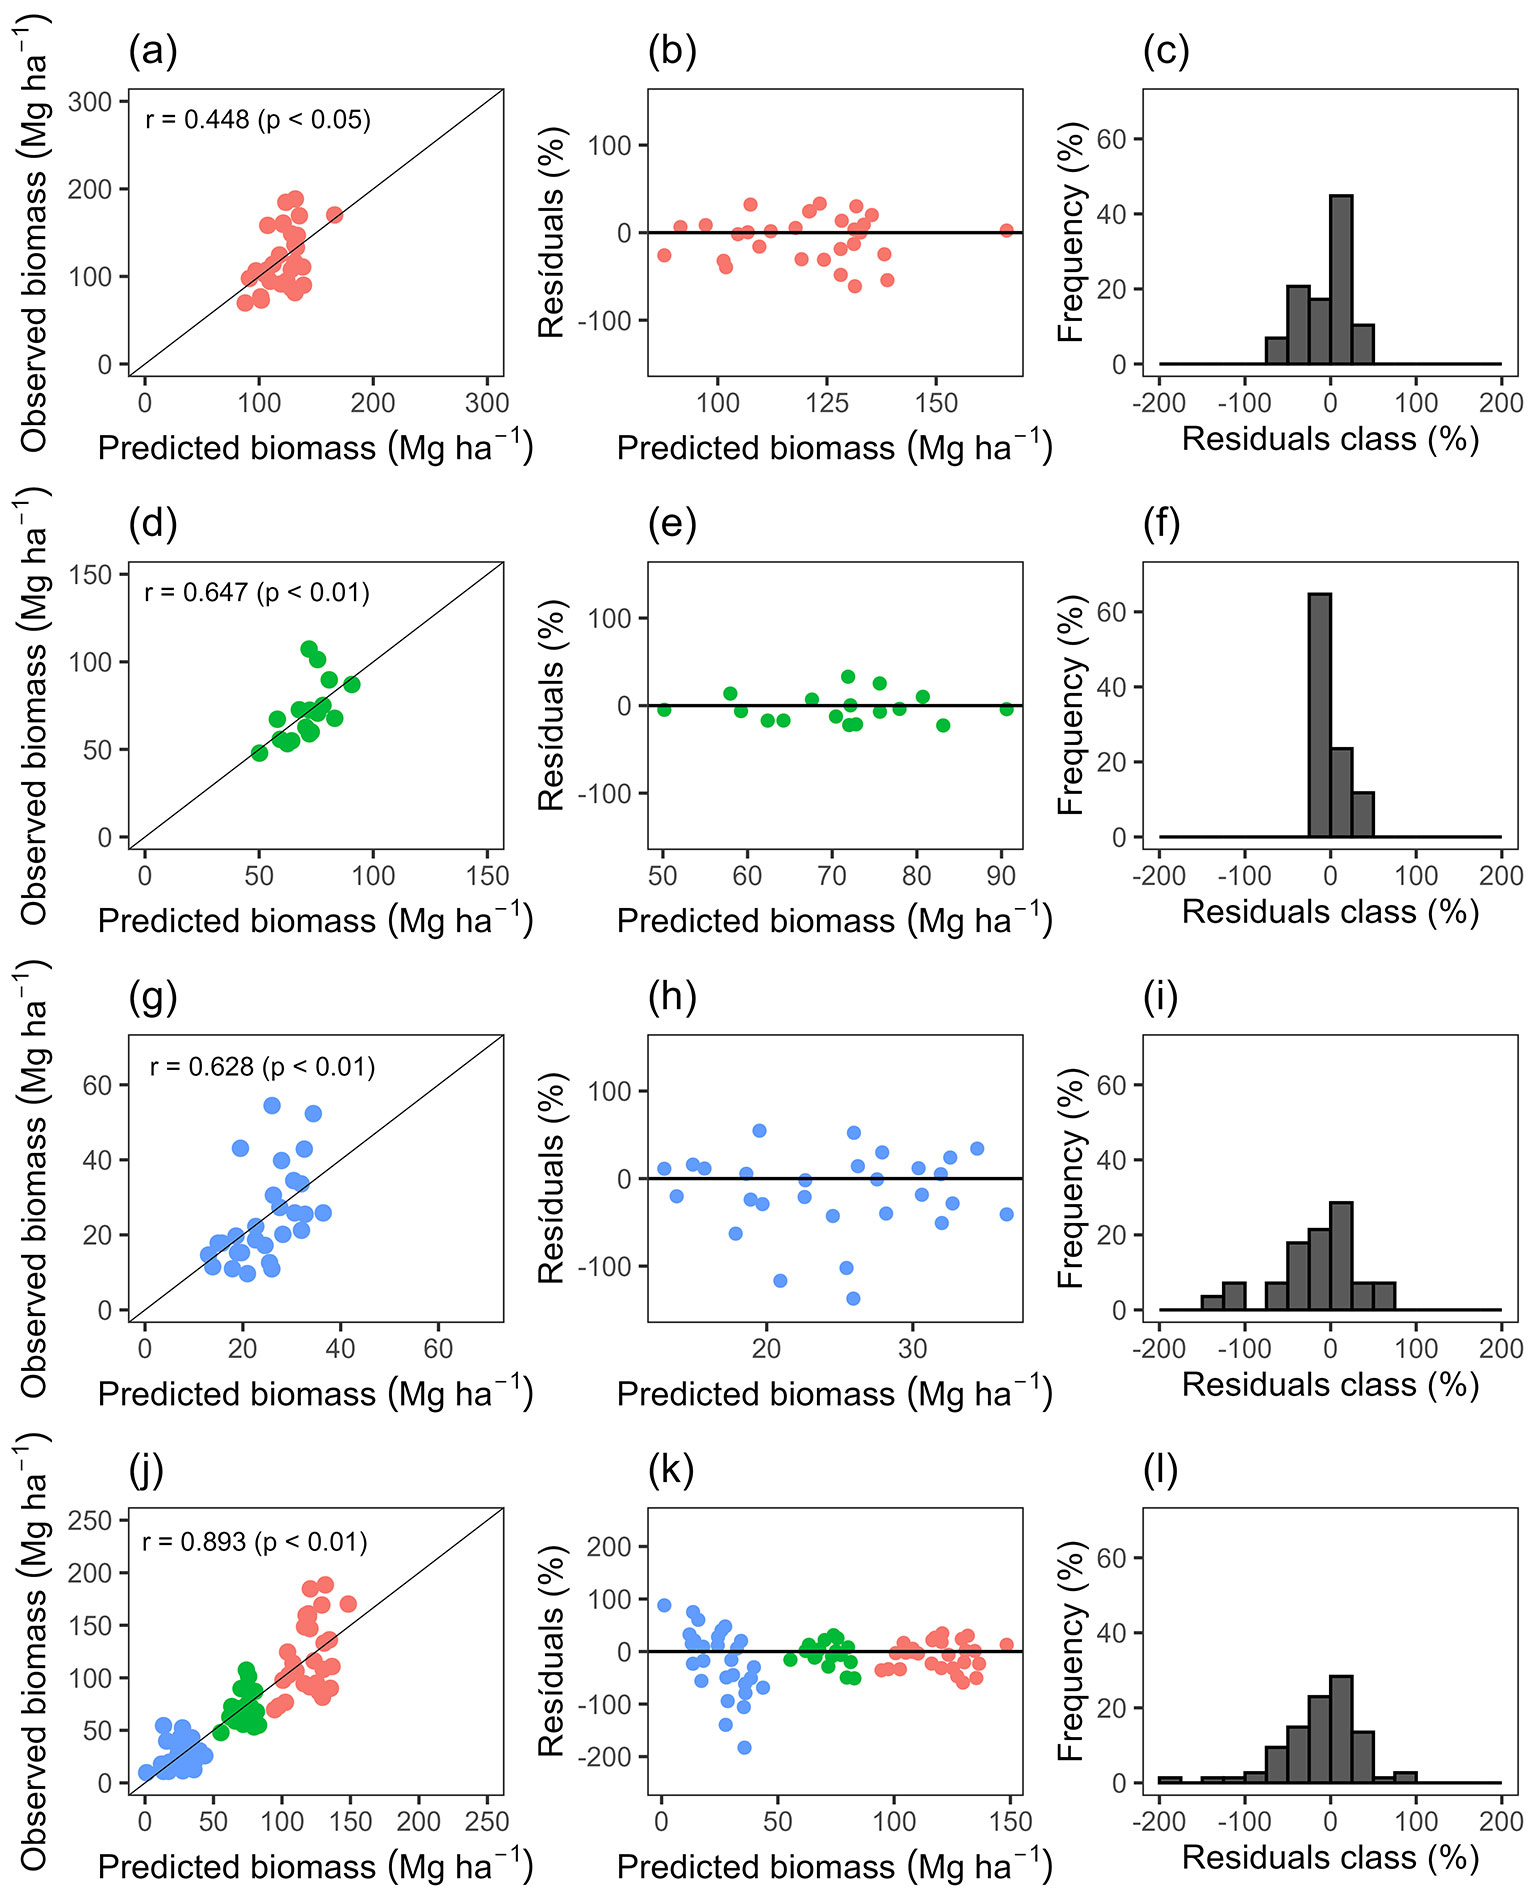
Model 10 had the highest correlation (r = 0.893) and the lowest RMSPE (31.244%), making it the most accurate model overall, followed by Model 11 (r = 0.890; RMSPE = 31.308%) and Model 12 (r = 0.857; RMSPE = 32.976%). Model 13, which excluded random intercepts, achieved similar accuracy (r = 0.892; RMSPE = 32.317%). Models 10 and 11 produced similar predictions (Fig. 4j; see also Fig. S4 in Supplementary material for Models 11, 12 and 13 plots) and residual distributions (Fig. 4k, Fig. 4l), with no clear tendency toward over- or underestimation. Model 12, however, generated more clustered estimates aligned with physiognomy type (Fig. S4). It also had the widest range of random effect parameter estimates (Tab. 4), from -17.526 to 33.328. In Model 10, physiognomies explained 18% of random variation, compared with 13% explained by sites.
Tab. 4 - Estimates of random effects for the mixed linear biomass models.
| Physiognomy | Model 10 | Model 11 | Model 12 |
|---|---|---|---|
| Cerradão | 10.266 | 10.364 | 33.327 |
| Cerrado Denso | - 4.385 | - 4.628 | - 15.802 |
| Cerrado Típico | - 5.882 | - 5.737 | - 17.526 |
| Tocantins | 4.372 | 5.631 | 21.812 |
| Minas Gerais | -4.372 | -5.631 | -21.812 |
Discussion
Influence of structure, functional traits and diversity metrics on physiognomies and biomass
The results showed marked differences among the studied physiognomies in structure, species composition, and functional characteristics, reflecting the Cerrado’s structural heterogeneity. When considering biometric parameters such as biomass and tree height, there was a clear progression from the more open vegetation of the Cerrado Típico to the more forested Cerradão, with Cerrado Denso representing an intermediate stage. This supports the idea that vegetation types possess structural and functional features that render them distinct ecological units ([42]). In contrast, individual density did not follow this linear trend, with Cerrado Denso having, on average, the highest tree density. Although a higher density might be expected in more robust forests ([8]), greater abundance has also been found at intermediate successional stages in forests from southern Brazil ([41]). Canopy closure in the Cerradão negatively affects small understory trees, favoring dominant, tall individuals such as Emmotum nitens or Mezilaurus itauba, which accumulate large biomass. In the Cerrado Denso, however, light enters the lower strata, allowing short individuals to remain competitive, with a high population density, as observed for Miconia albicans or M. fenzliana.
Another distinction was species richness and composition. Species richness was higher in Cerrado Típico, which may reflect greater environmental heterogeneity in the Rio Pardo Basin than in Lajeado Park. Variability in edaphoclimatic factors such as topography and microclimate, even at small scales, positively affects species richness and composition by expanding niche availability ([43], [12]). Additionally, the diverse land uses in the Basin may influence vegetation to different extents, producing a mosaic of functional stages that affect the local flora ([38]). Despite this species richness, the number of dominant species did not exceed twenty in any of the physiognomies evaluated, which directly affects the estimation of functional diversity metrics. Functional richness and evenness, in particular, are sensitive to the deletion of species with more extreme characteristics, sometimes common in rare species, implying a reduction in the niche space filled. Thus, because functional traits were measured only for dominant species, the functional diversity metrics presented here describe the functional structure of the dominant woody component rather than the community’s overall functional diversity. Nevertheless, dominant species store most of the aboveground biomass and are expected to exert the strongest influence on ecosystem functioning, making them particularly relevant for understanding biomass accumulation patterns ([19], [22]).
Correlations between biomass and functional traits, diversity metrics, and modeling results also revealed distinct patterns among physiognomies. In Cerradão, biomass patterns were primarily associated with traits describing tree size and growth potential (Dmax, Htmax, and CA), whereas it was negatively, though not significantly, correlated with functional diversity metrics. Cerrado Denso showed stronger correlations with diversity metrics, although only FEve was statistically significant. In Cerrado Típico, biomass also correlated better with metrics, but only Fric was significant. Models comprised of both functional diversity metrics and community means showed the best accuracy here. Thus, the results supported the first initial hypothesis, that functional components are significant to biomass, although the second hypothesis could not be fully confirmed.
Maximum height reflects the tallest individuals in a community and is analogous to dominant height, a metric used to assess site quality and growth potential, as it relates to biomass volume ([39]). It also indicates light-competition ability - a critical resource under canopy in forested environments, where light is limiting - explaining its predictive value in Cerradão ([25], [26]). Crown Area (CA) is another critical trait in denser, forested settings. Species like E. nitens and P. platycephala with large CA accumulate more biomass, dominate upper canopy layers, and outcompete smaller trees by monopolizing light. CA acts as a proxy for crown biomass, which may represent up to 57% of total aboveground biomass in Cerradão and sometimes exceeds stem biomass ([29]). This ratio varies by species and can shift as trees grow ([28]). Maximum diameter indicates dominant trees’ basal area occupation and is, alongside Htmax, closely tied to stem volume and carbon content ([37], [3]). Like Htmax, Dmax varied among physiognomies, capturing their structural gradient. In Cerradão, CWM Dmax was a dominant parameter in the selected models, supporting the mass-ratio hypothesis as the primary mechanism explaining biomass accumulation there. FEve showed a negative effect in the models, suggesting that biomass stocks benefit from an unequal distribution of niche resources and reinforcing the importance of dominant species.
Cerrado Denso presented a unique case, with multiple diversity metrics and functional traits (e.g., CA and FDiv) showing positive correlations with biomass, but only CWM FEve being significant. The relationship with functional evenness implies that efficient resource partitioning among niches promoted greater biomass, highlighting the importance of niche complementarity ([45], [2]). However, the average FEve in Cerrado Denso (0.63) was lower than in other physiognomies. Higher FEve is often associated with better conservation status and reduced fragmentation ([50]), which may help explain Cerradão’s higher mean (0.71), but it does not explain the intermediate mean (0.66) of the less conserved Cerrado Típico.
Cerrado Típico, like Cerrado Denso, showed positive correlations with both functional traits and diversity metrics, but only Fric was significant, suggesting that niche complementarity mattered more than mass-ratio for biomass accumulation. The positive correlation with Fric suggests biomass gains through greater niche occupation, which also supports niche specialization. Two models adjusted for the Cerrado Típico, on the other hand, showed combinations of diversity metrics and functional traits, including CA, WD, and Htmax, with no significant correlations, indicating that complementarity and mass-ratio work together in biomass storage. The two hypotheses are not mutually exclusive and can occur together ([2]). Nevertheless, the Fric metric was present in all three selected models, suggesting a greater importance of complementarity. Paquette & Messier ([34]) observed that biodiversity had a significant effect in the boreal forest, a biome with more extreme climates and scarcer resources. Similarly, in the Cerrado Típico, the climate was drier and more subject to anthropogenic disturbances than the other physiognomies, which may explain the greater effect of richness on biomass accumulation under conditions of richer niche occupation.
Modeling gains with functional diversity
Model accuracy fell within commonly reported ranges, with correlation values from 0.370 to 0.898 and RMSPE from 18.662% to 34.075%. Zimbres et al. ([51]), using machine learning on aerial imagery, reported RMSPE values above 55% for biomass estimation in the Cerrado. Bispo et al. ([7]), by contrast, achieved an RMSPE of 13% with their most accurate model, illustrating the variability of model performance in native vegetation. Added to this are uncertainties from individual-level biomass models, which typically show errors from 20% to 60% ([40], [32]). Martins et al. ([26]), using both functional traits and diversity metrics in models, reported correlation values from 0.29 to 0.63, with errors exceeding 30%. Therefore, using functional diversity components as model parameters may improve model accuracy, at least in some physiognomies.
In our full dataset analysis, both functional traits and diversity metrics had significant correlations with biomass. However, combined models did not achieve substantially higher accuracy than trait-only models, suggesting that diversity metrics may play a complementary role in general models. Furthermore, the diversity metrics-only model showed a strong bias toward physiognomy-specific mean biomass, indicating that vegetation type had a stronger influence than the diversity metrics themselves. Including random effects helped account for structural and methodological differences between study areas, including plot size and measurement protocol, by attributing some unexplained variation to hierarchical differences among physiognomies and sites rather than to functional predictors alone. This approach improves inference when combining datasets collected under different protocols, which is common in large-scale ecological studies. Nevertheless, because the sampling design does not fully separate vegetation type from geographic location, comparisons among physiognomies should be interpreted with caution, as some observed differences may be partially attributable to regional environmental variation and methodological differences between datasets. The model without random effects performed similarly in terms of correlation to the best model but had higher error. Gelman & Hill ([17]) argued that mixed models with few groups (< 5) perform similarly to traditional fixed models. Future studies aiming to develop general models for the Cerrado can overcome this by having a larger diversity of sites and physiognomy groups. Dos Santos et al. ([13]) also observed modest gains from mixed models (r = 0.981; RMSPE = 8.055) compared to fixed models (r = 0.978; RMSPE = 8.634) in teak plantations, using tree age as a random effect and an easily obtainable variable. Including indirect variables such as age or physiognomy type may help reduce random error in modeling without significantly increasing data collection effort.
Our results highlight a clear distinction among physiognomies from structural, floristic, and functional perspectives, all of which directly influence biomass production. Biomass accumulation in Cerradão aligned most closely with the mass-ratio hypothesis, whereas in Cerrado Denso and Cerrado Típico it was more consistent with niche complementarity. However, the best-predicting models included both functional diversity metrics and traits, suggesting that functional diversity components work best together as biomass predictors. When considering the full dataset, the data supported a stronger role for mass-ratio effects, but complementarity remained relevant. Models that incorporate functional diversity components and include physiognomy as a random effect can improve accuracy without complicating field efforts. Future research should aim for broader sampling across regions and vegetation types, and ideally, incorporate site-specific models for greater precision.
Conclusions
Community Weighted Means were good predictors of woody aboveground biomass in Cerradão, suggesting that mass-ratio is an important driver in biomass accumulation. Functional evenness was the best predictor of biomass in Cerrado Denso, suggesting that niche complementarity is its main driver. Functional richness best predicted biomass in Cerrado Típico, suggesting a stronger role for niche complementarity in biomass accumulation, although mass-ratio may also contribute. For all physiognomies and the general dataset, the most accurate models included both functional diversity metrics and functional traits, indicating that biomass in the Cerrado is explained not by a single ecosystem mechanism, but by their combination.
Acknowledgements
We would like to thank the National Council for Scientific and Technological Development (CNPq) for the financial support for the research (Process 423236/2021-0, Emerging Groups) and for the research productivity grant for E.P.M. (Grant no. 305875/2025-6), the EcoSiPas project for the research grant for R.F.L.C. and for the logistical support during the field work, and the Forest Production Management Laboratory (LMPF) at the University of Brasilia (UnB) for the technical support and infrastructure.
References
CrossRef | Gscholar
CrossRef | Gscholar
CrossRef | Gscholar
CrossRef | Gscholar
CrossRef | Gscholar
Gscholar
CrossRef | Gscholar
Gscholar
CrossRef | Gscholar
CrossRef | Gscholar
CrossRef | Gscholar
CrossRef | Gscholar
CrossRef | Gscholar
Gscholar
CrossRef | Gscholar
CrossRef | Gscholar
CrossRef | Gscholar
CrossRef | Gscholar

Authors’ Info
Authors’ Affiliation
Eder Pereira Miguel 0000-0001-6259-4594
Juscelina Arcanjo Dos Santos 0000-0003-4731-2610
Eraldo Aparecido Trondoli Matricardi 0000-0002-5323-6100
University of Brasilia, Department of Forest Sciences, Campus Darcy Ribeiro W/N, 70910-900 Brasilia, DF (Brazil)
Aldicir Scariot 0000-0003-0771-3073
Matheus Santos Martins 0000-0003-1716-4354
Brazilian Agricultural Research Corporation (EMBRAPA), Park Estação Biológica, Brasília, DF, 70770-917 (Brazil)
Brazilian Forest Service, SCEN, Trecho 2, Bl. H, 70818-900, Brasília, DF (Brazil)
Federal University of Mato Grosso do Sul, UFMS, Campus Chapadão do Sul, 79560-000, Chapadão do Sul, MS (Brazil)
Corresponding author
Paper Info
Citation
Caldeira RFL, Miguel EP, Dos Santos JA, Dos Santos ML, Azevedo GB, Matricardi EAT, Scariot A, Martins MS (2026). Functional traits and functional diversity metrics in aboveground biomass estimation in different physiognomies of Cerrado. iForest 19: 329-338. - doi: 10.3832/ifor4984-019
Academic Editor
Angelo Rita
Paper history
Received: Sep 11, 2025
Accepted: Jun 23, 2026
First online: Sep 01, 2026
Publication Date: Oct 31, 2026
Publication Time: 2.33 months
Copyright Information
© SISEF - The Italian Society of Silviculture and Forest Ecology 2026
Open Access
This article is distributed under the terms of the Creative Commons Attribution-Non Commercial 4.0 International (https://creativecommons.org/licenses/by-nc/4.0/), which permits unrestricted use, distribution, and reproduction in any medium, provided you give appropriate credit to the original author(s) and the source, provide a link to the Creative Commons license, and indicate if changes were made.

Web Metrics
Breakdown by View Type
Article Usage
Total Article Views: 1163
(from publication date up to now)
Breakdown by View Type
HTML Page Views: 294
Abstract Page Views: 471
PDF Downloads: 340
Citation/Reference Downloads: 0
XML Downloads: 58
Web Metrics
Days since publication: 46
Overall contacts: 1163
Avg. contacts per week: 176.98
Article Citations
Article citations are based on data periodically collected from the Clarivate Web of Science web site
(last update: Jul 2026)
(No citations were found up to date. Please come back later)
Publication Metrics
by Dimensions ©
Articles citing this article
List of the papers citing this article based on CrossRef Cited-by.
Related Contents
iForest Similar Articles
Short Communications
Effects of nitrogen, calcium and cation exchange capacity on gum yield in Acacia senegal under plantation and savanna woodland conditions in northern Guinea savanna, Nigeria
vol. 4, pp. 190-194 (online: 11 August 2011)
Research Articles
Advantages of the point-intercept method for assessing functional diversity in semi-arid areas
vol. 8, pp. 471-479 (online: 31 October 2014)
Research Articles
Effects of functional traits on the spatial distribution and hyperdominance of tree species in the Cerrado biome
vol. 15, pp. 339-348 (online: 01 September 2022)
Research Articles
Relationships between overstory and understory structure and diversity in semi-natural mixed floodplain forests at Bosco Fontana (Italy)
vol. 9, pp. 919-926 (online: 21 August 2016)
Research Articles
Artificial intelligence associated with satellite data in predicting energy potential in the Brazilian savanna woodland area
vol. 13, pp. 48-55 (online: 05 February 2020)
Research Articles
Belowground biomass models for young oligotrophic Scots pine stands in Latvia
vol. 11, pp. 206-211 (online: 01 March 2018)
Review Papers
Biodiversity assessment in forests - from genetic diversity to landscape diversity
vol. 2, pp. 1-3 (online: 21 January 2009)
Research Articles
Functional turnover from lowland to montane forests: evidence from the Hyrcanian forest in northern Iran
vol. 8, pp. 359-367 (online: 16 September 2014)
Research Articles
Allometric equations to estimate above-ground biomass of small-diameter mixed tree species in secondary tropical forests
vol. 13, pp. 165-174 (online: 02 May 2020)
Research Articles
Tree biomass models for the entire production cycle of Quercus suber
vol. 18, pp. 38-44 (online: 28 February 2025)
iForest Database Search
Search By Author
Search By Keyword
Google Scholar Search
Citing Articles
Search By Author
Search By Keywords
PubMed Search
Search By Author
Search By Keyword