Artificial intelligence associated with satellite data in predicting energy potential in the Brazilian savanna woodland area
iForest - Biogeosciences and Forestry, Volume 13, Issue 1, Pages 48-55 (2020)
doi: https://doi.org/10.3832/ifor3209-012
Published: Feb 05, 2020 - Copyright © 2020 SISEF
Research Articles
Abstract
The use of artificial intelligence to generate information of the savanna’s energy capacity may support sustainable management of those areas. We assessed the efficacy of artificial neural networks (ANNs) combined with satellite data to estimate the energy potential (Pe) for cerradão, a dense savannah-like vegetation type in Brazil. We conducted a forest inventory for measuring dendrometric variables and sampling woody materials and barks in a cerradão area in the state of Tocantins, Brazil. The Pe of cerradão biomass was estimated based on the observed higher calorific power and drier biomass values. Six vegetation indices were retrieved from a RapidEye image and tested for correlation to choose the optimum vegetation index for biomass modeling. The basal area and the Normalized Difference Vegetation Index were used as predictors in the Pe modeling. We estimated an average of 19.234 ± 0.411 GJ ton-1 and 19.878 ± 1.090 GJ ton-1 for higher heating values of the wood species and barks, respectively, and an average Pe of 1022.660 GJ ha-1. The best ANN showed an error of 11.3% by using a structure of two, eight, and one neurons in the input layer, in the hidden layer, and in the output layer, respectively, as well as activation functions of the tangential and sigmoidal types. The validation tests showed no significant difference between the observed and ANN-predicted values. Based on our results, we concluded that Pe can be efficiently predicted by combining ANNs and remotely sensed data, which ultimately is a promising tool for forest sustainable management of the cerrado ecosystems.
Keywords
Artificial Neural Networks, Cerrado, Higher Heating Value, Biomass, Modelling, Forestry
Introduction
The Brazilian savanna (locally known as Cerrado) encompasses approximately 24% of Brazilian territory. It is the second largest biome in South America, and is recognized as the savanna with the highest species-diversity on the planet. Its vegetation is characterized by a mosaic of different physiognomies: savannas, fields, and forests, which include the savanna woodlands (also known as cerradão - [31]).
Cerradão has a complex physiognomy and presents species from other formations and physiognomies of the Cerrado, being highly associated with regions of interfluvial flat areas ([45]). It is a great challenge to acquire dendrometric information in Cerradão region due to its complexity and heterogeneity of vegetational structure; indeed, data collection aimed to assess productive aspects of the Cerrado is a time and money consuming activity, making this research topic rather scarce in the literature ([32]).
The Cerrado vegetation has an important timber potential to provide raw material for both sawmills and energy purposes ([27], [26]). Several studies have emphasized the productive potential of forest areas commonly focusing on the estimation of above-ground biomass and stored wood volume ([30], [3], [7]); however, more research efforts are required to assess the energy potential of those areas for economic and environmental purposes.
Energy density represents the amount of energy to be released after the complete combustion of a given volume of biomass fuel ([37]). It is a very important parameter in species selection for energy production, since it is directly related to the higher heating value - a mostly important variable for wood selection ([2]). Additionally, energy density is an indicator of energy potential (Pe) per area unit.
Wood and energy production data are essential for improving sustainable management and conservation policies and planning in the Cerrado region. This information may be used, for example, in the definition of conservation areas like legal reserves by determining poorly productive areas with relevant environmental and conservative values. However, to ensure the implementation and improvement of such practices, accurate estimates of productive and energetic potential are needed ([27]).
Remotely sensed data and geoprocessing techniques have been used to provide information of land use and land cover changes with good accuracy that may decrease time and financial costs of data collection in tropical regions. More recently, the advances in remote sensing and geoprocessing technology allowed to better characterize forest structure, biomass, stored carbon, and other variables ([18]). Several studies using remotely sensed data showed satisfactory results in the indirect estimation of the above-ground biomass in several types of forest ([30], [3], [7]).
Associating remote sensing data with artificial neural networks (ANNs) may result in increasing the predictive power and correcting the estimation errors of these techniques. The ANNs can be defined as parallel distributed processors composed of simple processing units, which present a natural capacity of learning and storing experimental knowledge, thus making their model simulation similar to the human brain ([21]).
The use of ANNs to predict above-ground biomass has shown a higher accuracy compared to the traditional regression models ([30]). Studies using remotely sensed data and artificial intelligence tools such as ANNs to predict energy density in tropical regions are fairly uncommon. This study intended to assess the efficiency of ANNs associated with remote sensing data in estimating the timber energy potential for a Cerradão in the central region of Brazil.
Materials and methods
Study area
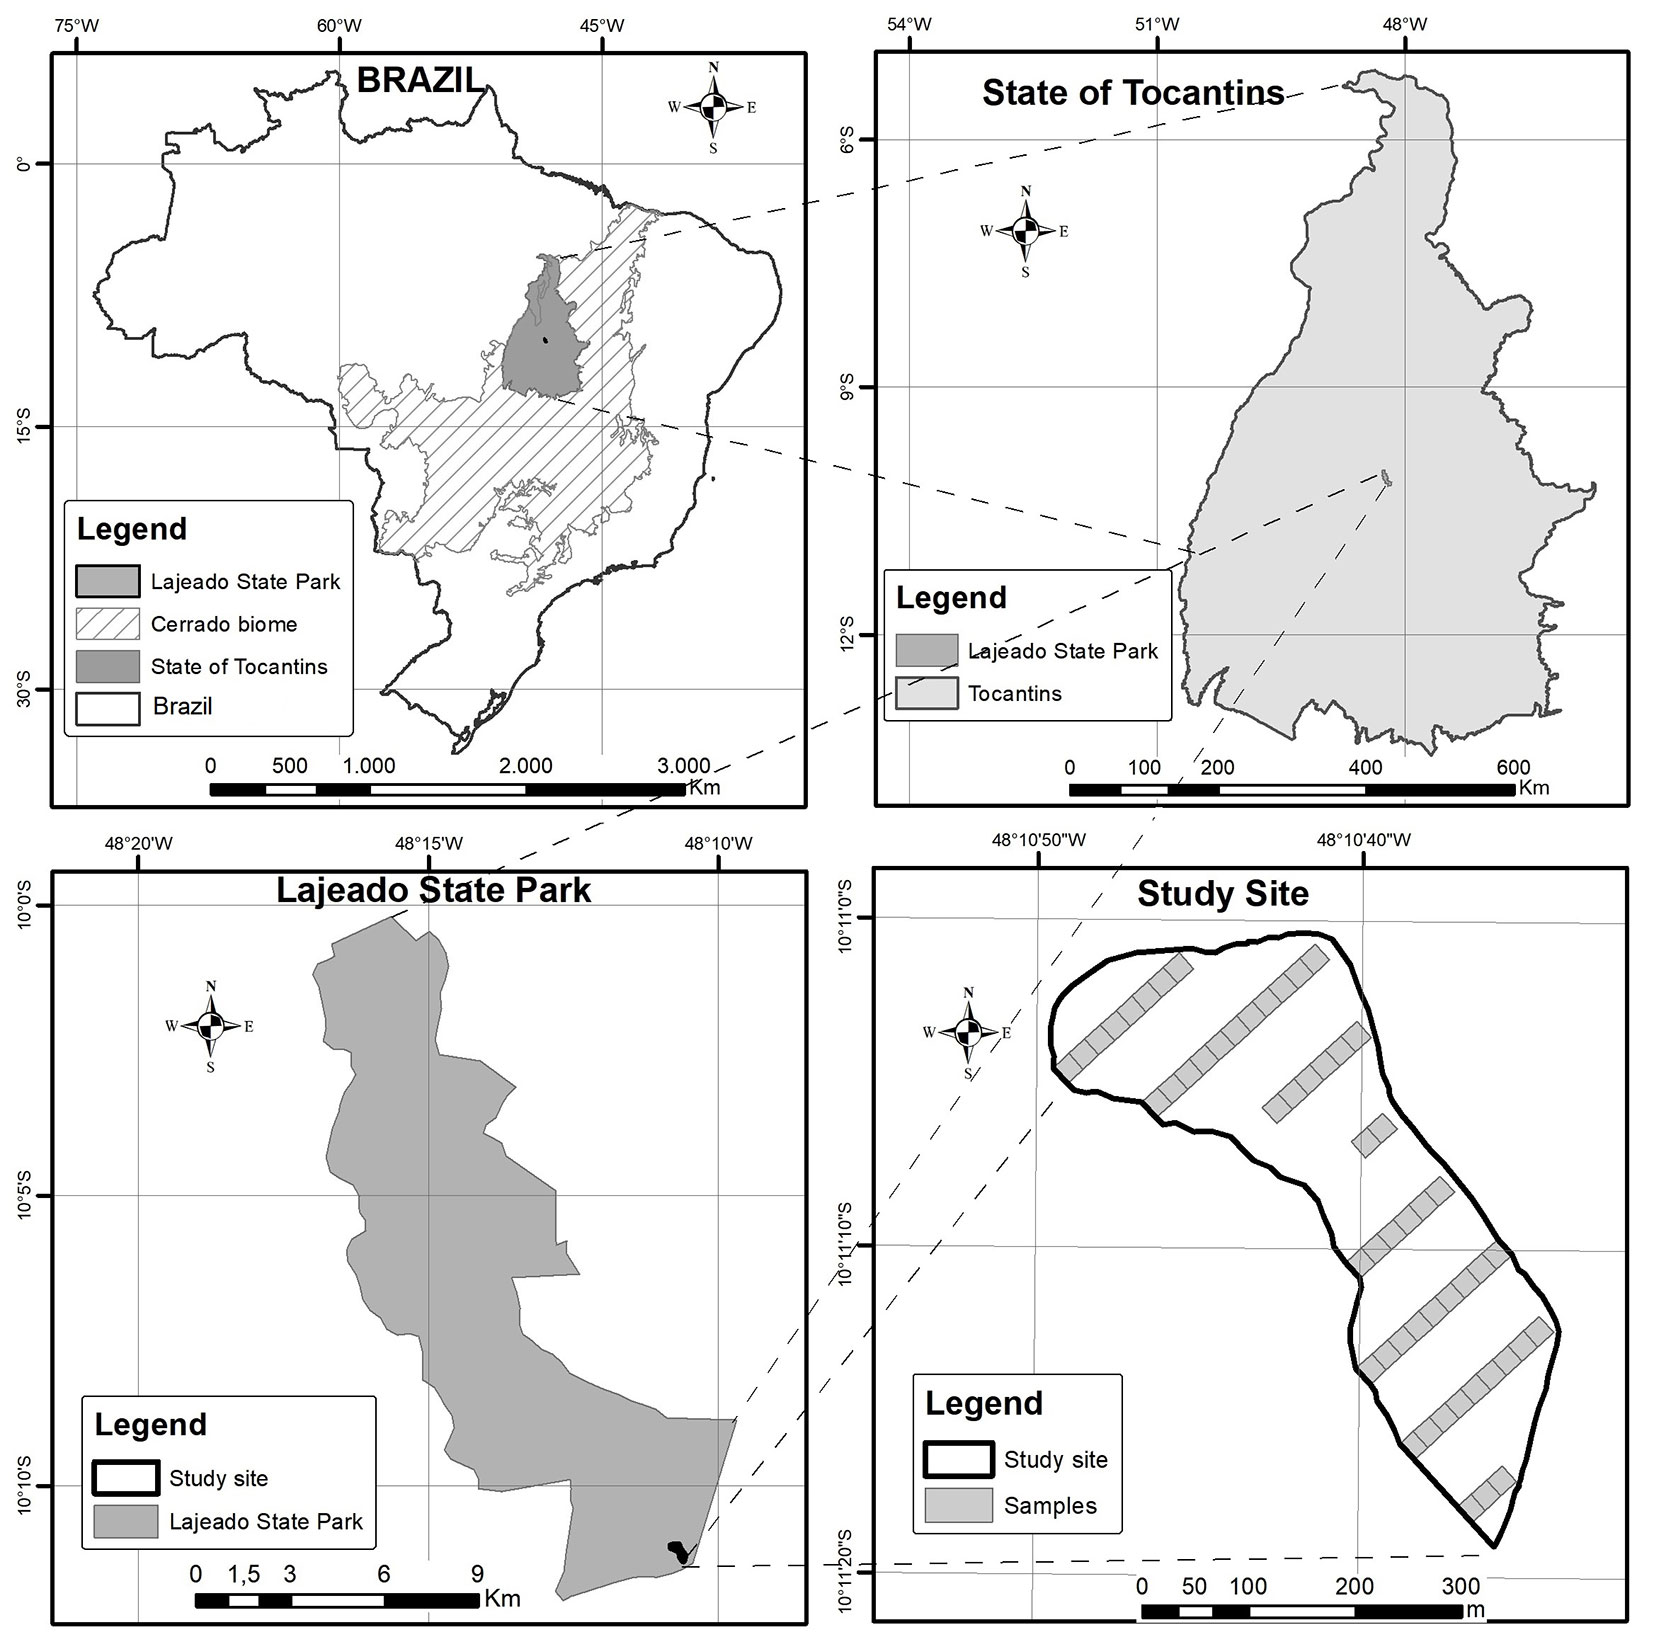
This study was based on a dataset from a forest inventory conducted in 2012 in a study site of 10.15 hectares of cerradão (savanna wood land) located within the Lajeado State Park in the state of Tocantins, Brazil (Fig. 1).
Fig. 1 - Study area location and layout.
According to Köppen classification, the study region is characterized by the Aw climate type ([1]), with a wet season of an average monthly rainfall of 250 mm between December and February, and a dry season between May and September. The dryer peak period occurs between June and August. The study site is characterized predominantly by deep or very deep alic dystrophic Dark-Red Latosols, with the presence of horizons A, B, and C. The vegetation is composed by 82 tree species of 34 different families.
Data collection
The forest inventory was carried out in eight transects of 20 m width and variable lengths. The transects were spaced 60 m each other. Each transect was subdivided into sample plots of 20 × 20 m (400 m²) dimensions. A total of fifty-four sample plots were measured in a sampled area of 2.16 ha.
All living and dead standing trees showing diameters at breast height (DBH) equal to or greater than 5 cm were identified and their DBH and total height (Ht) were measured within each sample plot. The DBH of each tree was measured using a diameter caliper - these measure and tool were chosen due to their accuracy considering the windingness of trees’ stems -, while the Ht was measured using a telescopic ruler of 15 m. The heights of trees taller than 15 m height were eye-estimated by an experienced forester and the DBH were estimated based on a mean value of two perpendicular DBH measures. Trees showing trunk bifurcations below the DBH height were separately measured for the diameter, height, and cross-sectional area.
Wood sampling
A total of 80 individual trees belonging to 34 of the 82 identified tree species in the study area were cut down and used in the lab tests. The reduced number of species in the sampled transects was due to their sparse distribution and to the environmental law that prohibits cutting individuals of protected tree species. The number of individuals of each tree species to be cut was estimated based on the forest inventory. Approximately 3% of trees showing DBH greater than 5 cm and at least one sampled individual of each tree species were cut down and used in the lab tests under a legal permit issued by the Environmental Agency of the State of Tocantins (NATURATINS). The DBH of cut trees varied from 5.3 cm to 49 cm.
Three 5-cm thick, disk-shaped samples of each cut tree were collected from different longitudinal positions of each trunk (base, middle and top), as previously described ([33]), to better represent wood properties. Additionally, different branch diameters (thick branch: diameter > 10 cm; medium branch: diameter 3-10 cm; thin branch: diameter < 3 cm) were separated from the bark portion and individually analyzed in the lab.
The 34 tree species that were sampled (cut down) in the field represented approximately 95% of the total individuals sampled in the forest inventory, which was considered a significant sample size reflecting the quantitative characteristic of the tree community ([36]). It is worth to point out that those tree species represent approximately 83% of the Importance Value Index (IVI) in the study area.
Higher heating value
The Higher Heating Value (HHV) of the bark of each tree species sampled was estimated according to the Brazilian regulation NBR 8633. The bark samples were chopped, ground, and then classified using 60 mesh sieves, and the retained fragments were used for composite sampling of each tree species. Those composite samples were dried out in an oven of air circulation at 103 ± 2 °C until reaching constant mass values, and subsequently used as fuel in an adiabatic calorimeter. The wood HHV has been reported by a previous study ([42]) conducted in our study area by applying the same methodology used in this analysis.
Biomass and energy potential
The dry biomass values of wood and bark were estimated for each individual tree using the model of Schumacher & Hall, which was adjusted and validated as described by Miguel et al. ([32] - Tab. 1). The adjusted equation refer to each total tree biomass using the average percentage of wood biomass (71.7%) and bark biomass (21.0%) as estimated by Miguel et al. ([32]) for individual trees from the Cerrado.
Tab. 1 - Models for determination of dry biomass ([32]). (Bmw): wood dry biomass; (Bmb): bark dry biomass; (DBH): diameter at breast height; (Ht): total height; (0.717): constant referring to the average percentage of wood biomass in a Cerrado tree; (0.210): constant referring to the average percentage of bark biomass in a Cerrado tree.
| Model | Equation |
|---|---|
| Schumacher & Hall - Wood | Bmw = 0.0123307·DBH1.79593 · Ht1.54701 · 0.717 |
| Schumacher & Hall - Bark | Bmb = 0.0123307·DBH1.79593 · Ht1.54701 · 0.210 |
The energy potential (Pe) of wood and bark of each sampled tree was separately estimated by the eqn. 1, which is based on the HHV observed in the laboratory for each individual species (eqn. 1):
where Pe is the energetic potential of the individual’s wood or bark (GJ); HHV is the higher heating value of the wood or bark of the species (kcal kg-1); Bm is the dry biomass at 0% moisture of wood or bark for each tree (kg); and 238.845.9 is a conversion constant from kcal to GJ. For the dead and non-sampled individual trees, the mean value of HHV observed in the lab test was properly considered. The total energy potential of each trees was estimated by adding the wood Pe and bark Pe.
The Pe per hectare was estimated based on the results of each sample plot, as the sum of individual Pe of each tree observed in the plot, properly extrapolated to a hectare (eqn. 2):
where Pei is the energy potential per unit area of sample plot i (GJ ha-1); Peji is the energy potential of tree j observed in a sample plot i (GJ).
Remote sensing data
A RapidEye image acquired in 2012 covering the study area was geometrically and atmospherically corrected. Subsequently, six vegetation indices were derived from the corrected image using the ERDAS Imagine 2011 software ([11]), which allowed to estimate an average vegetation index value for each sample plot used in this analysis. The RapidEye image was chosen based on its high spatial resolution (5 m) and spectral resolution, which features a red edge band in addition to visible and near infrared bands. Located between the red and near-infrared ranges (690-730 nm), the red edge band enhances RapidEye’s capabilities for vegetation aspects assessment ([3]).
We applied the following vegetation indices in this study: (i) NDVI, the normalized difference vegetation index ([39] - eqn. 3); (ii) NDRE, the red edge index of normalized difference, which is considered a NDVI variation for red edge band inclusion that increases sensitivity to chlorophyll ([14] - eqn. 4); (iii) CIGREEN, the chlorophyll index with the GREEN band, which shows high correlation with the chlorophyll content and leaf area index ([15] - eqn. 5); (iv) CIRED EDGE, the red edge index of chlorophyll, CIGREEN variation for red edge band inclusion ([15] - eqn. 6); (v) Savi, soil-adjusted vegetation index, used to correct the influence of soil exposed to vegetation ([22] - eqn. 7); and (vi) EVI2, a modified vegetation index developed as an improvement for NDVI in its sensitivity to photosynthetic activity ([24] - eqn. 8):
where NIR is the reflectance in the near infrared band, RED is the red band reflectance, RED EDGE is the reflectance of the red edge band, GREEN is the reflectance in the green band, L is the soil adjustment constant (0.5), 2.5 is the gain factor, while 2.4 and 1 are constants.
Modeling: independent variable selection
The energy potential prediction was conducted by using two independent variables: (i) the basal area (G - eqn. 9), as it is ease to be measured in the field and shows high correlation with biomass, tree growth and local production ([23]); (ii) the vegetation index retrieved from remotely sensed data. The selection of the optimum vegetation index was conducted by applying a correlation analysis among the six estimated vegetation indices and the Pe. Such analysis was preceded by the Shapiro-Wilk normality test, which indicated the correlation method to be subsequently used (parametric or non-parametric).
The basal area Gi of plot i (m2) was calculated as (eqn. 9):
where gij is the sectional area of tree j in plot i (m2), obtained as follows (eqn. 10):
where π is the constant equal to 3.14159, DBH (cm) is the diameter at breast height (1.30 m above the ground), and 40.000 is a constant.
The statistical analysis was carried out using the software RStudio ver. 1.0.143 ([40]).
Modeling: training of neural networks
To select the input and output variables for the network, we applied a supervised training of one thousand neural networks using the Intelligent Problem Solver (IPS) tool available in the software package Statistica® ver. 7.0 ([46]). The top five networks were retained at the end of processing. This tool allows for the optimization of the ANN architecture by defining the best number of neurons in the hidden layer and the best activation functions of the hidden and output layers ([52]).
We used the quasi-Newton algorithm developed by Broyden-Fletcher-Goldfarb-Shanno for processing the neural networks in the IPS (BFGS), which has great resolution power for optimization problems and predictions and is the most popular quasi-Newton method ([19]).
The trained networks use a Multilayer Perceptron (MLP) architecture with an input layer consisting of two neurons (G and VI), a hidden layer consisting of n neurons, and an output layer consisting of one neuron, the energy potential (Pe). A multilayer network was used because of its non-linear characteristics, and because it is more suitable for the resolution of real problems and situations when compared to single layer networks with linear characteristics ([4]).
The neuron is the fundamental element of the ANN structure and is responsible for processing data and information when receiving input values (G and VI) until the result of interest (Pe) is achieved. The functionality of the neurons of ANNs is estimated by combining and reproducing information based on the connections between the n possible inputs xn and the output y. For each input a weight wn is defined, which represents the brain synapses and the MLP networks store the learned knowledge ([17]). The artificial neuron is mathematically given by (eqn. 11):
where Yk is the output of the neuron, φ is the activation function, and Vk is the linear combinator of the output, given by (eqn. 12):
where Vk is the linear combiner, xm is the input m, and wm is the m-synaptic weight.
Statistical analysis
The ANN training was conducted using data from 40 out of 54 randomly selected sample plots, corresponding to 75% of the total plots. The remaining plots were excluded from the training dataset and used later to validate the results, being these sample plots within the range of 10% to 30% of the total, as suggested by Gujarati & Porter ([20]). The estimated quality of the trained neural networks was statistically analyzed by using the following criteria: correlation between the predicted and observed values (R); graphical residue analysis ([9]); and standard error of the estimate in percentage (RMSE%), calculated as (eqn. 13):
where bar{Y} is the mean of the observed values of ρe, Yi is the observed value of ρe in plot i, and Ŷi is the estimated value of ρe by ANN for plot i.
Finally, the ANN that showed the best results was submitted to the validation process using the t-test and, subsequently, an aggregate difference in percentage (AD%), a statistical value used as indicator of under- or overestimation ([30], [52]). These analyses were conducted using the software Microsoft Excel 2013® (Microsoft Corp., Redmond, CA, USA).
Results
Higher heating value
Based on the tree species sampled and measured in our study area, we estimated that the HHV of the woody material (tree stem and branches) is between 18.282 GJ ton-1 and 20.121 GJ ton-1, with an average of 19.234 GJ ton-1. The tree species showing the highest HHV were Pouteria ramiflora (20.121 GJ ton-1), Tachigali vulgaris (20.105 GJ ton-1), and Mezilaurus itauba (19.923 GJ ton-1), while those having the lowest values were Parkia platycephala (18.282 GJ ton-1), Bowdichia virgilioides (18.434 GJ ton-1), and Connarus perrottetti (18.478 GJ ton-1 - [42]).
The estimated HHVs for the tree’s bark were between 16.805 GJ ton-1 and 21.587 GJ ton-1, with an average of 19.878 GJ ton-1. The tree species showing the highest HHV values were Bowdichia virgilioides (21.587 GJ ton-1), Xylopia aromatica (21.290 GJ ton-1), and Connarus suberosus (21.232 GJ ton-1), while those having the lowest values were Miconia albicans (16.805 GJ ton-1), Miconia cuspidata (16.857 GJ ton-1), and Qualea parviflora (17.997 GJ ton-1).
Energy potential
The estimated energy potential per area unit of the cerradão (a forest-like vegetation type) were in the range of 391.39 GJ ha-1 and 2719.18 GJ ha-1, and the average energy density per hectare estimated for the studied area was 1022.66 ± 560.89 GJ ha-1.
Modeling: selection of independent variables
The Shapiro-Wilk test showed significant departures from normality for the independent variables and, consequently, we calculated the non-parametric Spearman’s correlation (Tab. 2). The results indicated that pairwise correlation coefficients among all vegetation indices (VIs) are moderate and fairly similar, while basal area (G) was highly correlated (ρ > 0.8) with the variable of interest (Pe). Despite the high similarity of correlation coefficients among the VIs, the NDVI showed the highest correlation (ρ = 0.5987) and, therefore, it was selected as the optimum VI to be used as predictor in the network training. The NDVI is widely applied and used in studies on forest environment. Notably, the lack of normality in the data did not hinder the modeling, since the ANN does not require assumptions on normality, linearity, and homoscedasticity, in contrast to more conventional regression models ([10]).
Tab. 2 - Spearman’s correlation matrix among the studied variables. (Pe): energy potential per area unit (GJ ha-1); (G): basal area (m2); (NDVI): normalized difference vegetation index; (NDRE): red edge normalized difference vegetation index; (CIgreen): clorophyll index; (CIred edge): red edge clorophyll index; (Savi): vegetation index adjusted to soil; (EVI2): enhanced vegetation index; (*): p<0.05; (**): p<0.01
| Variable | Pe | G | NDVI | NDRE | CIgreen | CIred edge | SAVI | EVI2 |
|---|---|---|---|---|---|---|---|---|
| Pe (GJ ha-1) | 1 | - | - | - | - | - | - | - |
| G (m²) | 0.8709** | 1 | - | - | - | - | - | - |
| NDVI | 0.5987** | 0.3269* | 1 | - | - | - | - | - |
| NDRE | 0.5767** | 0.2977* | 0.9852** | 1 | - | - | - | - |
| CIgreen | 0.5922** | 0.3160* | 0.9893** | 0.9813** | 1 | - | - | - |
| CIred edge | 0.5788** | 0.2996* | 0.9854** | 0.9998** | 0.9812** | 1 | - | - |
| SAVI | 0.5979** | 0.3390* | 0.9908** | 0.9719** | 0.9921** | 0.9724** | 1 | - |
| EVI2 | 0.5979** | 0.3390* | 0.9908** | 0.9719** | 0.9921** | 0.9724** | 1.0000** | 1 |
Modeling: training of neural networks
The five best performing networks among the 1000 trained ANNs showed satisfactory adjustment and accuracy statistics, correlation coefficient (R) greater than 0.95, and errors of estimates below 15%. However, based on the RMSE% and R values (Tab. 3), the neural network 3 had the best predictive capacity.
Tab. 3 - Characteristics and precision analysis of trained artificial neural networks. (ANN): artificial neural network; (MLP): Multilayer Perceptron; (Hidden Activation): hidden layer activation function; (Output Activation): output layer activation function; (RMSE): Root-Mean-Square Error; (R): correlation coefficient between observed and predicted values.
| ANN | Architecture | No. of cycles |
Hidden Activation |
Output Activation |
RMSE (GJ ha-1) |
RMSE% | R |
|---|---|---|---|---|---|---|---|
| 1 | MLP 2-8-1 | 583 | Sigmoidal | Sine | 147.91 | 14.24 | 0.96 |
| 2 | MLP 2-7-1 | 272 | Tangent | Sigmoidal | 125.96 | 12.12 | 0.97 |
| 3 | MLP 2-8-1 | 330 | Tangent | Sigmoidal | 117.05 | 11.27 | 0.98 |
| 4 | MLP 2-9-1 | 267 | Sigmoidal | Sigmoidal | 141.60 | 13.63 | 0.97 |
| 5 | MLP 2-8-1 | 10000 | Exponential | Exponential | 142.54 | 13.72 | 0.97 |
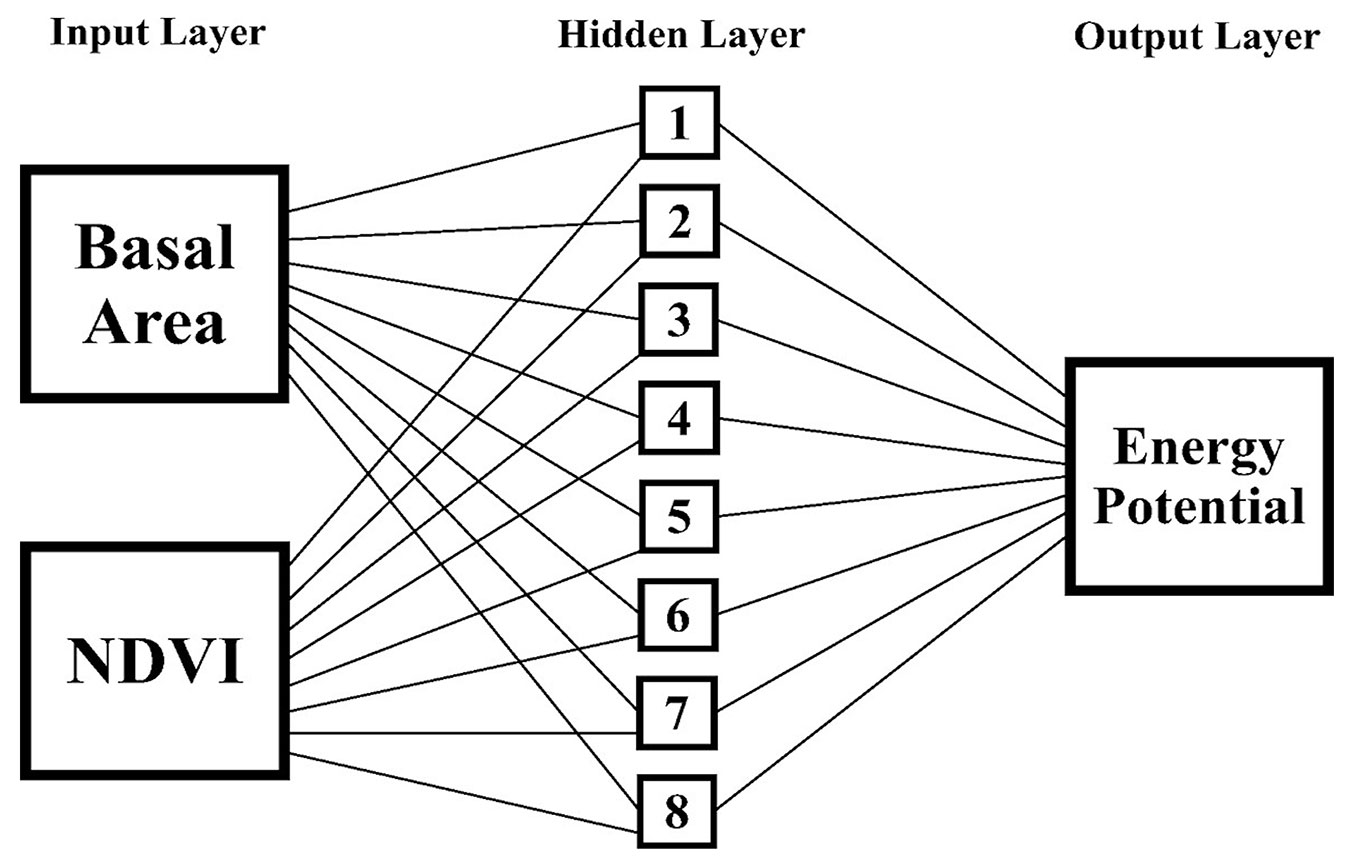
The selected network showed an acceptable residue distribution pattern (Fig. 2A), accurate predictions of the variable of interest (Fig. 2B) and, according to the histogram of error classes, it had the largest concentration of residues in the central classes of the graph, which indicates low (<20%) under- or overestimation errors (Fig. 2C). We observed that eight neurons in the hidden layer were activated by a tangent function, whereas the output layer is activated by a sigmoidal function (Fig. 3). Both the above functions have similar behavior, being suitable for biological studies and widely used in ANNs ([21], [53]).
Fig. 2 - Residuals dispersal (A), observed and predicted values (B) e distribution of error classes (C) of energy density estimation.
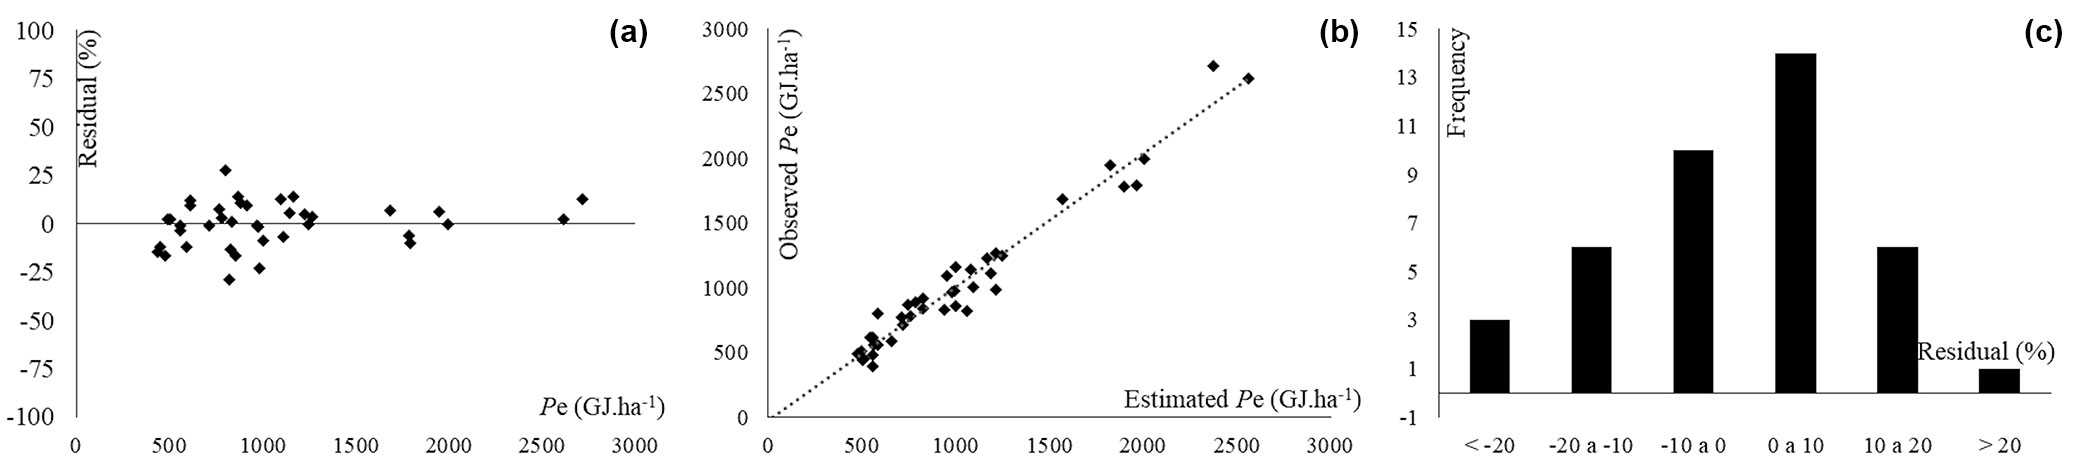
Fig. 3 - Architecture of the selected ANN for prediction of energy density per unit area in cerradão: 2-8-1.
Statistical analysis
Based on the Student’s t-test (t Stat = -0.358; t Critical two-tails = 2.160), we estimated a p-value far greater than 0.05 (p = 0.726) for the selected network, which indicates that there were no statistically significant differences between the predicted values by the neural network and the observed values from the forest inventory (validation plots). Additionally, the aggregate difference showed a slight overestimation (AD% = -4.63%), which indicates that the neural network training had a good predicting precision.
Discussion
Higher heating value and energy potential
The forest biomass HHV of the present study ([42]) was between 18.282 GJ ton-1 and 20.121 GJ ton-1, as corroborated by Quirino et al. ([38]), which estimated HHV between 16.040 GJ ton-1 and 22.291 GJ ton-1, with an average of 19.812 GJ ton-1 in a study conducted with approximately 200 tree species. In addition, studies conducted in specific formations of other forest types in the Cerrado reported HHVs ranging from 18.807 GJ ton-1 to 22.713 GJ ton-1 ([51], [29]). Tropical forests in countries such as Ecuador, Suriname, Cameroon, Côte d’Ivoire, Gabon, and Indonesia showed HHVs between 18.045 GJ ton-1 and 21.646 GJ ton-1 ([8]). Finally, European tree species showed HHVs ranging between 18.290 GJ ton-1 and 20.370 GJ ton-1 ([47], [55]). Therefore, the average HHV of wood for forest species is approximately 19.00 GJ ton-1 ± 4.00 GJ ton-1.
It is known that there is a low significant variation in HHV among forest species ([29]), which suggests a small confidence interval, as observed in the above-mentioned studies. Accordingly, we use the mean values of HHV (both wood and bark) for non-sampled tree species and dead trees ([36]).
The variation in the energetic properties of forest biomass are also possibly due to differences in physical, chemical, and anatomical properties among species, within the same species, and even within each tree. According to Zobel & Jett ([57]), the amplitude of wood variations reflects genetic and environmental factors and their interaction.
In this study, the estimated HHV for bark ranged across species from 16.805 GJ ton-1 to 21.587 GJ ton-1, which was the energy potential expected for this type of material. Tree species of the Cerrado and temperate forests in North America show similar variation of bark HHV, ranging from 17.530 GJ ton-1 to 24.024 GJ ton-1, and 17.254 GJ ton-1 to 24.242 GJ ton-1, respectively ([6], [51]). All tree species in this study showed HHV within the limits observed in the literature.
We observed that 75% of the studied tree species showed higher HHV for bark than for wood. This may be explained by the differences in the carbon content between wood and bark of individual trees (average: 20.73% vs. 25.19%, respectively - [51]), as well as by differences in the lignin content, which can reach 28% in stem wood and 36% in the bark ([48]).
The Pe value per unit area estimated in this study is approximately 25% lower than the value of 1378.54 GJ ha-1 reported by Silva & Vale ([43]) for the same area. This discrepancy may be related to the different models applied, which may have affected the results and errors in the estimation. However, it is important to mention that the Pe value per unit area represent the maximum energy potential of the area, which takes into account the dry biomass at 0% moisture (lab condition), which is not actually observable in the field. Therefore, the energy gain does not pay off the energy necessary to dry out biomass up to the 0% moisture point ([5]). Further, the presence of water in the biomass will reduce its heating values, which decreases 2 MJ kg-1 for every 10% moisture increase in the biomass ([16]).
Modeling: selection of independent variables
In this study, the estimated correlation coefficients between vegetation index and energy potential (Pe) were moderate but significant (Tab. 2). Similar results have been reported by several studies focused on the relationship among VIs and different field variables from the forest inventory, such as trunk circumference, wood volume, and biomass ([30], [56], [28]). Nonetheless, the observed correlations between the VIs and forest variables may be affected by remote sensing externalities, such as the effects of the atmosphere, radiation sources, and soil effects, as well as inherent vegetation characteristics such as architecture and conformation of the tree top and canopy ([30], [28]).
The positive and significant correlation between the VIs and Pe (Tab. 2) reflects the correlation of vegetation indices with radial stem growth and leaf area, which are directly related to the accumulation of biomass, carbon sequestration and, consequently, carbon content of the wood ([54]), while core and summer wood of the stem are characterized by a larger presence of lignin ([25]).
The presence and content of lignin is one of the determinants of vegetation reflectance for wavelengths in the infrared region ([35]), which was used to estimate most of the VIs applied in our analysis. This may have affected our results because carbon and lignin content shows a strong positive correlation with the HHV and, consequently, with the energy density of the wood ([48]).
Modeling: training of neural networks
All trained ANNs in our study showed acceptable adjustment and precision statistics, with high correlation coefficient (R ≥ 0.96) and errors of estimation below 15% (Tab. 3). More specifically, the chosen network showed very satisfactory results (R = 0.98, RMSE% = 11.27%) when considering the complexity of the studied variables and the great variability observed in the sampled area, which may increase the limit of error up to 20% acceptable.
Several studies demonstrated the superiority of neural networks against the classic regression models in the estimation of several forest attributes and proved the great potential of their use associated with remote sensing data ([30], [50]). The results obtained in this study also confirmed that the association of artificial intelligence and remote sensing techniques allowed the ANNs to accurately model the great complexity and variety of vegetation and other environmental aspects ([13]).
Neural networks have also been shown to efficiently predict wood intrinsic characteristics such as moisture content ([34]), basic wood density ([44]), higher heating value ([12]), and energy density ([52]), for which the aforementioned authors obtained better results than those reported in this study (RMSE% = 1.45%, R = 0.98, AD% = 0.14). However, those authors used basic wood density as a predictive variable. The predictive power of the ANNs was also tested for the estimation of the quality of products such as medium density fiber (MDF) boards and their different bonding strength processes ([49]).
The graphical analysis of the residues is fundamental to corroborate the results of precision statistics ([9]), as it can reveal trends in the errors that may not be detected by such statistics. Moreover, errors of interpretation could be due to the occurrence of overlapping points in the graphs. In this study the residual dispersion graph (Fig. 2A) showed adequate distribution of errors, no visible trends, compact and well distributed points along the regression line, and maximum errors limited to ± 30%. The relation between the observed and predicted values (Fig. 2B) reflects the adherence of the selected neural network to the real data. The frequency of errors was mostly concentrated between -10% and 10% (Fig. 2C), with few errors greater than ± 20%.
Statistical analysis
We found no significant difference between the observed values of energy potential and their predictions obtained by ANN, as the use of network allows for consistent adjustment and adaptation to the observed data. Therefore, we conclude that the ANN is a suitable tool for the estimation of energy potential for the phytophysiognomy under study. Similar conclusions were reported by Serpen & Gao ([41]), who stated that ANNs have a great ability to learn and extract patterns from one set of data, generalize and apply them to other data sets without losing accuracy.
Due to the variability of species, structure, canopy architecture, canopy format, and the physical and chemical characteristics of different species’ wood in the Cerrado, further studies are needed to investigate the relationships among forest field variables and VIs. Different configurations and network architectures should be tested to improve the accuracy of estimates for different biomes with different phytophysiognomies, which may strengthen and validate the ANNs application in the prediction of energy density per unit area by using remotely sensed data.
Conclusion
The cerradão showed a maximum energy potential of 1022.66 ± 560.89 GJ ha-1 at 0% moisture dry biomass
Artificial neural networks of the Multilayer Perceptron type were generated using tangential and sigmoidal activation functions and the BFGS training algorithm. They were implemented using vegetation indices derived from remote sensing data and basal area as input variables, and provided accurate and efficient estimations of the energy potential of forest biomass per area unit of cerradão.
The result of this study can help identifying areas with greater energy content, decreasing the time and cost of forest surveys aimed to estimate the energy potential (Pe). Based on our results, we conclude that it is possible to accurately estimate energy potential by using NDVI derived from remotely sensed data and the basal area as variable input of an ANNs.
Abbreviations
Pe: energy potential; BFGS: Broyden-Fletcher-Goldfarb-Shanno; Bm; Biomass; DBH: diameter at breast height; AD%: aggregate percentage difference; G: basal area; g: sectional area; Ht: total height; IPS: intelligent problem solver; VI: vegetation index; IVI: importance value index; MLP: multilayer perceptron; NATURATINS: Environmental Agency of the State of Tocantins; HHV: higher heating value; R: correlation coefficient; RMSE: standard error of estimate; ANN: artificial neural network.
Acknowledgements
Financial support was provided by the Coordination for the Improvement of Higher Education Personnel (CAPES) and the Brazilian National Council for Scientific and Technological Development (CNPq).
References
CrossRef | Gscholar
Gscholar
Gscholar
Gscholar
Gscholar
Gscholar
Gscholar
Gscholar
Gscholar
Gscholar
CrossRef | Gscholar
CrossRef | Gscholar
CrossRef | Gscholar
CrossRef | Gscholar
CrossRef | Gscholar
Gscholar
Gscholar
CrossRef | Gscholar
CrossRef | Gscholar
CrossRef | Gscholar
CrossRef | Gscholar
Gscholar
Authors’ Info
Authors’ Affiliation
Eder Pereira Miguel 0000-0001-6259-4594
Ailton Teixeira Do Vale
Eraldo Aparecido Trondoli Matricardi 0000-0002-5323-6100
Alba Valéria Rezende
Jonas Inkotte 0000-0001-6151-6658
Department of Forestry, Faculty of Technology, University of Brasília, Brasília, 70910-900 (Brazil)
Department of Forestry and Forest Technology, Federal University of Paraná, Av. Prefeito Lothário Meissner, 632 - Jardim Botnico, Curitiba, 80210-170 (Brazil)
Corresponding author
Paper Info
Citation
Carrijo JVN, Miguel EP, Teixeira Do Vale A, Matricardi EAT, Monteiro TC, Rezende AV, Inkotte J (2020). Artificial intelligence associated with satellite data in predicting energy potential in the Brazilian savanna woodland area. iForest 13: 48-55. - doi: 10.3832/ifor3209-012
Academic Editor
Carlotta Ferrara
Paper history
Received: Aug 05, 2019
Accepted: Nov 26, 2019
First online: Feb 05, 2020
Publication Date: Feb 29, 2020
Publication Time: 2.37 months
Copyright Information
© SISEF - The Italian Society of Silviculture and Forest Ecology 2020
Open Access
This article is distributed under the terms of the Creative Commons Attribution-Non Commercial 4.0 International (https://creativecommons.org/licenses/by-nc/4.0/), which permits unrestricted use, distribution, and reproduction in any medium, provided you give appropriate credit to the original author(s) and the source, provide a link to the Creative Commons license, and indicate if changes were made.

Web Metrics
Breakdown by View Type
Article Usage
Total Article Views: 44226
(from publication date up to now)
Breakdown by View Type
HTML Page Views: 36364
Abstract Page Views: 3595
PDF Downloads: 3354
Citation/Reference Downloads: 2
XML Downloads: 911
Web Metrics
Days since publication: 2368
Overall contacts: 44226
Avg. contacts per week: 130.74
Article Citations
Article citations are based on data periodically collected from the Clarivate Web of Science web site
(last update: Jul 2026)
Total number of cites (since 2020): 9
Average cites per year: 1.29
Publication Metrics
by Dimensions ©
Articles citing this article
List of the papers citing this article based on CrossRef Cited-by.
Related Contents
iForest Similar Articles
Research Articles
Analysis of factors influencing deployment of fire suppression resources in Spain using artificial neural networks
vol. 9, pp. 138-145 (online: 19 July 2015)
Research Articles
Coupling daily transpiration modelling with forest management in a semiarid pine plantation
vol. 9, pp. 38-48 (online: 06 August 2015)
Research Articles
Identification of wood from the Amazon by characteristics of Haralick and Neural Network: image segmentation and polishing of the surface
vol. 15, pp. 234-239 (online: 14 July 2022)
Research Articles
Analyzing regression models and multi-layer artificial neural network models for estimating taper and tree volume in Crimean pine forests
vol. 17, pp. 36-44 (online: 28 February 2024)
Research Articles
Local ecological niche modelling to provide suitability maps for 27 forest tree species in edge conditions
vol. 13, pp. 230-237 (online: 19 June 2020)
Research Articles
Assessing the availability of forest biomass for bioenergy by publicly available satellite imagery
vol. 11, pp. 459-468 (online: 02 July 2018)
Research Articles
Distribution factors of the epiphytic lichen Lobaria pulmonaria (L.) Hoffm. at local and regional spatial scales in the Caucasus: combining species distribution modelling and ecological niche theory
vol. 17, pp. 120-131 (online: 30 April 2024)
Research Articles
Exploring machine learning modeling approaches for biomass and carbon dioxide weight estimation in Lebanon cedar trees
vol. 17, pp. 19-28 (online: 12 February 2024)
Research Articles
Yield of forests in Ankara Regional Directory of Forestry in Turkey: comparison of regression and artificial neural network models based on statistical and biological behaviors
vol. 16, pp. 30-37 (online: 22 January 2023)
Research Articles
Spatio-temporal modelling of forest monitoring data: modelling German tree defoliation data collected between 1989 and 2015 for trend estimation and survey grid examination using GAMMs
vol. 12, pp. 338-348 (online: 05 July 2019)
iForest Database Search
Search By Author
Search By Keyword
Google Scholar Search
Citing Articles
Search By Author
Search By Keywords
PubMed Search
Search By Author
Search By Keyword


