Advantages of the point-intercept method for assessing functional diversity in semi-arid areas
iForest - Biogeosciences and Forestry, Volume 8, Issue 4, Pages 471-479 (2014)
doi: https://doi.org/10.3832/ifor1261-007
Published: Oct 31, 2014 - Copyright © 2014 SISEF
Research Articles
Collection/Special Issue: IUFRO 7.01.00 - Ilhéus (Brazil, 2013) & Beijing (China, 2014)
Forest Response to Climate Change and Air Pollution
Guest Editors: Paoletti E, Kozovitz A, Feng Z, Bytnerowicz A
Abstract
Semi-arid areas are particularly susceptible to the loss of biodiversity as a consequence of global change. Species functional traits are key drivers of functioning and resilience of ecosystems, thus monitoring of functional trait diversity is urgently needed. The assessment of functional diversity requires the quantification of species and/or their traits in the field, though there is no consensus on the best plant-sampling method to be used. The aim of this study was to compare the performance of the point-intercept (PT) method with two area-based approaches, the modified-Whittaker (MW) and Dengler (DE) methods, to assess functional diversity in semi-arid areas. The herbaceous community of a savanna-like Mediterranean woodland was surveyed at the two extremes of a regional precipitation gradient (dry to wet). Efficiency in the quantification of species/ traits, precision of cover estimates, and their effect on functional diversity metrics computed for eight functional traits were compared. Results showed that the examined methods differed in their efficiency in quantifying species/traits in both sites. With the DE method, fewer species were detected than with the MW and PT methods, which yielded similar values. The PT method had a higher precision in the quantification of both dominant and non-dominant species/traits. It also had a higher community evenness, mainly in the wet location, which allowed the analysis of a greater number of species/traits within the 80% “dominance” threshold (i.e., species representing 80% of the relative cover of community), a critical aspect of functional diversity assessments. In addition, the PT method yielded higher estimates for multi-trait functional evenness, as well as different estimates (either higher or lower than MW and DE) of single-trait community weighted means (for N-fixing ability and flowering onset), functional dispersion (for N-fixing ability and specific leaf area), and functional evenness (for height and flowering onset). In spite of the observed differences among methods in the assessment of functional diversity, the PT approach demonstrated important advantages in the non-destructive, fine-scale monitoring of semi-arid areas, where “less dominant” species may play a critical role.
Keywords
Dengler Method, Drylands, Field Plant Sampling, Functional Structure, Functional Diversity, Grassland, Modified-Whittaker, Point-intercept Method
Introduction
Semi-arid ecosystems are characterized by water scarcity and often by low soil productivity. Due to global change, they are highly vulnerable to losses of biodiversity, which underpins many critical ecosystem services ([42]). The more dramatic effects on these ecosystems are often preceded by subtle changes in relative species’ abundance and/or in the dominance of specific functional traits ([7], [43]). Even in less abundant functional groups (e.g., nitrogen-fixers), the loss of critical traits that ensure ecosystem functioning and resilience may have important consequences ([23], [52]). The detection of such changes may be a hint of significant ecosystem transitions.
Species richness has traditionally been used to assess an ecosystem’s response to environmental factors, and has been related to ecosystem multi-functionality ([31]). These relationships are largely modulated by other community attributes, such as species evenness and functional identity and divergence, which often respond more rapidly to environmental constraints than richness, and may have a strong impact on ecosystem processes ([7], [35], [32]). Functional diversity, defined as the value, range, and relative abundance of the functional traits of biological communities in a given ecosystem, was shown to be a better and more universal predictor of ecosystem vulnerability than species diversity, which does not reflect the uneven role played by species in the maintenance of ecosystem processes ([48], [12]). Functional diversity is usually assessed by the use of several metrics (e.g., community-weighted mean and functional richness, evenness, and divergence). Recent investigations have demonstrated the better predictive ability of indexes that consider species abundances rather than richness alone ([44], [35]). However, there is no consensus on the best field method for functional diversity assessment. Biomass ([40]), frequency ([9]), and most commonly cover ([18], [28]) are ordinarily used in the estimation of functional diversity. Nonetheless, cover estimates obtained by different methods may vary considerably ([1]) and may therefore affect estimates of functional diversity.
The desirable characteristics of a cover-sampling method to monitor functional diversity are primarily efficiency, precision, and reproducibility. Efficiency expresses the amount of information collected in relation to the resources devoted to achieve that information. Precision, i.e., the bias between two measurements of the same object by the same observer, is essential to detect changes in the dominance of traits and to ensure measurement repeatability. The reproducibility of a method to be used by different observers largely depends on its objectivity, which is assumed to be higher for methods less vulnerable to the observer bias. The methods most commonly used for sampling plant cover are the area-based, modified-Whittaker’s method (MW), and the point-intercept method (PT), based on transects ([22], [46], [14]). The PT method was originally proposed for grasslands ([22]), and is based on the interception of species at predefined points along a transect. It is thus less biased than area-based methods, which rely on the visual assessment of plant cover ([14]). The line-intercept method is mainly used in patchy shrublands ([10]), but it is not suitable for species (e.g., grasses, some forbs, shrubs) with narrow or lacy canopies, whose extension is hard to delineate when plant density is high ([14]). Dengler’s plot (DE - [11]) is an additional area-based, MW-derived method recently proposed, but without the MW shortcomings of non-uniform plot sizes or shapes, nestedness, and spatial arrangement of smaller subplots. Although considerable attention has been devoted to comparisons of plant-sampling approaches over the last 20 years ([16]), few studies have assessed the performance of different cover-sampling methodologies with respect to functional diversity ([1]). For instance, the use of different methods may lead to a different number of species included in the 80% “dominance” threshold - thus affecting the “amount of trait diversity” analyzed - as proposed by Garnier et al. ([19]) and Pakeman & Quested ([37]) based on the mass-ratio hypothesis ([23]).
With the aim of determining the best cover-sampling method for non-destructive fine-scale monitoring of functional diversity in semi-arid areas, we compared the above-mentioned PT, MW, and DE methods in a vegetation survey carried out in Mediterranean Holm oak (Quercus ilex L.) woodland. Specifically, wet and dry locations were selected along a regional precipitation gradient to determine potential differences in methods’ performance in relation to water scarcity. In the study area water deficit, often combined with low soil productivity, is the major limiting factor for plant establishment, thus lowering vegetation density and/or diversity. The following questions were addressed: (i) Are there differences in the efficiency of these methods in quantifying the relative abundances of species and traits? (ii) Does the efficiency of these methods vary depending on the amount of precipitation and, consequently, with changing vegetation density and/or diversity? (iii) Do the differences lead to different estimates of functional diversity metrics? The above methods were compared in terms of time-efficiency and precision of cover estimates for individual species, and main genera and families as well. Also, we assessed the effect of their use on several functional structure and diversity metrics, namely, “community-weighted mean” and functional richness, evenness, and divergence ([19], [50], [26]). We hypothesized the PT method (less biased and more reproducible) would provide more precise cover estimates than the other above-mentioned methods, allowing a better quantification of functional diversity over time by different observers and across different environmental conditions.
Material and methods
Study sites
The study was performed in a Mediterranean Holm oak (Quercus ilex L.) woodland (montado) in southwestern Portugal. This semi-natural savanna-like ecosystem has been shaped by human use since long time. Dominant soils in the study area are poor and shallow lithosols, grazing is moderate to low, and agricultural activity has ceased in recent years. The climate ranges from dry sub-humid to semi-arid, with large inter-annual variation. The plant community consists of scattered Holm oak trees and an herbaceous understory dominated by annual grasses and forbs, with shrubland patches dominated by Cistus ladanifer L.
Two sampling sites were selected approximately 100 km apart at the extremes of a regional precipitation gradient (Tab. 1). To ensure within-plot homogeneity, sampling was carried out in highly homogeneous grassland areas with no drainage lines or flooding surfaces, and included herbaceous species and sub-shrubs (chamaephytes).
Tab. 1 - Main characteristics of the sites sampled in this study. Sources: Atlas Digital do Ambiente ([4]), Nicolau ([36]).
| Characteristics | Dry | Wet |
|---|---|---|
| Almodôvar, Beja |
Montemor-o-Novo, Évora |
|
| Geographical coordinates | 37° 36′ 11.04″ N 8° 0′ 40.86″ W |
38° 29′ 42.00″ N, 8° 12′ 58.31″ W |
| Annual average precipitation 1961-1990 (mm) |
592 | 748 |
| Precipitation coefficient of variation (%) |
63 | 59 |
| Annual average temperature 1931-1960 (°C) |
17.5 | 16.0 |
| Altitude (m) | 253 | 187 |
Sampling methods
In the spring 2011, an area of approximately 1000 m2 was randomly selected at each sampling location (Tab. 1). The sampling designs depicted in Fig. 1 was superimposed as much as possible over the selected area. Data on the herbaceous community and bare soil cover were collected by two experienced botanists working together, and the survey time recorded, using the following methods (Tab. 2):
Fig. 1 - Sampling design and field overlaying schemes. (MW): modified Whittaker’s plots (light gray); (DE): Dengler’s plot (dark gray); (PT): point-intercept method (black).
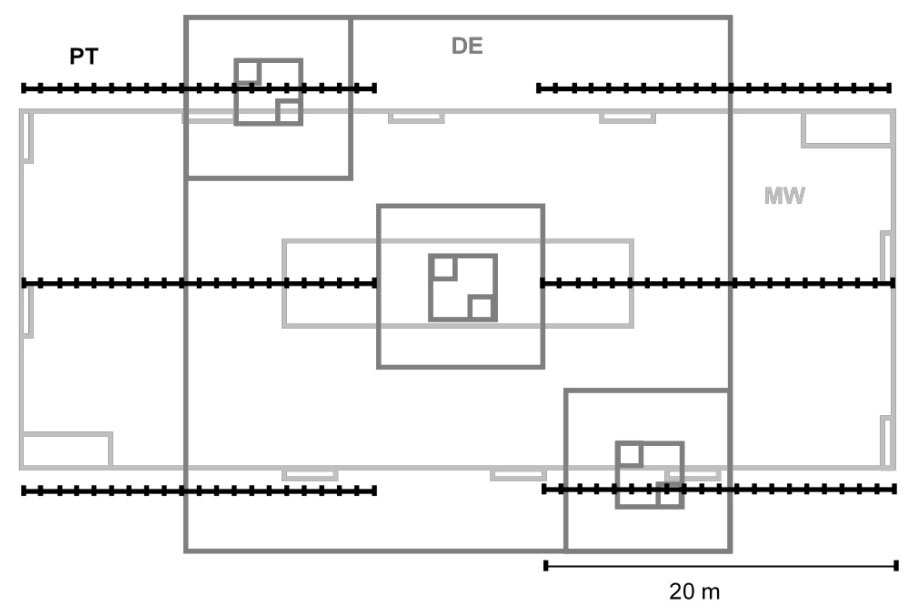
Tab. 2 - Description of the sampling design adopted for each of the three survey methods analyzed.
| Feature | Modified-Whittaker (MW) |
Dengler (DE) |
Point-intercept (PT) |
|
|---|---|---|---|---|
| Description | 20 × 50 m plot with one 100-m2, two 10-m2, and ten 1-m2 subplots | 31.6 × 31.6 m plot with three 100 m2, three 10 m2, and six 1 m2 subplots |
six 20 m transects with 41 points each spaced every 0.5 m | |
| Measurement method | Species presence in a 1000-m2 plot; cover estimates in ten 1-m2 subplots |
Species presence in a 1000-m2 plot; cover estimates in six 1-m2 subplots |
Cover and species presence measured by point interceptions |
|
| Area/ length | Cover | 10 × 1 m2 | 6 × 1 m2 | 6 × 41 = 246 points |
| Presence | 1000 m2 | 1000 m2 | 6 × 41 = 246 points | |
- the modified-Whittaker (MW) method ([46]), with consistent rectangular proportions and independent and non-overlapping subplots nested within the largest plot.
- The Dengler’s (DE) method ([11]), based on the MW method but with fully nested, square sampling units (each plot nested within the parent larger plot) and replicates of equally-distributed smaller subplots.
- The point-intercept (PT) method ([14]), using six 20-m linear transects systematically located (41 points each, spaced every 50 cm). At each point, a rod of 5mm in diameter was stuck in the ground with a 90° angle. All plant species, naked soil, lichens, litter, etc., touching the rod were recorded, though only plant data were considered in the subsequent analysis. The same species was recorded only once at each point. Species and group cover were calculated as the proportion of points intercepted per transect.
Data analysis
Overall richness, number of botanical families, and Shannon’s diversity index ([25]) were calculated for each method at each location (mean of 1-m2 subplots or transects). Pielou’s evenness index was also determined ([38]).
Precision of cover estimates
The mean and precision of the cover estimates obtained with the three methods at the two locations were compared (data from 1-m2 subplots or transects, N≥6) for species cumulatively attaining a relative cover ≥ 80%, as well as for genera cumulatively attaining a relative cover ≥ 50% and for the main botanical families, namely, Asteraceae, Fabaceae, and Poaceae (cumulatively attaining a relative cover ≥ 90%).
Functional traits
To compare functional structure and diversity estimates among methods, we selected eight traits reflecting the strategies used by species to cope with the main environmental constraints, i.e., water and soil-nutrient limitations. Binary, semi-quantitative, and quantitative traits were considered, including growth form, N-fixing ability, dispersal mode, life cycle, flowering onset and duration, vegetative height at maturity, and specific leaf area (leaf area/dry weight - Tab. 3). These traits are related to stress and disturbance avoidance/tolerance, resource acquisition and retention, and reproductive and dispersal abilities ([8]). Traits were assigned to each species (Tab. S1 in Appendix 1) based on either direct observations or literature reports ([17], [6], [39], [5]). Growth form (graminoid or other) and dispersal mode (anemochorous or other) were coded as binary traits to reflect the most relevant characteristics in the grassy plant community (Tab. 3).
Tab. 3 - Description of the functional traits considered in the study. For species trait assignments, see Tab. S1 (Appendix 1). Source: (1) direct observation/measurement; (2) Franco ([17]); (3) Porto et al. ([39]); (3) Castro ([6]); (4) Bernard-Verdier et al. ([5]).
| Type | Functional trait |
Categories/ Units |
Function | Source |
|---|---|---|---|---|
| Binary | Growth form | Graminoid | Disturbance avoidance and tolerance, decomposition rate |
1, 2 |
| No | ||||
| N-fixing ability | Yes | Resource acquisition, nutrient cycling |
1 | |
| No | ||||
| Dispersal | Anemochory | Dispersal distance | 1, 3 | |
| Other | ||||
| Semi- quantitative |
Life cycle | Annual | Stress and disturbance avoidance and tolerance |
1, 2, 3 |
| Biennial | - | |||
| Perennial | - | |||
| Onset flowering | Initial month | Reproductive strategy, stress avoidance |
2 | |
| Flowering duration |
Number of months |
2 | ||
| Quantitative | Height | cm | Light capture, competitive vigor, dispersal distance |
1 |
| Specific leaf area | mm2 mg-1 | Photosynthetic rate, growth rate, leaf life span |
3, 4 |
Functional diversity metrics
To describe functional diversity, we used the indexes proposed by Villéger et al. ([50]), who considered species within a community distributed in a multidimensional functional space. This approach has the advantage of taking into account species abundance and considering simultaneously several traits. Using these indexes, functional richness, functional evenness, and functional divergence were computed for the combined eight traits listed in Tab. 3. A detailed description of the computational method is reported by Villéger et al. ([50]). Functional richness is the amount or range of functional multidimensional space occupied by a community and is calculated based on the convex-hull volume method. Functional evenness reflects the regularity of the distribution of abundance in a trait space. A higher functional evenness is expected to correspond to a fuller occupation of a niche space by coexisting species ([33]). Functional divergence quantifies the functional dissimilarity of trait values within a community. For instance, divergence is high when the functional trait values of the most abundant species are far outside the center of the functional trait range ([50]). High functional divergence can be used as an indicator of a high degree of niche differentiation and low competition for resources ([33]). Additionally, the functional dispersion ([26]), which is closely related to Rao’s quadratic entropy, was calculated for all the traits combined. Functional dispersion is defined as the weighted mean distance in multidimensional trait space of individual species from the weighted centroid of all species, using as weight the species’ relative abundance.
We also calculated the functional dispersion and functional evenness for each trait individually, as well as the “community-weighted mean” (CWM), proposed by Garnier et al. ([19]), for the three methods at each location. CWM is defined as the average trait value in a community weighted by the relative abundances of the species carrying each value, and reflects the dominant traits in a community. All calculations were carried out using the “dbFD” function implemented in the FD package ([27]) and running under the R© environment ([41]).
Statistical analysis
Separate tests were performed for each location, since site comparison was out of the scopes of this analysis (see above). Departure from normal distribution of data was tested by Kolmogorov-Smirnov tests. Kruskall-Wallis nonparametric tests were applied to test for differences among methods in individual species cover, cover of the main genera and families, and functional structure and diversity estimates. Multiple comparisons were carried out by pairwise Wilcoxon rank sum tests using Bonferroni’s adjustments at α=0.05. To remove variation due to mean effect size ([29]), Levene’s test for homogeneity of variances was applied on log-transformed species’ cover values to detect significant differences in the precision of estimates. To compare the precision of cover estimates among methods, the coefficient of variation (CV: ratio of standard deviation to mean) was analyzed with likelihood ratio tests ([49]), thereby removing variation due to differences between mean cover values. Student’s t-test was used to compare species diversity indexes. Nonparametric and Levene’s tests were conducted using R© version 3.0.2 ([41]).
Results
The average time needed for two people to complete the vegetation survey at dry and wet locations was 125 and 170 min, respectively, ranging from 93 to 207 min, with no considerable differences among the MW, DE, and PT methods (data not shown).
The overall richness recorded with the MW method was higher than that determined using the DE method within 1000-m2 plots. By contrast, in 1-m2 plots or 20-m transects similar cumulative richness were obtained by the MW and PT methods, whereas fewer species were detected using the DE method (Tab. 4). At the wet location, the PT method revealed a higher diversity index and a higher evenness than either MW or DE methods (Tab. 4).
Tab. 4 - Overall cumulative richness, number of botanical families, Shannon’s diversity index (mean; N≥6), and evenness, recorded at dry and wet locations, for each sampling method. (MW): modified-Whittaker’s method; (DE): Dengler’s method; (PT): point-intercept method. Values with different letters are significantly different across columns after Bonferroni’s test adjusted at P<0.017 (N≥6).
| Where | Parameter | Dry | Wet | ||||
|---|---|---|---|---|---|---|---|
| MW | DE | PT | MW | DE | PT | ||
| Within a 1000-m 2 plot | Richness | 40 | 34 | - | 79 | 63 | - |
| Within 1-m2 plots or transects | Cumulative richness | 26 | 17 | 26 | 48 | 36 | 45 |
| Cumulative number of families | 5 | 3 | 6 | 11 | 12 | 13 | |
| Richness | 10 ± 2a | 11 ± 3ab | 16 ± 4b | 15 ± 3a | 14 ± 3a | 21 ± 2b | |
| Diversity | 1.4 ± 0.2 | 1.4 ± 0.2 | 1.7 ± 0.5 | 1.8 ± 0.4a | 2.1 ± 0.2a | 2.6 ± 0.1b | |
| Evenness | 0.6 ± 0.1 | 0.6 ± 0.0 | 0.6 ± 0.2 | 0.7 ± 0.1a | 0.8 ± 0.0b | 0.9 ± 0.0c | |
At the species level, whenever differences were noted, the PT method generally yielded absolute cover estimates that were significantly higher than those obtained with the other two methods at both locations (Tab. 5). The PT method also revealed a lower CV both for more and for less abundant species at the wet location (e.g., Vulpia myurus, Chamaemelum mixtum, Cerastium glomeratum) and for less abundant species at the dry location (Lolium rigidum) The number of species necessary to attain a relative cover of 80% (relative to the sum of all species cover) differed among the three methods, with consistently higher values using the PT method. At the dry location, the 80% threshold was reached with 8, 7 and 3 species using the PT, MW and DE methods, respectively. At the wet location, these differences were even higher: 17, 10, and 7 species for the PT, DE, and MW methods, respectively (Tab. 5).
Tab. 5 - Absolute mean cover (%) and coefficient of variation (CV) recorded for the most common species (attaining ≥80% relative cover) by each method (MW: modified-Whittaker; DE: Dengler; PT: point-intercept) at dry and wet locations. Values with different letters are significantly different across columns after Bonferroni’s test adjusted P<0.017 (N≥6). Lowercase letters refer to cover comparison and uppercase letters to CV comparison. Poaceae species: Agrostis pourretii, Chaetopogon fasciculatus, Gaudinia fragilis, Holcus annuus, Vulpia myuros,Lolium rigidum, Bromus lanceolatus; Asteraceae species: Chamaemelum mixtum, Carlina racemosa, Crepis vesicaria, Tolpis barbata, Leontodon taraxacoides; Fabaceae species: Ornithopus compressus, Trifolium campestre, Trifolium cernuum, Trifolium glomeratum, Trifolium striatum; Caryophyllaceae species: Cerastium glomeratum. (§): Species cumulatively attaining ≥80% of relative cover with each method are indicated.
| Family | Methods | Dry | Wet | ||||||||||
|---|---|---|---|---|---|---|---|---|---|---|---|---|---|
| MW | DE | PT | MW | DE | PT | ||||||||
| Mean | CV | Mean | CV | Mean | CV | Mean | CV | Mean | CV | Mean | CV | ||
| Poaceae | Apour | 67.0 § | 0.2 | 80.0 § | 0.2 | 76.4 § | 0.1 | 45.0 § | 0.6 | 16.7 § | 0.8 | 30.9 § | 0.6 |
| Cfasc | 7.5 § | 3.4 | 1.6 | 0.9 | 8.9 § | 1.5 | 0.1 | 5.8 | - | - | 4.5 § | 2.2 | |
| Gfrag | 6.8a§ | 0.6 | 5.7a | 0.4 | 32.5b§ | 0.4 | 5.0 § | 1.2AB | 8.8 § | 1.2A | 18.3 § | 0.3B | |
| Hannu | 14.8 § | 1.0 | 8.9 | 0.2 | 24.4 § | 0.5 | 3.7 § | 4.4A | 1.7 | 0.0B | 2.0 § | 0.9AB | |
| Vmyur | 9.0a§ | 1.3 | 28.3ab§ | 0.5 | 46.3b§ | 0.2 | 2.4 | 1.5A | 6.8 § | 2.0AB | 10.6 § | 1.0B | |
| Lrigi | 0.2 | 1.7A | 0.1 | 0.0B | 2.0 | 0.9B | 1.6 | 2.3 | 1.3 | 1.3 | 18.3 § | 1.0 | |
| Blanc | 0.2 | 1.3 | 0.1 | 0.0 | 2.8 | 1.4 | 0.4 | 1.1 | 1.2 | 3.3 | 0.4 § | 2.4 | |
| Asteraceae | Cmixt | 0.2 | 0.9 | 0.8 | 0.8 | 3.7 § | 0.9 | 13.7 § | 1.4AB | 12.0 § | 1.5A | 8.5 § | 0.5B |
| Crace | 17.6 § | 0.7 | 15.8 § | 0.5 | 26.8 § | 0.2 | - | - | - | - | - | - | |
| Cvesi | 4.9a§ | 3.2 | 1.2ab | 1.3 | 8.9b§ | 0.5 | 5.2a§ | 0.7 | 11.8ab§ | 0.7 | 22.8b§ | 0.5 | |
| Tbarb | - | - | 0.2 | 0.0 | 0.4 | 2.4 | 11.0 § | 0.8 | 18.8 § | 0.4 | 17.9 § | 0.6 | |
| Ltara | - | - | - | - | 0.4 | 2.4 | 0.2a | 6.4A | 1.9ab§ | 0.9AB | 2.8b§ | 0.4B | |
| Fabaceae | Ocomp | 0.9 | 4.8 | 0.8 | 2.5 | 3.7 | 0.9 | 1.9 | 0.8 | 4.5 § | 0.8 | 5.3 § | 1.0 |
| Tcamp | 1.7 | 2.4 | 0.6 | 0.7 | 2.4 | 1.5 | 1.1 | 2.1 | 1.2 | 1.8 | 1.2 § | 1.7 | |
| Tcern | - | - | - | - | - | - | 2.1 | 5.3 | 0.1 | - | 6.5 § | 1.5 | |
| Tglom | - | - | - | - | - | - | 5.9 § | 1.6 | 7.0 § | 1.1 | 5.3 § | 0.8 | |
| Tstri | - | - | - | - | - | - | 2.7 | 1.2 | 2.8 § | 0.8 | 4.9 § | 1.2 | |
| Caryophyl. | Cglom | - | - | - | - | - | - | 0.4 | 5.4A | 0.2 | 1.2A | 2.0 § | 0.9B |
Whenever there were differences in the cover of the main genera and botanical families, significantly higher estimates and lower CVs were obtained with the PT method than with the other methods, particularly at the dry location (Tab. 6). Cover estimates for Poaceae species were highest using the PT method, at both locations. At the dry location, the PT method yielded cover values for Asteraceae family species and for the genus Vulpia higher than those obtained with the DE and MW methods, respectively, while at the wet location estimates for Fabaceae species with PT were higher than with MW (Tab. 6). The precision of the cover estimates was significantly higher for estimates obtained with PT (lower CV) than with MW for the genera Agrostis and Vulpia at the dry location, and for Asteraceae species at both locations (Tab. 6).
Tab. 6 - Absolute mean cover (%) and coefficient of variation (CV) recorded for the main genera (attaining >50% relative cover) and families (attaining >90% relative cover) for each method (MW: modified-Whittaker; DE: Dengler; PT: point-intercept) at dry and wet locations. Values with different letters are significantly different across columns after Bonferroni’s test adjusted at P<0.017 (N≥6). Lowercase letters refer to cover comparison and uppercase letters to CV comparison.
| Taxa | Genera | Dry | Wet | ||||||||||
|---|---|---|---|---|---|---|---|---|---|---|---|---|---|
| MW | DE | PT | MW | DE | PT | ||||||||
| Mean | CV | Mean | CV | Mean | CV | Mean | CV | Mean | CV | Mean | CV | ||
| Main genus | Agrostis | 67.0 | 0.4A | 80.0 | 0.2B | 76.4 | 0.1B | 45.0 | 0.7 | 16.7 | 1.6 | 30.9 | 0.6 |
| Chamaem. | 0.3 | 1.0 | 0.8 | 1.0 | 3.7 | 0.9 | 13.7 | 1.4 | 12.0 | 1.5 | 8.5 | 0.5 | |
| Tolpis | 0.0 | - | 0.2 | 2.5 | 0.4 | 2.5 | 11.0 | 0.9 | 18.8 | 0.4 | 17.9 | 0.6 | |
| Trifolium | 1.8 | 1.8 | 0.6 | 0.8 | 2.8 | 1.4 | 15.0 | 0.7 | 12.9 | 0.9 | 25.2 | 0.6 | |
| Vulpia | 9.0a | 1.2A | 28.3ab | 0.5AB | 46.3b | 0.2B | 2.4 | 1.4 | 6.8 | 2.0 | 10.6 | 1.0 | |
| Main families | Asteraceae | 39.3ab | 0.6A | 19.4a | 0.3AB | 53.7b | 0.2B | 30.7 | 0.6A | 44.6 | 0.4AB | 54.9 | 0.3B |
| Fabaceae | 3.2 | 1.1 | 1.9 | 1.0 | 8.1 | 0.8 | 17.1a | 0.6 | 18.7ab | 0.7 | 35.0b | 0.4 | |
| Poaceae | 107.3a | 0.2 | 125.7ab | 0.2 | 207.7b | 0.1 | 59.0ab | 0.4 | 37.2a | 0.4 | 90.7b | 0.3 | |
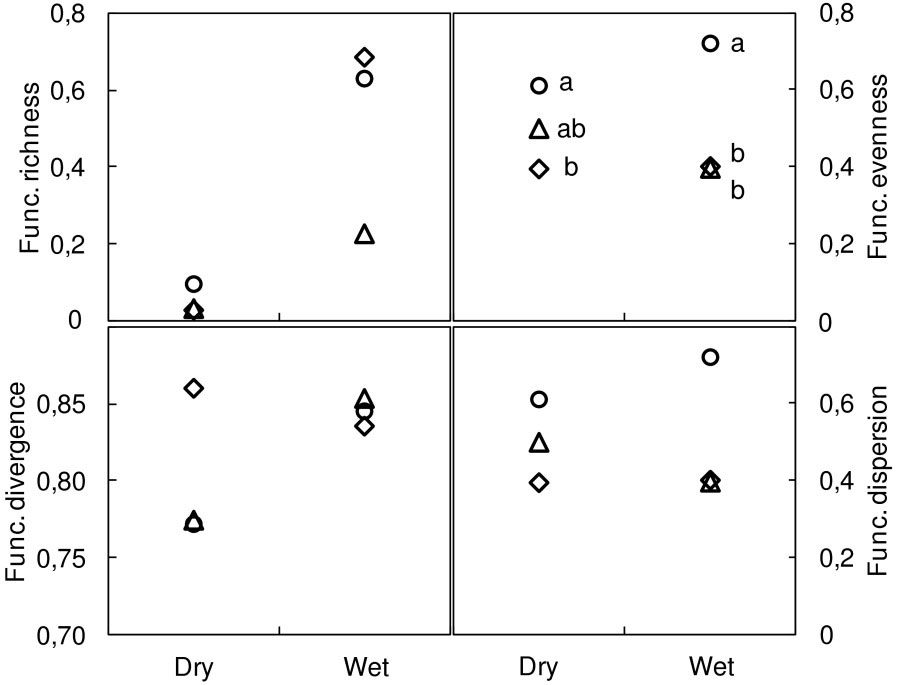
Of the functional metrics performed for the combined eight traits, only functional evenness differed significantly among the methods used, with higher estimates for the PT method (Fig. 2).
Fig. 2 - Overall functional diversity indices (8 traits) at dry and wet locations. Functional richness, functional evenness, functional divergence ([50]), and functional dispersion ([26]). Methods: modified-Whittaker (MW, diamonds); Dengler (DE, triangles); point-intercept (PT, circles). Different letters indicate significant differences between methods after Bonferroni’s test adjusted P<0.017 (N≥6).
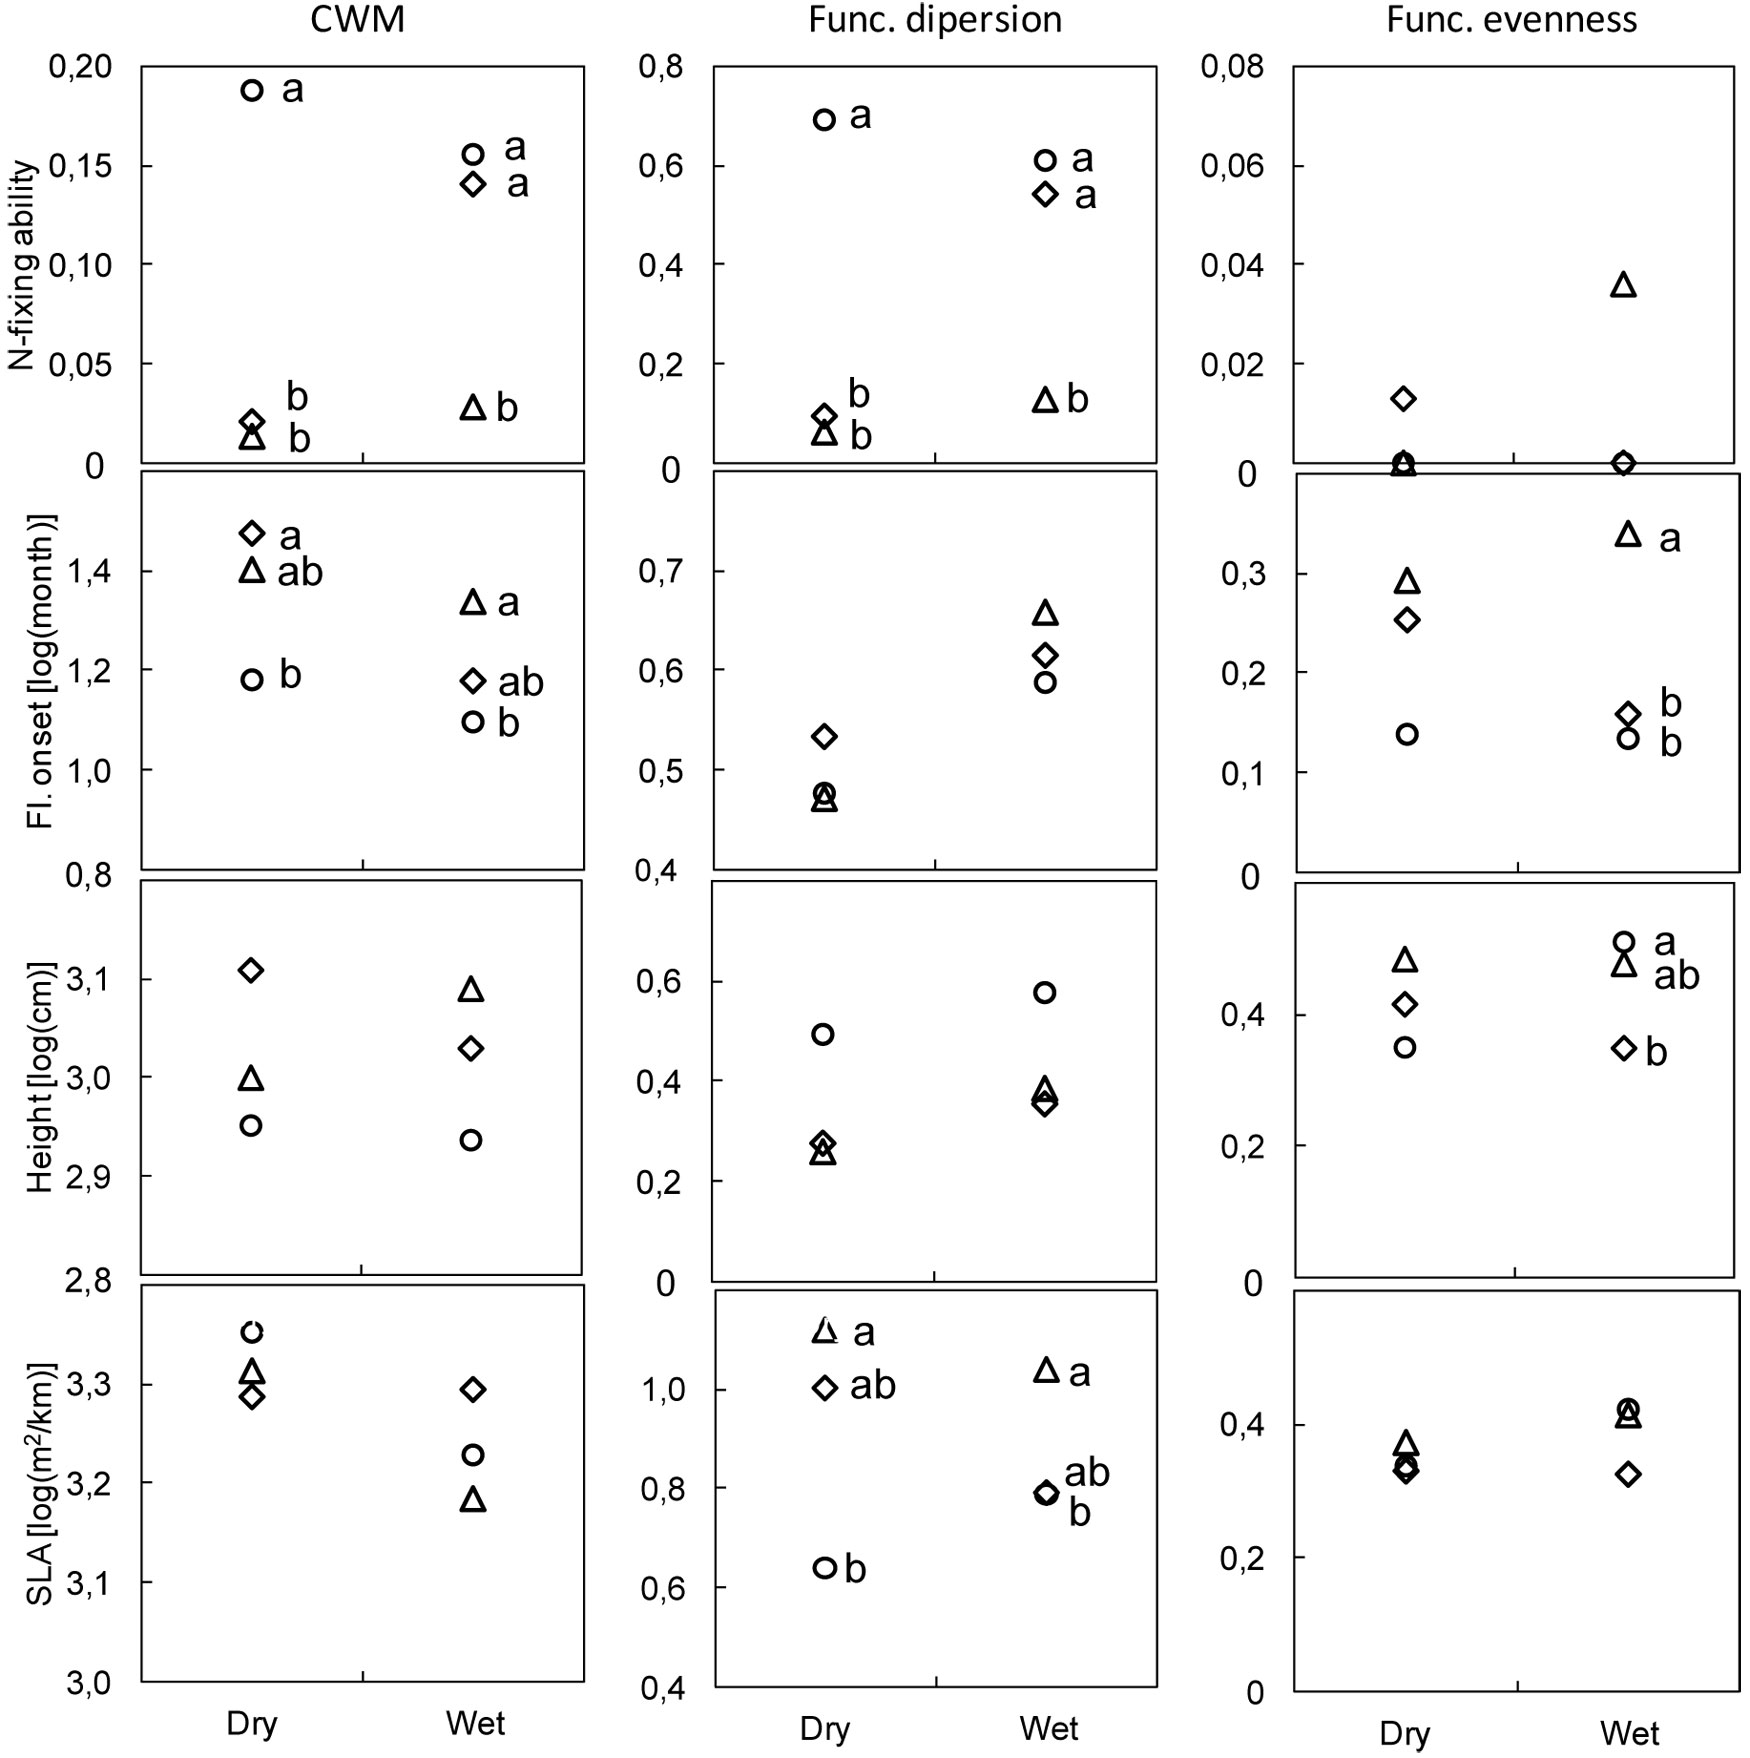
Functional metrics computed individually for the four binary, semi-quantitative, and quantitative traits are shown in Fig. 3. The results for the other four traits are provided in Fig. S1 (Appendix 1). The DE method resulted in lower CWM values for N-fixing ability at both locations and in higher estimates of functional dispersion than those provided by either PT or MW at the dry location (Fig. 3). The CWM of flowering onset was lower using PT than DE at both locations, whereas functional evenness estimates with DE were higher than those obtained with either other methods at the wet location. Height functional evenness was higher with PT than with DE at the wet location, whereas the functional dispersion of specific leaf area differed with each of the three methods at both dry (DE>PT) and wet (DE>MW) locations (Fig. 3).
Fig. 3 - Community weighted mean (CWM), functional evenness, and functional dispersion in dry and wet locations. Traits: N-fixing ability (binary), onset of flowering (semi-quantitative), and height and specific leaf area (SLA - quantitative). Methods: modified-Whittaker (MW, diamonds); Dengler (DE, triangles); point-intercept (PT, circles). Different letters indicate significant differences between methods after Bonferroni’s test adjusted at P<0.017 (N≥6).
Discussion
In this study, three methods commonly used in the field to quantify species/traits showed remarkable differences of efficiency, leading to divergent estimates of the “community-weighted” functional diversity metrics, regardless of the trait values themselves. This “field sampling-method effect” on functional diversity estimates has relevance in plant functional ecology, especially when the aim of the study implies a fine-scale survey. Indeed, a number of studies relied on plant abundance measured in the field to weight trait importance in the computation of functional metrics, while collecting at least some of the species trait values from bibliographic sources or databases ([15], [20]). Our results showed that the field method chosen in the survey affects community weighted means, functional evenness, and functional divergence. All such parameters are required to achieve a reliable assessment of the functional structure and diversity of plant communities.
Although no differences among the three methods were found in the time needed for the survey, the observed differences in their efficiency in quantifying the species/traits abundance point out important advantages of the PT method in non-destructive fine-scale monitoring of plant functional diversity in semi-arid areas. Firstly, this method allowed the detection of as many species as the MW method and of a higher number than the DE method. It also provided a higher precision in cover estimates and, because of higher community evenness, more species/traits could be analyzed within the advocated 80% “dominance” threshold (species representing 80% of the relative cover of the community). Therefore, the PT method offers a cost-effective way to reduce “sampling error”, by reducing the subjectivity in species cover estimates and improving functional diversity estimates. Secondly, this method is less vulnerable to the operator’s bias and thus likely more reproducible when used by different operators ([14]). It is worth to stress that we did not aim at testing the effect of different observers, e.g., through ring tests to assess the “observer error” ([21]). Instead, we assumed a priori that the reproducibility of the PT method is higher (lower observer-bias) when used by experienced botanists familiar with the local flora.
The PT method has proven to be more efficient across contrasting environments (different precipitation regimes) and showed consistency even across different plant density or diversity. These features are critical for a precise and reproducible assessment of changes in functional diversity of plant community in response to environmental changes. In this study, the PT method outperformed other methods commonly used for fine-scale monitoring of plant functional diversity in the understory of Holm-oak woodlands. Similarly, we hypothesized its superior performances also in vegetation surveys of semi-arid areas characterized by low tree density and/or dominated by grasslands and/or shrubland patches. However, further analyses are needed before extending our results to other ecosystems like boreal or temperate forests.
Species quantification and richness
With the PT and MW methods, a higher number of species was quantified than with the DE method, i.e., PT and MW performed better in species/traits quantification. This is a critical step in functional diversity assessments. Even though our study was not aimed at testing methods to assess species richness per se, we found that using the two area-based methods considered (MW and DE) a higher overall number of species was detected, as a consequence of the inclusion of an extra 1000-m2 plot for the detection of “new” species presence. However, if species richness is an index of interest in the survey, the PT method could be easily complemented with a search for new species in a predefined surrounding area with little extra time.
Precision of cover estimates
The PT method adopted in this study provided plant cover estimates more precise than those obtained with the other methods tested. At the dry location, major differences were found for main genera and families. Cover estimates by the PT method were shown to be particularly sensitive to plant architecture and leaf morphology of understory plants ([1]). However, such method performed similarly or even better than others in monitoring groups of species with distinct morphology (e.g., Asteraceae), ensuring at the same time similar or higher precision in the assessment of cover by species group as well. At the wet location, precision differences concerned mainly individual species’ estimates, either dominant or not, with a consistent advantage of the PT method in the case of varying plant density or diversity. In accordance with our results, other authors using the PT method in herbaceous communities, have reported a precision similar or higher than that obtained by cover visual estimates ([51]). Precision in plant abundance quantification is an essential prerequisite of a reproducible method suitable to fine-scale monitoring of functional diversity of herbaceous communities, where changes in species abundance may be hard to detect (e.g., dense/rich communities).
Evenness and quantification of less abundant species
In the wet location analyzed, community evenness estimates obtained with the PT method were higher than those resulted from the application of the other methods, with small differences in relative cover from more to less abundant species. Likely, such differences were underlying the divergence of functional evenness estimates among the three methods considered. Community evenness plays an important role in ecosystem processes and multifunctionality ([24], [31]). Functional evenness reflects the distribution of traits in a community and thus the degree of niche space occupation by coexisting species ([33]). It often responds more rapidly to environmental changes than species richness and may have a rapid and strong impact on ecosystem functions ([7], [35]). Area-based methods implying visual cover estimates (MW and DE) tend to overestimate the dominant and more conspicuous species and underestimate those less abundant ([51]), with accordingly lower evenness. This was the case at the wet location, where seven species attained 80% relative cover according to the MW method, while seventeen species were needed to achieve the same threshold with the PT method. It is important to take into account the role of less common species in functional diversity assessments. A threshold of 80% (in terms of species number or their cover) has been advocated as representative in the description of functional composition ([19], [37]). Such threshold is based on the assumption that dominant species are functionally more important because of their higher abundance, following the mass-ratio hypothesis ([23]). Thus, since the adoption of the PT method included more species (and more functional traits) within the above threshold, it follows that PT performed better for purposes of assessing functional diversity. Moreover, the role of less common species in drought-prone ecosystems may be critical, both over the short- and the long-term. In dry-lands, inter-annual climatic fluctuations are high, forcing species to cope with extreme values of the environmental factors. Consequently, they often exhibit a dynamic turnover involving shifts in the abundance of response groups when a rainy year is followed by a severely dry one, especially in communities dominated by annual species ([3], [2], [13]). Therefore, in contrast to more mesic areas, less abundant species in dry-lands are likely to play a major role in the ecosystem resilience, as a consequence of their capability of exploiting outstanding environmental conditions, as proposed by the complementarity hypothesis ([23], [52], [30]). This argument supports the relative importance of less abundant species and thus their inclusion in functional diversity assessments. In a study on grasslands by McIntyre & Lavorel ([34]), the range of different traits exhibited by forbs and smaller grasses contributed to a varying environmental response, in contrast to local dominant grasses. In our study, this seemed to be the case of N-fixing species. Despite the fact that their relative cover did not exceed 3.0 % and 17.6 % at the dry and wet locations, respectively, they represented a highly relevant functional feature of drylands, usually characterized by soil N shortage ([45]). Furthermore, dry-lands are highly susceptible to land degradation and desertification ([42]). These processes most likely depend on a critical threshold beyond which drastic alterations occur, preceded by more subtle functional changes in communities ([42], [43]). It is therefore important to monitor such changes, as they represent early-warning indicators and allow a timely adoption of counteracting prevention activities.
Cover estimates
Absolute cover estimates were generally higher with the PT method than with either other methods, as previously reported in the literature ([1]). This effect has been attributed to the error due to the diameter of the rod used in sampling, which should be as thin as possible ([14]). However, this is not a problem when the aim is to monitor changes through time and it should not affect the computation of functional metrics using the relative cover of species/traits.
Conclusions
In this study, we demonstrated that the PT, MW, and DE methods differed in terms of efficiency in the assessment of species/traits relative abundances, thus affecting estimates of functional diversity. The PT method had important advantages over the others with respect to fine-scale monitoring of plant functional diversity in the mainly grassy understory of Holm oak woodlands, and likely in semi-arid areas in general as well. The adoption of the PT method allowed the detection of as many species as the MW method and of more species than the DE method, with a higher precision of cover estimates both for groups of species and at the single-species level. Moreover, due to higher community evenness, it allowed the analysis of a greater number of species/traits within the advocated 80% “dominance” threshold. Precision of the estimates is a prerequisite of functional diversity surveys, in that they must include not only dominant species and traits, because of their larger contribution to ecosystem functionality, but also less common ones, given their decisive role in the resilience and function of semi-arid ecosystems, thereby integrating the mass ratio and complementarity hypotheses ([30]). The advantages of the PT method were proven across contrasting environmental conditions. In addition, it should be less biased than those based on visual estimation and thus more reproducible when used by different operators.
Acknowledgements
Authors’ contributions: AN, ST, OC, and CB conceived of and designed the experiments, AN and ST performed the experiments, AN and CB analyzed the data, AN, PP, OC, and CB wrote the manuscript. This research was funded through the FCT-MEC DesertWarning project (PTDC/AAC-CLI/10 4913/2008) and through SFRH/BPD/754 25/2010 and SFRH/BD/51407/2011 fellowships.
References
Gscholar
CrossRef | Gscholar
Gscholar
Gscholar
Gscholar
CrossRef | Gscholar
Gscholar
Gscholar
CrossRef | Gscholar
Online | Gscholar
Authors’ Info
Authors’ Affiliation
Susana Tápia
Pedro Pinho
Otília Correia
Cristina Branquinho
Centro de Biologia Ambiental, Faculdade de Ciências, Universidade de Lisboa, Campo Grande, C2, Piso 5, 1749-016 Lisboa (Portugal)
Departamento de Biologia e CESAM-Centre for Environmental and Marine Studies, Universidade de Aveiro, Campus Universitário de Santiago, 3810-193 Aveiro (Portugal)
CERENA- Centro de Recursos Naturais e Ambiente, Universidade de Lisboa, Instituto Superior Técnico, Av. Rovisco Pais, 1049-001 Lisboa (Portugal)
Corresponding author
Paper Info
Citation
Nunes A, Tápia S, Pinho P, Correia O, Branquinho C (2014). Advantages of the point-intercept method for assessing functional diversity in semi-arid areas. iForest 8: 471-479. - doi: 10.3832/ifor1261-007
Academic Editor
Elena Paoletti
Paper history
Received: Feb 02, 2014
Accepted: Jul 16, 2014
First online: Oct 31, 2014
Publication Date: Aug 02, 2015
Publication Time: 3.57 months
Copyright Information
© SISEF - The Italian Society of Silviculture and Forest Ecology 2014
Open Access
This article is distributed under the terms of the Creative Commons Attribution-Non Commercial 4.0 International (https://creativecommons.org/licenses/by-nc/4.0/), which permits unrestricted use, distribution, and reproduction in any medium, provided you give appropriate credit to the original author(s) and the source, provide a link to the Creative Commons license, and indicate if changes were made.

Web Metrics
Breakdown by View Type
Article Usage
Total Article Views: 62002
(from publication date up to now)
Breakdown by View Type
HTML Page Views: 51229
Abstract Page Views: 3745
PDF Downloads: 5481
Citation/Reference Downloads: 45
XML Downloads: 1502
Web Metrics
Days since publication: 4253
Overall contacts: 62002
Avg. contacts per week: 102.05
Article Citations
Article citations are based on data periodically collected from the Clarivate Web of Science web site
(last update: Mar 2025)
Total number of cites (since 2015): 12
Average cites per year: 1.09
Publication Metrics
by Dimensions ©
Articles citing this article
List of the papers citing this article based on CrossRef Cited-by.
Related Contents
iForest Similar Articles
Research Articles
Performance assessment of two plotless sampling methods for density estimation applied to some Alpine forests of northeastern Italy
vol. 16, pp. 385-391 (online: 19 December 2023)
Research Articles
Estimating changes in soil organic carbon storage due to land use changes using a modified calculation method
vol. 8, pp. 45-52 (online: 17 June 2014)
Research Articles
Functional turnover from lowland to montane forests: evidence from the Hyrcanian forest in northern Iran
vol. 8, pp. 359-367 (online: 16 September 2014)
Research Articles
Towards a functional phytosociology: the functional ecology of woody diagnostic species and their vegetation classes in Northern Italy
vol. 14, pp. 522-530 (online: 22 November 2021)
Research Articles
Post-fire recovery of the plant community in Pinus brutia forests: active vs. indirect restoration techniques after salvage logging
vol. 11, pp. 635-642 (online: 04 October 2018)
Research Articles
Relationships between overstory and understory structure and diversity in semi-natural mixed floodplain forests at Bosco Fontana (Italy)
vol. 9, pp. 919-926 (online: 21 August 2016)
Research Articles
Contribution of environmental variability and ecosystem functional changes to interannual variability of carbon and water fluxes in a subtropical coniferous plantation
vol. 9, pp. 452-460 (online: 25 January 2016)
Research Articles
Evaluation of methods to improve the direct estimation of standing trees volume
vol. 18, pp. 87-92 (online: 17 April 2025)
Research Articles
Red wood ants shape epiphytic lichen assemblages in montane silver fir forests
vol. 15, pp. 71-76 (online: 22 February 2022)
Research Articles
Tropical seedling performance under drought: a functional trait approach for species selection in restoration
vol. 19, pp. 9-17 (online: 10 January 2026)
iForest Database Search
Search By Author
Search By Keyword
Google Scholar Search
Citing Articles
Search By Author
Search By Keywords
PubMed Search
Search By Author
Search By Keyword


