Tree biomass models for the entire production cycle of Quercus suber
iForest - Biogeosciences and Forestry, Volume 18, Issue 1, Pages 38-44 (2025)
doi: https://doi.org/10.3832/ifor4604-018
Published: Feb 28, 2025 - Copyright © 2025 SISEF
Research Articles
Abstract
The demand for accurate biomass estimates is more pressing than ever. Cork oak (Quercus suber) presents particular challenges for biomass estimation due to variability among trees, even within the same stand. One issue is that small cork oak trees in the understory are often overlooked, leading to an underestimation of stand biomass. Characterising stand biomass is a significant concern for process-based modelling, as inaccuracies in observed values can result in further output uncertainty. Moreover, the production and management of cork oak are primarily focused on cork extraction, which alters several tree biomass components, particularly after the first debarking. This study provides a set of models for estimating cork oak biomass (total and per-tree component) across all stand layers. The models were developed using seemingly unrelated regression, ensuring additivity between biomass compartments. The separation of the cork oak life cycle reflects tree development and the production cycle of interest for managers, resulting in three sub-groups (juvenile trees, adult virgin trees, and debarked trees), along with four compartments (leaves, branches, stem, and aboveground). The juvenile model requires only total tree height, while the virgin model requires diameter at breast height and total tree height. No other tree variable was tested in the juvenile model, and only the number of first-order main branches was tested in the virgin model, but the associated parameter was not significantly different from zero. Two alternative models were developed for the debarked trees: a simple model that offers an alternative when only diameter under bark is available (predictive modelling efficiency, EF = 0.35 for branches and EF = 0.89 for total aboveground biomass); and a complex model that incorporates crown and stand variables, demonstrating better performance for branches and stem when parameters depend on the crown length and stand basal area, respectively (EF = 0.63 for branches and EF = 0.90 for total aboveground biomass). Our results underscore the need to consider crown and stand variables in the later stages of development.
Keywords
Introduction
Forest land has recently emerged as a strategy to achieve carbon neutrality, often through the afforestation and reforestation of production species ([15], [33], [35]). However, the pace of climate change may exceed the tree growth rate, hindering the adaptation of forests to new climatic conditions ([17], [36]). This context heightens the need for accurate and adequate characterisation of forest stand biomass, which is essential for several purposes related to climate change mitigation strategies, such as accounting for carbon sequestration ([34]), estimating forest fuel stock ([5]), and calibrating and validating process-based models ([20]).
The Mediterranean region represents the largest productive area of cork oak forests ([40]) and is also highly susceptible to drought and wildfires ([12], [19], [38]). While drought is not the only factor negatively affecting cork oak growth ([4], [8]), it is arguably the most significant ([32]). Therefore, the need for reliable and up-to-date models that can quantify tree biomass vis-a-vis current mitigation strategies is imperative. The most common model used to estimate individual tree biomass, whether total or per tree component, is the allometric model, which enables accurate estimates of stand biomass through aggregation ([24]). This modelling approach typically requires tree diameter at breast height (d) along with total tree height (h) and is developed for adult trees (d ≥ 7.5 cm - [39], [42]). Crown and/or stand variables are sometimes included to enhance model performance ([2], [10]). However, existing models do not address very young trees, which represent the next layer of stand development.
Young cork oak trees can be categorised into two groups, both presenting practical problems that contribute to their exclusion from biomass modelling. According to the Portuguese National Forest Inventory (NFI), young trees are classified as regeneration if h < 1.3 m and as smaller trees if h ≥ 1.3 m but d < 7.5 cm ([14]). This implies that for young trees classified as regeneration, it is impossible to obtain a measure of d at the standard height of 1.3 m. Additionally, it might be challenging or unfeasible for young trees classified as smaller trees to take d measurements before the tree reaches h = 2 to 3 m, as young trees often exhibit a very dense crown shape with more than one main branch. Smaller trees may ultimately not be of interest for management decisions regarding even-aged stands other than for pruning or thinning ([6], [31]). Nevertheless, they are crucial for stand regeneration and for managing complex stands, such as uneven-aged or mixed-species forests. However, research focused on cork oak forest regeneration often tends to be qualitative ([21]) or primarily aimed at seedling mortality ([7], [13]), despite the pressing need for quantitative models.
Regional models to estimate cork oak biomass of adult trees from diameter under bark at breast height (du) and h were recently developed for the entire area of cork oak distribution ([16]). However, to ensure compatibility among the various datasets used in that study, it was not possible to test some variables that might be relevant for cork oak biomass estimation, namely vertical debarking height (hdf), stem height (hs), stem bifurcation height (hbif), crown length (cl), number of first-order main branches (nbr), number of first-order main branches that have been debarked (nbru), number of trees, and basal area per hectare (N and G, respectively). Several other models ([27], [29], [30]) exist, but all rely on du, a variable not easily measured in young non-debarked trees. The variable du can be directly measured only after the first debarking - a management operation regulated by legislation that can occur only when the tree circumference ≥ 70 cm - or calculated if cork thickness is known, which is also challenging to measure. To the authors’ knowledge, currently no model is available to estimate tree biomass in the younger layers of the stand. The first objective of this study is to provide allometric models to estimate cork oak tree biomass, both total and per tree component, applicable to the entire production cycle of cork oak, namely: (i) a model for young trees as a function of h; (ii) a model for virgin trees as a function of d and h; (iii) two models for debarked trees - a simple and a complex version - as a function of du only and du as well as h, respectively.
These models entail extensive sampling of tree biomass across a wide range of stand conditions and characteristics, achieved by integrating datasets from various projects. The second objective is to evaluate whether the performance of these models improves when additional tree/stand variables are included.
Materials and methods
Data for this study were obtained from the destructive sampling of 236 trees spanning a wide range of ages (7 to 106 years), with 59 trees classified as regeneration, 96 smaller trees, and 81 adult trees, following NFI standards. The field procedure for harvesting biomass is described elsewhere ([41], [28]). However, the dataset was used with different groupings from the NFI standards to enhance model fit and continuity by overlapping groups. The groupings (hereafter referred to as life stages) are illustrated in Fig. 1a, Fig. 1b, Fig. 1c, and Fig. 1d, considering tree development and the production cycle as follows: (i) Juvenile - trees with h < 3 m (n = 204, comprising 59 trees that are regeneration, 96 smaller trees, and 49 adult un-debarked trees); (ii) Virgin - trees with d measured over the virgin cork (n = 151, consisting of 82 smaller and 69 adult un-debarked trees); (iii) Debarked - trees with du measured and debarked at least once (n = 22).
Fig. 1 - The four biomass compartments as a function of total tree height. Each panel represents one biomass compartment (kg) versus total tree height (m): (a) leaves, (b) branches, (c) stem, and (d) aboveground. The colours distinguish the data into the three life stages: juvenile (green dots), virgin (orange dots), and debarked (purple dots).
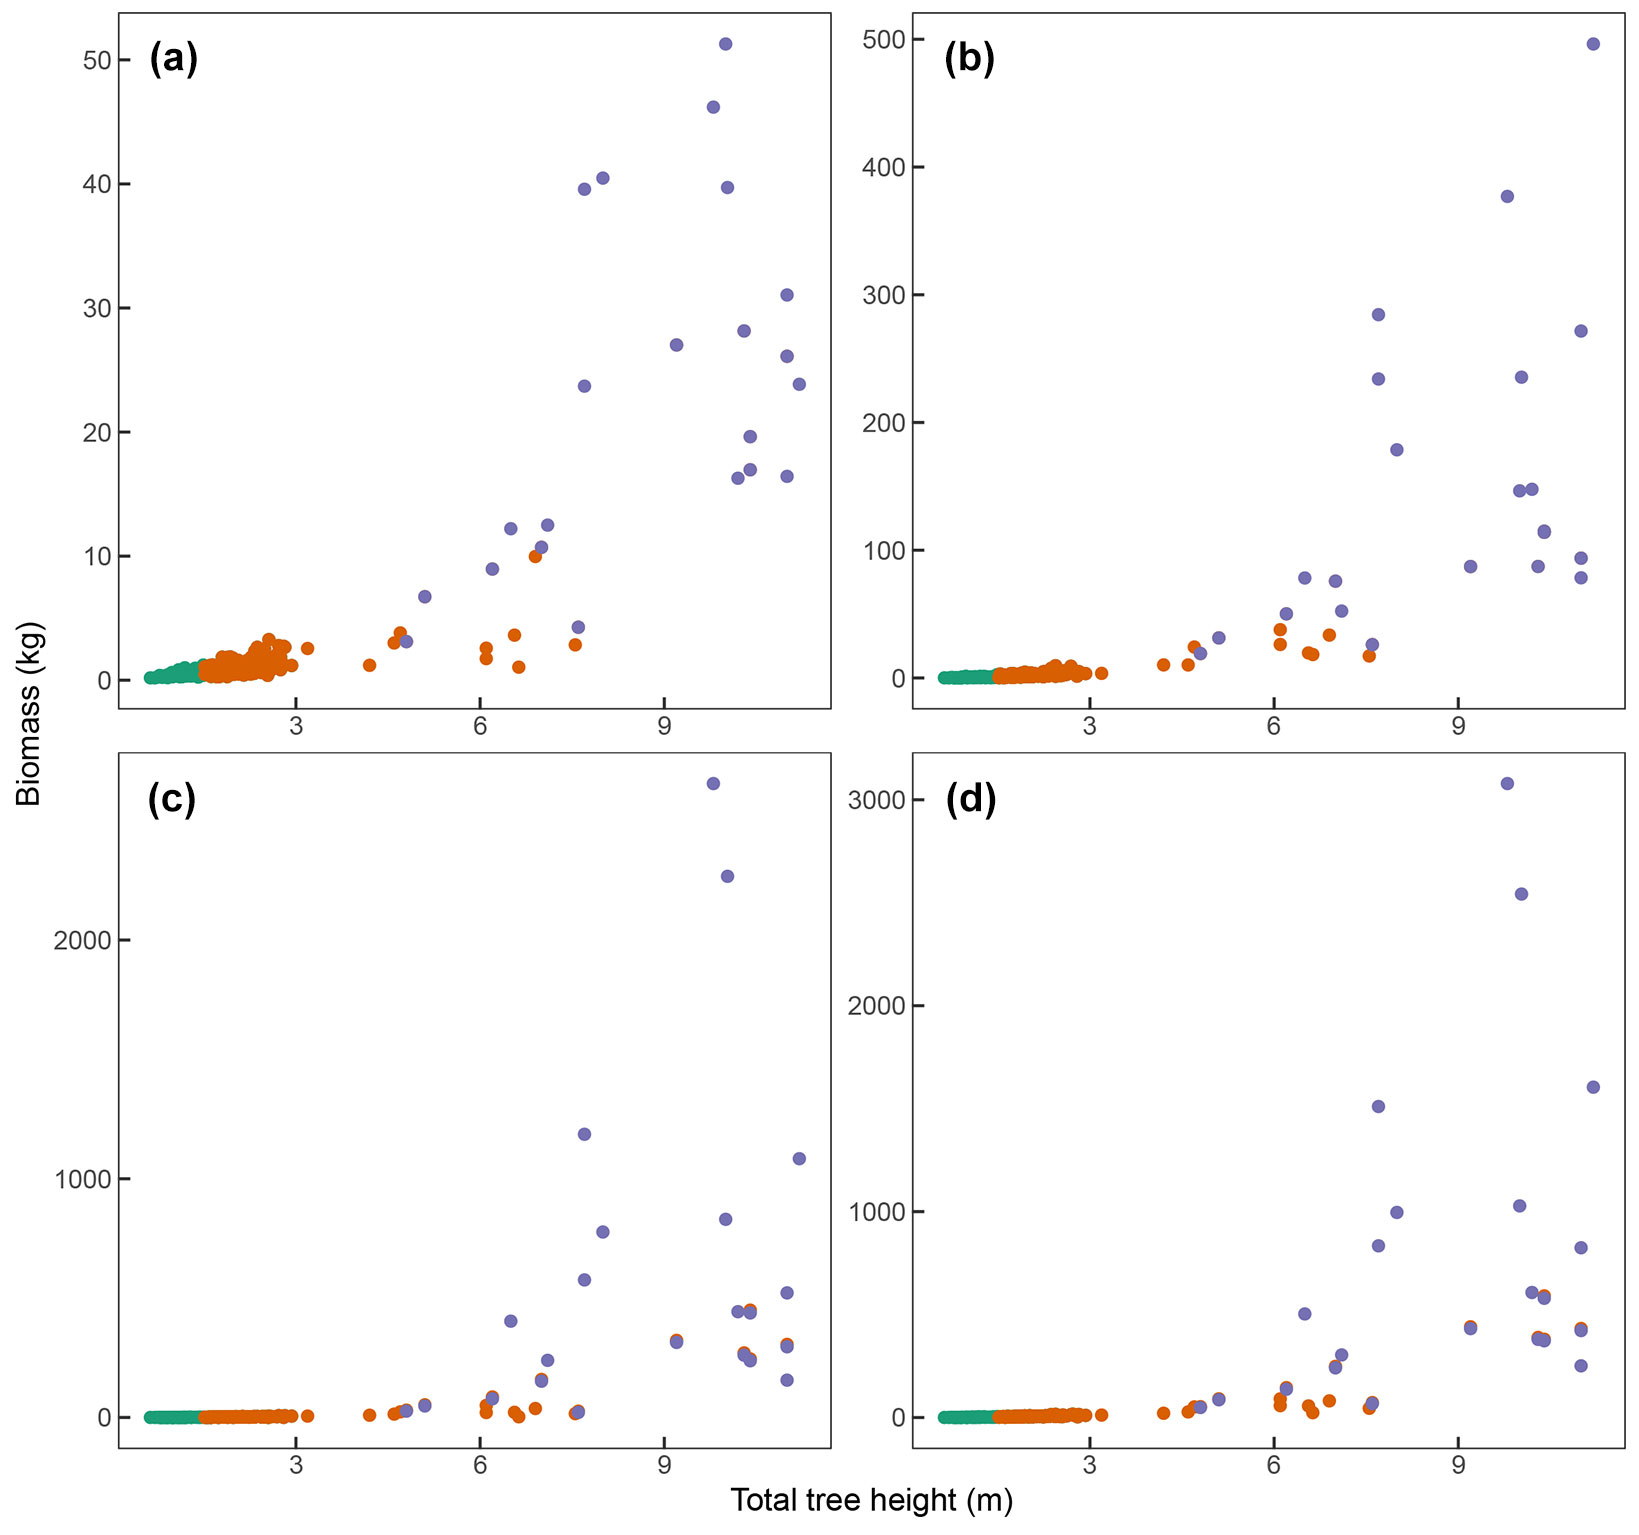
The debarked stage includes only 22 adult debarked trees, ten of which were selected from the adult virgin trees as they met the legal circumference for cork debarking. The debarking operation was simulated using equations to estimate cork biomass ([30]). This approach was imposed by current legislation that prohibits the harvest of cork oak trees, complicating the sampling of adult trees.
The biomass was aggregated into four compartments common to all life stages: leaves (wl); branches with d ≤ 7.5 cm (wbr), stem (ws), including all branches with d > 7.5 cm, namely the main and secondary branches; and total aboveground biomass (wa). Branches and stem included some virgin cork biomass that was considered. Basic descriptive statistics of the tree variables are provided in Tab. 1.
Tab. 1 - Basic descriptive statistics of the tree variables. (d): diameter at breast height; (du): diameter at breast height under bark; (h): total height; (cl): crown length; (wl): leaf biomass; (wbr): branch biomass; (ws): stem biomass; (wa): aboveground biomass. Descriptive statistics - (n): number of trees; (Min): minimum; (Max): maximum; (SD): standard deviation.
| Tree variable | n | Min | Median | Mean | Max | SD |
|---|---|---|---|---|---|---|
| d (cm) | 163 | 3.80 | 7.45 | 11.52 | 63.25 | 11.18 |
| du (cm) | 31 | 6.90 | 20.95 | 24.28 | 58.75 | 14.41 |
| h (m) | 236 | 0.63 | 1.87 | 2.55 | 11.20 | 2.30 |
| cl (m) | 31 | 3.00 | 5.37 | 5.49 | 9.80 | 1.64 |
| wl (kg) | 236 | 0.19 | 0.73 | 2.99 | 51.28 | 7.69 |
| wbr (kg) | 236 | 0.06 | 1.44 | 16.22 | 496.34 | 56.42 |
| ws (kg) | 236 | 0.004 | 1.47 | 57.39 | 2655.50 | 267.98 |
| wa (kg) | 236 | 0.34 | 3.93 | 76.94 | 3078.68 | 324.24 |
Regarding stand characteristics, 31 of the largest adult trees were harvested across a wide range of stand densities (N = 39-304 trees ha-1, G = 0.20 - 10.13 m2 ha-1) in four separate stands in central Portugal, the primary area of cork production. The remaining trees - the smallest - were harvested in the context of provenance trials across central and northwest Portugal in stands with a planting density between 540 and 556 trees ha-1 ([41]).
The model fitting procedure was consistent across the three life stages, each associated with a specific equation form. It started with fitting individual allometric models for each compartment (Cbio) using ordinary least squares, and testing the significance of expressing the parameters as a function of tree and stand variables. The equation forms and variables can be described as follows (eqn. 1 to eqn. 3):
where eqn. 1, eqn. 2, and eqn. 3 correspond to the juvenile, virgin, and debarked stages, respectively; d is the diameter at breast height, du is the diameter at breast height under bark, h is the total tree height, y represents tree variables related to height, and z includes other tree or stand variables, such as nbr, the number of first-order main branches. The coefficients b0, b1, c0, and c1 are part of the expression used for the allometric exponents and a is the allometric scalar.
Variables in the exponents of the allometric models associated with parameter estimates not significantly different from zero (α = 0.05) were discarded. The selected individual allometric models for each compartment were then simultaneously fitted as an additive system of equations, i.e., with total aboveground biomass equal to the sum of leaves, branches, and stem, using seemingly unrelated regression. The continuity between the equations for the tree life stages was verified graphically by comparing predicted and observed values. Eqn. 3 has two versions: complex, using all significant variables for the model, and simple, which employs just readily available variables.
Model evaluation was conducted using a leave-one-out cross-validation approach, extracting the so-called PRESS (predicted sum of squares of errors) residuals ([22]) to calculate the following validation statistics: mean of PRESS residuals (mPRESS) for bias evaluation; mean of absolute PRESS residuals (maPRESS) and predictive modelling efficiency (EF) for precision evaluation ([22]). Heteroscedasticity was visually assessed using plots of standardised residuals versus fitted values, and a weight function was applied when heteroscedasticity was not verified, following the methodology suggested by Parresol ([25]). Normality was evaluated through visual assessment of QQ-plots of standardised weighted residuals.
Results
Tab. 2 - The model compartments (Comp.) - (wl): leaf biomass; (wbr): branch biomass; (ws): stem biomass. The coefficients - (a): allometric scalar; (b0): associated with d or du; (b1): associated with other tree/stand variables in the exponent of d or du; (c0): associated with tree variables related to height; (c1): associated with other tree/stand variables in the exponent of tree variables related to height. (***): p < 0.001; (**): p < 0.01; (*): p < 0.05. (ns): indicate that the parameter was not significantly different from zero at the usual α levels. A dash indicates that the parameter is not part of model fitting. The standard error is given.
| Model | Comp. | a | b 0 | b 1 | c 0 | c 1 |
|---|---|---|---|---|---|---|
| Juvenile | wl | 0.380 ± 0.009 *** | - | - | 1.375 ± 0.056 *** | - |
| wbr | 0.401 ± 0.031 *** | - | - | 2.343 ± 0.118 *** | - | |
| ws | 0.339 ± 0.015 *** | - | - | 2.539 ± 0.071 *** | - | |
| Virgin | wl | 0.059 ± 0.017 *** | 1.216 ± 0.210 *** | ns | 0.590 ± 0.214 ** | ns |
| wbr | 0.032 ± 0.007 *** | 1.864 ± 0.153 *** | ns | 0.736 ± 0.143 *** | ns | |
| ws | 0.006 ± 0.001 *** | 2.651 ± 0.109 *** | ns | 0.699 ± 0.102 *** | ns | |
| Debarked - simple | wl | 0.313 ± 0.204 | 1.238 ± 0.176 *** | - | ns | - |
| wbr | 0.395 ± 0.259 | 1.724 ± 0.189 *** | - | ns | - | |
| ws | 0.049 ± 0.020 * | 2.660 ± 0.106 *** | - | ns | - | |
| Debarked - complex | wl | 0.223 ± 0.152 | 1.339 ± 0.189 *** | ns | ns | ns |
| wbr | 0.032 ± 0.014 * | 1.771 ± 0.106 *** | ns | 1.296 ± 0.151 *** | ns | |
| ws | 0.010 ± 0.004 * | 3.077 ± 0.109 *** | -0.008 ± 0.003 * | ns | ns |
All coefficient estimates, corresponding standard errors, and significance levels can be found in Tab. 2. The juvenile stage model was fitted as a function of h, as it is the only available variable at that life stage. The final models for each biomass compartment of the juvenile stage are (eqn. 4 to eqn. 7):
where eqn. 4, eqn. 5, eqn. 6, and eqn. 7 correspond to juvenile biomass of leaves (wl, kg), branches (wbr, kg), stem (ws, kg), and total aboveground (wa, kg), respectively; h is the total tree height. All coefficients in the juvenile stage related to h were significantly different from zero (p < 0.001 - Tab. 2).
In the virgin stage, both d and h are available. An additional tree variable (nbr) was tested in the branches and stem compartments, as it was the only common variable. It was tested by expressing the parameters b1 and/or c1 as a linear function of nbr, but these associated parameters were not significantly different from zero. The final models for each biomass compartment of the virgin stage are as follows (eqn. 8 to eqn. 11):
where eqn. 8, eqn. 9, eqn. 10, and eqn. 11 correspond to the virgin biomass of leaves (wl, kg), branches (wbr, kg), stem (ws, kg), and total aboveground (wa, kg), respectively; d is the diameter at breast height (cm) and h is the total tree height (m). All coefficients in the virgin stage related to d and h were significantly different from zero (p < 0.001, except for c0 in the wl compartment, with a p > 0.01 - Tab. 2).
In developing the model for the debarked stage, a wider range of available tree variables was considered, and it was the only life stage where stand variables were tested. However, the debarked simple model was fitted as a function of du only, as the parameter associated with h was not significant. The final simple models for each biomass compartment of the debarked stage are as follows (eqn. 12 to eqn. 15):
where eqn. 12, eqn. 13, eqn. 14, and eqn. 15 are the simple models for debarked biomass of leaves (wl, kg), branches (wbr, kg), stem (ws, kg), and total aboveground (wa, kg), respectively; du is the diameter under bark at breast height (cm).
The debarked complex model used all available variables. The final complex models for each biomass compartment of the debarked stage are as follows (eqn. 16 to eqn. 19):
where eqn. 16, eqn. 17, eqn. 18, and eqn. 19 are the complex models for debarked biomass of leaves (wl, kg), branches (wbr, kg), stem (ws, kg), and total aboveground (wa, kg), respectively; du is the diameter under bark at breast height (cm), cl is the crown length (m), and G is the basal area (m2) per hectare. We found that cl was superior to h in the branches compartment (p < 0.001 - Tab. 2) and that expressing the exponent of du as a linear function of G originated a b1 parameter estimate significantly different from zero (p < 0.05 - Tab. 2) in the stem compartment, which, in this case, did not include any height variable. The a coefficient in the debarked life stage was sometimes not significantly different from zero; however, the null hypothesis H0 (parameter = 0) does not apply to this parameter, as it is a multiplicative term in the non-linear allometric equation. The issues with the p-values of some parameters in non-linear regression are well discussed by Frost ([11]), who recommends an analysis of the most appropriate null hypothesis for each parameter. Therefore, this was not considered a problem.
Tab. 3 shows the performance metrics of each model. The juvenile stage exhibits the lowest overall EF. The virgin stage’s wl and wbr demonstrate reasonable modelling efficiency. Compartment wl indicates the lowest EF values, except when compared to wbr in the debarked simple model, where EF is 0.35. Additionally, the performance and continuity of the best overall models can be visually evaluated from Fig. 2a, Fig. 2b, Fig. 2c, and Fig. 2d.
Tab. 3 - The biomass compartments (Comp.) - (wl): leaf biomass; (wbr): branch biomass; (ws): stem biomass; (wa): aboveground biomass. The performance metrics - (mPRESS): mean of PRESS residuals (kg); (maPRESS): mean of absolute PRESS residuals (kg); (EF): predictive modelling efficiency.
| Model | Comp. | mPRESS | maPRESS | EF |
|---|---|---|---|---|
| Juvenile | wl | 0.00 | 0.32 | 0.43 |
| wbr | 0.02 | 0.78 | 0.49 | |
| ws | -0.03 | 0.51 | 0.68 | |
| wa | -0.01 | 1.19 | 0.70 | |
| Virgin | wl | 0.23 | 0.89 | 0.74 |
| wbr | -0.31 | 2.13 | 0.93 | |
| ws | 1.78 | 5.33 | 0.89 | |
| wa | 2.18 | 6.51 | 0.93 | |
| Debarked - simple | wl | 1.17 | 7.19 | 0.63 |
| wbr | -7.64 | 60.05 | 0.35 | |
| ws | -0.35 | 143.21 | 0.90 | |
| wa | -4.50 | 178.37 | 0.89 | |
| Debarked - complex | wl | 0.66 | 7.47 | 0.61 |
| wbr | -10.87 | 42.31 | 0.63 | |
| ws | 26.55 | 166.14 | 0.92 | |
| wa | 18.65 | 166 | 0.90 |
Fig. 2 - A visual representation of model performance. Each panel represents one biomass compartment (kg) of observed versus predicted biomass values: (a) leaves, (b) branches, (c) stem, and (d) aboveground. The colours distinguish the data into the three life stages: juvenile (green dots), virgin (orange dots), and debarked (purple dots). The predicted biomass values for each life stage were calculated with the final models that showed the best performance. The dashed line across the graphs serves as a guide for visually inspecting the model performance.

Discussion
Estimating cork oak biomass is challenging due to its complex architecture and the difficulty in separating compartments ([26]). For instance, aggregating all aboveground biomass into one compartment does not provide sufficient separation for some biomass estimation purposes, such as their application in process-based models ([18]). Further, the dimension of biomass values in each compartment can vary significantly. To address these issues, we organised the biomass into four compartments relevant for managers and other applications throughout the tree’s production cycle: leaves, branches, stem (including branches with d ≥ 7.5 cm and virgin cork), and aboveground, which is simply the sum of all other compartments.
The leaves compartment naturally exhibits higher variability ([1], [16]), while the wood compartments are much more consistent. However, this is not true for branches, which suffer extensive changes, whether through pruning when the trees are young to produce a proper stem shape or when the trees are older and develop a more complex canopy structure. This structural diversity in branches across all life stages possibly accounts for the variability in predictive performance values between models (EF of 0.49, 0.93, 0.35, and 0.63 for the juvenile, virgin, debarked simple, and complex models, respectively - Tab. 3). The high EF of the virgin stage is perhaps due to the homogeneity of branches, and indeed, virgin wbr has a relatively low standard deviation compared to other compartments (results not shown). However, the same cannot be said for the juvenile stage, despite juvenile wbr also exhibiting low standard deviation. This discrepancy is possibly due to h, being the only variable in the model and less correlated with biomass growth than d or du; however, it is one of the easiest variables to measure at this stage. Juvenile trees are not immediately exploited for cork production and are often overlooked or missed in inventories due to the increased requirements for biometric measurements or the limitations of sensors ([23]). Having a comprehensive understanding of stand biomass will facilitate the management of cork oak woodlands ([37], [3]), and this model enables biomass estimation from relatively simple measurements, even if the predictive performance is not optimal (with a maximum EF = 0.70 for aboveground biomass - Tab. 3).
The model for trees in the debarked stage was divided into two - simple and complex - because we found that the complex model performed better overall (Tab. 3) but required two variables that may not be readily available. The complex model is defined as a function of du, h, cl, and G, which were the only tree and stand variables associated with parameters significantly different from zero. We found that cl improved the branches equation (EF = 0.35 and EF = 0.63 for the simple and complex models, respectively - Tab. 3), as verified by other authors ([2], [43]). The stand variables N and G were tested by expressing the parameters b1 and/or c1 as linear functions of those variables. We found that the estimates of those parameters were not significantly different from zero when associated with N, which aligns with similar research ([16]). However, the estimates for both parameters differed significantly from zero when associated with G in the stem equation and further improved when associated with the du exponent. All biomass was harvested in relatively low-density stands (maximum observed N = 304). Since G is a better indicator of inter-tree competition than N - because it accounts for both stem number and tree girth - this may explain why this stand density measure performs better than N, as also found by Faias et al. ([9]). To further assess the effects of N and G, having a broader sample of trees from stands concerning these variables would be ideal, particularly in the adult debarked trees, where the effects of inter-tree competition should be more pronounced. The simple model excludes all variables from the complex model except for du. We found the parameter associated with h neither significant as a replacement for cl in the wbr compartment nor as an additional multiplicative term in the ws compartment (p > 0.05, results not shown).
Regarding model continuity of the best overall models, there is overlap at the beginning and end of each stage transition (Fig. 2a, Fig. 2b, Fig. 2c, and Fig. 2d) that suggests acceptable continuity, particularly between the juvenile and virgin stages. The virgin model slightly underestimates leaf biomass for observed values ≥ 10 kg. All other compartments exhibit more or less linear trends for the relationship between observed and predicted values, which is the ideal behaviour. While there are some limitations to these models regarding continuity, we believe that these limitations were mitigated by model design, for instance, by considering smaller virgin trees (h < 3 m) in fitting the juvenile model. This also ensured a large sample size in a model that relies solely on h. Nevertheless, it is important to indicate that some divergence in estimates may occur at the junction of juvenile and the virgin models or virgin and debarked models. We recommend that the model for juvenile trees should be employed when d has not been measured, while the model for virgin trees should be used when d with virgin cork is measured. The biomass for all other trees should be estimated using the models for debarked trees.
Conclusions
The effort to incorporate regeneration into modelling is relatively recent, though it has gained importance in the context of climate change. Young cork oak trees are often neglected and not accounted for in biomass estimates, preventing a comprehensive characterisation of the stand and thus, causing uncertainty in biomass estimates. We successfully developed a set of four model systems that can estimate cork oak biomass for each life stage of the production cycle - one model for juvenile trees, one for virgin trees, and two for the debarked stage. All models estimate total aboveground biomass by compartment (leaves, stem, and branches). The juvenile model requires total tree height, while the virgin model requires diameter at breast height and total tree height. Two models were developed for the debarked life stage - a simple and a complex model. The complex model requires diameter at breast height under bark, total height, crown length, and basal area, while the simple model uses only diameter at breast height under bark, reducing model requirements. Although continuity between each model equation could be improved, these models aim to enhance cork oak management by refining the applicability of empirical models.
Acknowledgements
The authors would like to express their gratitude to Teresa Sampaio (TS) and António Correia (AC) for their contributions to the data curation of young cork oak trees. Conceptualisation and methodology were carried out by CJ and MT; data curation was conducted by JAP, TS and AC; CJ prepared the original draft; review and editing were undertaken by CJ and MT. This research was funded by the Forest Research Centre, a research unit supported by Fundação para a Ciência e a Tecnologia, I.P. (DOI 10.54499/UIDB/00239/2020 and DOI 10.54499/UIDP/00239/2020). CJ was funded by Fundação para a Ciência e a Tecnologia, I.P. under scholarship UI/BD/150757/2020.
References
CrossRef | Gscholar
CrossRef | Gscholar
CrossRef | Gscholar
CrossRef | Gscholar
Gscholar
Gscholar
Gscholar
Gscholar
CrossRef | Gscholar
Online | Gscholar
Gscholar
Authors’ Info
Authors’ Affiliation
Joana Amaral Paulo 0000-0003-1889-1721
Margarida Tomé 0000-0002-6242-8593
Forest Research Centre, TERRA Associate Laboratory, School of Agriculture, University of Lisbon, Tapada da Ajuda, 1349-017 Lisbon (Portugal)
Corresponding author
Paper Info
Citation
Jorge C, Paulo JA, Tomé M (2025). Tree biomass models for the entire production cycle of Quercus suber. iForest 18: 38-44. - doi: 10.3832/ifor4604-018
Academic Editor
Andrea Cutini
Paper history
Received: Mar 15, 2024
Accepted: Feb 04, 2025
First online: Feb 28, 2025
Publication Date: Feb 28, 2025
Publication Time: 0.80 months
Copyright Information
© SISEF - The Italian Society of Silviculture and Forest Ecology 2025
Open Access
This article is distributed under the terms of the Creative Commons Attribution-Non Commercial 4.0 International (https://creativecommons.org/licenses/by-nc/4.0/), which permits unrestricted use, distribution, and reproduction in any medium, provided you give appropriate credit to the original author(s) and the source, provide a link to the Creative Commons license, and indicate if changes were made.

Web Metrics
Breakdown by View Type
Article Usage
Total Article Views: 9394
(from publication date up to now)
Breakdown by View Type
HTML Page Views: 3087
Abstract Page Views: 2978
PDF Downloads: 3025
Citation/Reference Downloads: 4
XML Downloads: 300
Web Metrics
Days since publication: 484
Overall contacts: 9394
Avg. contacts per week: 135.86
Article Citations
Article citations are based on data periodically collected from the Clarivate Web of Science web site
(last update: Mar 2025)
(No citations were found up to date. Please come back later)
Publication Metrics
by Dimensions ©
Articles citing this article
List of the papers citing this article based on CrossRef Cited-by.
Related Contents
iForest Similar Articles
Review Papers
Problems and solutions to cork oak (Quercus suber L.) regeneration: a review
vol. 16, pp. 10-22 (online: 09 January 2023)
Research Articles
Methods for predicting Sitka spruce natural regeneration presence and density in the UK
vol. 12, pp. 279-288 (online: 23 May 2019)
Research Articles
Feasibility study of near infrared spectroscopy to detect yellow stain on cork granulate
vol. 11, pp. 111-117 (online: 31 January 2018)
Research Articles
Modelling natural regeneration of Oak in Saxony, Germany: identifying factors influencing the occurrence and density of regeneration
vol. 16, pp. 47-52 (online: 16 February 2023)
Research Articles
Towards the economic valuation of ecosystem production from cork oak forests in Sardinia (Italy)
vol. 11, pp. 660-667 (online: 04 October 2018)
Research Articles
Carbon storage in degraded cork oak (Quercus suber) forests on flat lowlands in Morocco
vol. 9, pp. 125-137 (online: 08 August 2015)
Research Articles
Variability of ant community composition in cork oak woodlands across the Mediterranean region: implications for forest management
vol. 10, pp. 707-714 (online: 27 July 2017)
Research Articles
Climate-wise models of biomass productivity for hybrid poplar clones in Europe
vol. 16, pp. 188-194 (online: 30 June 2023)
Research Articles
Assessing the relative role of climate on litterfall in Mediterranean cork oak forests
vol. 11, pp. 786-793 (online: 14 December 2018)
Research Articles
Belowground biomass models for young oligotrophic Scots pine stands in Latvia
vol. 11, pp. 206-211 (online: 01 March 2018)
iForest Database Search
Search By Author
Search By Keyword
Google Scholar Search
Citing Articles
Search By Author
Search By Keywords
PubMed Search
Search By Author
Search By Keyword


