Relationships between overstory and understory structure and diversity in semi-natural mixed floodplain forests at Bosco Fontana (Italy)
iForest - Biogeosciences and Forestry, Volume 9, Issue 6, Pages 919-926 (2016)
doi: https://doi.org/10.3832/ifor1789-009
Published: Aug 21, 2016 - Copyright © 2016 SISEF
Research Articles
Abstract
The “Bosco Fontana” natural reserve includes the last remaining mixed floodplain forest in northern Italy and one of the most endangered ecosystems in Europe. Its effective management is hindered by the complexity of interactions of mixed-tree species and the influence of environmental factors on understory plant diversity. In this study we analyzed the patterns of natural evolution in semi-natural floodplain forest stands at Bosco Fontana with the aim of better understanding its current natural processes and dynamics. Stand structure, taxonomic and functional diversity, species composition, and leaf area index (LAI) of overstory and understory layers were surveyed in permanent plots over two inventory years (1995, 2005). The influence of environmental factors on understory plant diversity was assessed using Ellenberg’s indices for light, soil moisture, soil nutrient and soil reaction. Results indicated that overstory species composition varies according to the soil moisture, with hornbeam prevailing in xeric sites and deciduous oak species in mesic sites. Xeric sites showed high functional dispersion in both drought and shade tolerant traits, while it was significantly lower in both overstory and understory in the moist site. Functional dispersion of drought tolerance in the overstory and understory layers was positively correlated, while species richness was negatively correlated between the two layers. Diversity in the understory was mainly correlated with soil conditions. Understory LAI was positively correlated with overstory LAI in xeric and mesic plots, while no correlations were found in the moist plot. Overall, our results suggest that site conditions (soil conditions and water availability) are the major drivers of understory and overstory dynamics in the study forest. Hence, local site conditions and the understory should be carefully considered in the management of mixed floodplain forests.
Keywords
Deciduous Forests, Functional Diversity, Diversity Measure, Hemispherical Photography, Leaf Area Index
Introduction
Only less than 1% of temperate deciduous forests in Europe are undisturbed, free of logging, grazing, deforestation and other intensive uses ([61]). Mixed temperate forests show a high level of naturalness, thus becoming a basic reference for forest management ([51], [6], [11], [32]). New silvicultural systems have emerged during recent decades, based on the assumption that diversity patterns and ecological processes are more likely to persist when disturbances due to management mimic the patterns and processes of natural disturbances ([27], [69]). Management regimes mimicking natural disturbances can contribute to diversify stand structure, and this may increase biodiversity through time ([30], [31], [16]) whilst aiming at economic targets and minimizing modifications of the forests ([29]).
Close-to-nature forest management requires a comprehensive knowledge of the stand structure, diversity and species interactions naturally occurring in forest ecosystems ([14]). In the last decades, the number of studies conducted in natural forests sharply increased ([30], [64], [16], [57], [63]). Forest stand structure is an important factor in determining species diversity ([42], [47], [23]) which is a combination of species richness and their relative abundance ([54]). Functional diversity is another component of species diversity which has received much less attention in the scientific literature, though recent studies highlighted its crucial importance in shaping the ecosystem processes ([28]).
The composition of overstory species in the forest may influence understory vegetation diversity and composition ([56]). Forest overstory-understory relationships are complex and mutual, but are dominated by the overstory canopy structure which affects the availability of different resources on the forest floor ([64], [12], [13], [25]). Leaf Area Index (LAI) is a canopy attribute often used to analyze forest overstory-understory relationships ([46]) and to understand the structure and functions of forest ecosystems at various scales ([10]). LAI is strongly influenced by species, climate, soil fertility and tree density ([33], [1]). Overstory LAI has strong influence on understory light availability, regeneration and successional dynamics ([40]). Several studies investigated both overstory and understory LAI in boreal forests ([22], [4]) and in temperate mountain forests ([5], [21]), but these measurements had rarely been taken in temperate floodplain forest.
Floodplain forests (one of the 14 categories under the European Forest Types classification framework - [7]) are highly-dynamic and community-rich natural ecosystems among the most threatened in Europe. Indeed, about 90% of the original floodplain forests disappeared in the last century ([70]), mainly due to anthropogenic impacts ([17], [53]). These ecosystems are generally described as “azonal” ([36]), meaning that local vegetation community is more affected by local environmental conditions (e.g., flooding) than by overall climatic constraits. Hydrologic conditions are the most prominent features driving the ecological processes in floodplains ([35], [44], [18]), and affecting the composition and structure of floodplain forest communities ([43]).
The semi-natural reserve of “Bosco Fontana” is one of the last remaining floodplain forests in northern Italy ([73]), and one of the most endangered ecosystems in Europe ([65]). The forest has been managed as coppice with standards until the 1980s, when the reserve was created. Since then, the lack of human disturbances has led to an increasing incidence of the natural processes on forest structure and patterns. Most of the forested area consists of hornbeam (Carpinus betulus), pedunculate oak (Quercus robur), northern red oak (Q. rubra) and Turkey oak (Q. cerris) that prevails in the overstory ([26]). The high level of diversity and naturalness of the stands makes this forest an ideal site for studying structure and dynamics in mixed floodplain forests.
The aim of the study was to investigate the structure, diversity, composition, and LAI of forest overstory and understory at Bosco Fontana from 1995 to 2005, as well as to assess the influence of the environmental factors on the main structural and diversity parameters. We analyzed how overstory and understory structure did vary according to soil and environmental conditions. Our specific goals are summarized by the following questions: (i) how do overstory and understory layers vary in taxonomic, structural and functional diversity among xeric, mesic and moist sites? (ii) what are the relationships between overstory and understory layers among xeric, mesic and moist sites? (iii) what is the relationship between understory structure and diversity related to environmental conditions?
Material and methods
Study site
Bosco Fontana is a State Natural Reserve in northern Italy (45° 12′ N, 10° 44′ E). The climate is continental, with long, cold winters and hot, humid summers. The average annual temperature is 13.2° C and the average annual rainfall was 658 mm ([15]). Eighty-five percent of the Reserve is covered by an ancient floodplain forest and a semi-natural woodland ([48], [50]) belonging to the Sub-Atlantic and medio-European oak or oak-hornbeam forests of the Carpinion betuli (code 9160, Habitats Directive - 1992/43/CEE). Six permanent monitoring plots were sampled in 1995 and 2005 based on the “SILVI-STAR” system ([38]). These plots were managed as coppice with standards until the ’ÂÂ80s and then left to the natural evolution ([49]). The only exception was plot ID5, where the alien species red oak (Quercus rubra) was established after the second World War, which is currently under progressive removal through interventions aimed at increasing the dead wood ([19], [73]).
A survey was conducted in three out of the six permanent plots, which were chosen as representative of the overstory and understory composition of the Natural Reserve. In particular, plots ID1, ID2 and ID3 reflect the xeric, mesic and moist regime variant of the oak-hornbeam forest, respectively.
The forest overstory survey was conducted in core areas (70×140 m) established within each of the three aforementioned plots, while understory was surveyed in a central area (2×100 m) nested within each core area (see below). Three additional 10×100 m plots (ID4, ID5, ID6) were established for the analysis of the overstory, each with a nested area of 2×100 m for the understory survey. The plots were categorized into three moisture regime variants (xeric, mesic, moist conditions) based on soil moisture measurements ([50]). The main stand attributes of the study plots in the two inventory years (1995, 2005) are listed in Tab. 1.
Tab. 1 - Main stand characteristics of the studied plots in the two inventory years (1995, 2005). Standard errors are reported in brackets.
| Plot | Hydrology | 1995 | 2005 | ||
|---|---|---|---|---|---|
| Basal area (m2 ha-1) |
Height (m) |
Basal area (m2 ha-1) |
Height (m) |
||
| ID1 | xeric | 19.65 | 14.9 (0.3) | 23.32 | 14.5 (0.4) |
| ID2 | mesic | 23.59 | 14.9 (0.4) | 30.45 | 18.7 (0.6) |
| ID3 | moist | 24.94 | 12.8 (0.2) | 31.93 | 16.5 (0.5) |
| ID4 | xeric | 13.41 | 9.3 (0.1) | 18.16 | 12.4 (0.3) |
| ID5 | mesic | 30.65 | 18.8 (0.6) | 20.86 | 14.7 (0.4) |
| ID6 | mesic | 27.3 | 15.1 (0.4) | 26.73 | 15.1 (0.4) |
Stand structure and composition
All vascular plants with height above 1.30 m and diameter above 5 cm were classified as overstory in both surveys (1995 and 2005). Each plant was identified at the species level and its diameter at breast height (1.30 m) and height measured. Stand structure, diameter distribution and species basal area contribution was compared between the two inventories to assess change in overstory structure and composition.
Within each monitoring plot, fifty 2×2 m permanent understory sub-plots were established along a linear transect at the center of each monitoring plot. The understory survey was conducted during periods of peak vegetation cover (July-August) in both 1995 and 2005. Each vascular plant was identified at the species level and its cover-abundance estimated using the Braun-Blanquet scale, which was converted to percentage cover values.
Diversity indices
Taxonomic diversity at both overstory and understory level was measured as species richness (SR) and Shannon’s index (H). Functional diversity at both levels was measured as functional dispersion (FD) as proposed by Laliberté & Legendre ([39]). First, the mean distance of each species to the centroid ci of the xj species-by-trait matrix is calculated (eqn. 1):
where aj is the abundance of the species j and xij is the attribute of the species j for the trait i. The index FD is then computed as the weighted mean distance z to the weighted centroid (eqn. 2):
where ai is the abundance of the species j and zj is the Euclidean distance of the species j to the centroid of the species-by-trait matrix. This index is strongly correlated with Rao’s quadratic entropy Q ([60]) as both indices estimate the dispersion of species in the traits space, weighted by their relative abundances.
Shade tolerance and drought tolerance were the functional traits considered in this analysis. Both these traits are relevant in terms of ecosystem dynamics and management ([62], [8]). Species’ values for both traits were obtained from Niinemets & Valladares ([55]), or from additional literature sources when not available therein (e.g., [52], [66], [59]). The full list of species’ values for shade and drought tolerance is reported in Tab. S1 (Supplementary material). The FD index was computed separately for each trait and combining both traits using the “FD” package ([39]) and the R software (R Core Development Team, Vienna).
For the overstory layer, species basal area was used as surrogate of abundance in the computation of both the overstory functional dispersion (FDO) and the Shannon’s Index (HO). The species’ cover was used as a surrogate of species abundance to compute understory functional dispersion (FDU) and the Shannon’s index (HU). Moreover, understory diversity indices were calculated for each sub-plot quintuplet (i.e., every 10 m along the transect) to obtain a reasonable minimum number of samples in the analyses.
Leaf area index survey
Leaf area index of both overstory and understory layers was estimated in a sub-set of three plots (one xeric, one mesic and one moist plot) according to Chianucci & Cutini ([20]) and Chianucci et al. ([21]). Downward-facing images of the understory layer and upward-facing images of the overstory layer were collected in 2005 using a Nikon Coolpix 4500 equipped with a FC-E8 fisheye lens converter set to F1, minimum aperture (F 5.3) and one-stop-underxposure. For each monitoring plot, 120 understory images and 120 overstory images were collected along a grid, with sampling points spaced 10 m each other. Images were collected close to sunrise at a height of 1.5 m. Overstory images were first corrected to a gamma function of 1.0 and then classified using a single binary threshold in Winscanopy® (Regent Instruments, S.te-Foy, Quebec, Canada). Understory images were classified using the LAB2 classification method of Macfarlane & Ogden ([45]) in MATLAB®. Overstory and understory classified images were then analyzed in Winscanopy for estimation of the leaf area index. The hemisphere of each image was divided into 7 zenith rings with a zenith angle range of 0-70° and 8 azimuth segments. Leaf area index corrected for clumping was finally estimated by averaging the generalized LAI-2000 method and the ellipsoidal LAI method, for transformed gap fraction data (log method - [41]).
Comparisons between overstory and understory layers
To evaluate the change in the overstory composition among sites, we compared the composition and the structure of the stands between the two inventory years (1995, 2005). Further, leaf area indices and the selected functional and taxonomic indices were compared among sites and dates. The significance of the relationships between overstory and understory attributes was tested using the Pearson’s r correlation test.
To explore the relationship between the understory and environmental conditions, we used Ellenberg’s indicators for light (L), temperature (T), soil nutrient (N) and soil reaction (R), and a combination of these traits, which were assessed for the Italian flora by Pignatti et al. ([58]) and are currently available from the “TR8” package ([9]) for the R software. The understory cover-abundance values were used as weighted averages for computing Ellenberg’s indicators. This approach is an alternative to direct field measurements of site characteristics ([68], [27]). Environmental effects on understory attributes were investigated by the Pearson’s r correlation test.
Results
Stand structure and composition
The studied plots generally showed a reverse-J diameter distribution (Fig. 1), which was more pronounced in the second inventory in 2005. Stand basal area increased in four out of six plots by values ranging from 15 to 25% (Tab. 1), likely due to an increase by horn beam, Turkey oak and ash species (Fraxinus ornus, F. oxycarpa) in these plots (Tab. 2). A reduction in basal area of 46% was observed in one plot (ID5) due to thinning of red oak (Tab. 2). Basal area was almost unchanged between the two inventories in the remaining plots (Tab. 1).
Fig. 1 - Distribution of tree stem diameters at breast height in the studied plots in 1995 (top) and 2005 (bottom).
Tab. 2 - Basal area contribution (m2 ha-1) by each species surveyed in the overstory plots at the two inventory years (1995, 2005).
| Species | 1995 | 2005 | ||||||||||
|---|---|---|---|---|---|---|---|---|---|---|---|---|
| ID1 | ID2 | ID3 | ID4 | ID5 | ID6 | ID1 | ID2 | ID3 | ID4 | ID5 | ID6 | |
| Acer campestre | 0.04 | 0.82 | 0.19 | 0.15 | - | - | 0.20 | 0.51 | 0.25 | 0.32 | - | - |
| Alnus glutinosa | - | - | 3.00 | - | 2.23 | - | - | - | 2.72 | - | 2.12 | - |
| Corylus avellana | 0.05 | 0.04 | 0.65 | 0.02 | - | 0.21 | 0.57 | 0.17 | 0.96 | 0.77 | 0.42 | 0.43 |
| Carpinus betulus | 9.76 | 11.00 | 6.46 | 8.61 | 8.44 | 7.60 | 12.04 | 11.60 | 7.04 | 8.93 | 7.97 | 7.58 |
| Cornus mas | - | 0.00 | - | - | - | - | 0.01 | 0.01 | 0.00 | - | 0.08 | 0.05 |
| Crataegus oxyacantha | 0.01 | 0.00 | 0.04 | 0.02 | 0.05 | - | 0.01 | 0.00 | 0.00 | - | - | - |
| Cornus sanguinea | 0.00 | - | 0.01 | - | - | - | - | - | - | - | - | - |
| Clematis vitalba | - | 0.01 | 0.00 | - | - | 0.14 | - | - | - | - | - | - |
| Fraxinus oxycarpa | - | - | 7.28 | - | - | - | - | - | 12.17 | - | - | - |
| Fraxinus ornus | 0.02 | 3.16 | 0.01 | 0.75 | - | 1.29 | 0.10 | 7.85 | 0.00 | 1.37 | - | 0.57 |
| Hedera helix | - | 0.01 | - | - | - | - | 0.07 | - | 0.01 | - | - | 0.00 |
| Juglans regia | - | - | - | - | - | 1.32 | - | - | - | - | - | 2.46 |
| Malus sylvatica | 0.05 | - | 0.03 | - | - | 0.05 | 0.02 | - | - | - | - | - |
| Prunus avium | 0.49 | 0.50 | 0.76 | 0.32 | 0.57 | - | 1.07 | 0.58 | 0.84 | 0.37 | 0.71 | - |
| Platanus x acerifolia | - | - | 0.03 | - | - | 1.45 | - | - | 0.04 | - | - | 2.51 |
| Quercus rubra | - | - | - | - | 18.93 | 12.91 | - | - | - | - | 8.86 | 12.26 |
| Quercus cerris | 0.85 | 0.56 | - | 1.04 | - | - | 1.04 | 1.13 | 0.59 | 2.49 | - | - |
| Quercus robur | 8.22 | 7.35 | 5.89 | 2.29 | 0.44 | 1.31 | 7.86 | 8.57 | 6.37 | 3.61 | 0.64 | 0.79 |
| Robinia pseudoacacia | - | - | 0.07 | - | - | - | 0.02 | - | 0.16 | - | - | - |
| Sambucus nigra | 0.03 | 0.00 | 0.03 | - | - | - | 0.05 | - | 0.01 | 0.08 | 0.02 | - |
| Sorbus torminalis | 0.12 | 0.12 | 0.06 | 0.20 | - | 0.94 | 0.09 | 0.03 | - | 0.23 | - | - |
| Ulmus minor | 0.01 | - | 0.42 | - | - | 0.08 | 0.19 | - | 0.77 | - | 0.03 | 0.07 |
Horn beam and oaks were the most dominant species, but their relative contribution varied according to the hydrological site conditions. The largest abundance of horn beam was observed in the xeric plots, where this species contributed to the total stand basal area between 50 to 64% in 1995 and between 49 to 52% in 2005; in the same plots the contribution of oak species varied between 25 and 46% in 1995 and between 34 to 38% in 2005. In mesic plots horn beam contributed to the total stand basal area between 28 to 47% in 1995 and between 28 to 38% in 2005, while the contribution of oak species varied between 33 to 63% in 1995 and between 32 to 49% in 2005. In the moist plot, more water demanding species (Fraxinus oxycarpa, Alnus glutinosa and Corylus avellana) largely contributed (46-50%) to the total stand basal area.
Diversity indices
The number of overstory vascular plant species found in the monitored understory plots (quintuplets) ranged from 6 to 17. Overstory functional dispersion (FDO) in drought and shade tolerance traits ranged from 0.16 to 1.12 (average ± standard deviation: 0.44 ± 0.30) and from 0.58 to 1.16 (0.85 ± 0.18), respectively. The values of FDO obtained combining the two traits ranged from 0.62 to 1.63 (1.04 ± 0.30). On average, xeric sites showed higher FDO values, while the moist plot showed lower FDO values (Fig. 2). Functional diversity increased between the two inventories (Fig. 2). Shannon index (HO) ranged from 0.99 to 1.68 (1.39 ± 0.22); the moist plot showed the highest HO values, while xeric plots showed the lowest.
Fig. 2 - Mean values of functional dispersion (FDo) for species’ drought tolerance (top) and shade tolerance (bottom) in the overstory layer of the studied plots at the two inventory dates (1995, 2005).
The number of understory vascular plant species found in the monitored plots ranged from 4 to 20. Understory functional dispersion (FDU) in drought and shade tolerance traits ranged from 0.12 to 1.14 (0.53 ± 0.19) and from 0.06 to 0.84 (0.42 ± 0.15), respectively; FDU obtained combining the two traits ranged from 0.15 to 1.32 (0.73 ± 0.20). Similarly to FDO, xeric sites showed on average higher FDU values, while the moist plot showed lower FDU values. Shannon’s index HU ranged from 0.51 to 2.78 (1.61 ± 0.41); unlike HO, xeric plots showed on average higher HU values, while the moist plot showed lower HU values.
Understory diversity indices showed significant correlations with site environmental characteristics obtained from Ellenberg’s indicator values (Tab. 3). The dispersion in shade tolerance was negatively correlated with light value (L). Conversely, the dispersion in drought tolerance was positively correlated with all the environmental factors. Species richness and the Shannon’s index were positively correlated with soil nutrient (N) and the combined environmental index. Understory cover was positively correlated with light value (L) and negatively correlated with soil reaction (R).
Tab. 3 - Person’s r correlation coefficients between understory diversity indices and site environmental characteristics obtained from Ellenberg’s indicator values (n = 120). (SR): Species richness; (FD): functional dispersion; (H): Shannon’s index; (*): p < 0.05; (**): p < 0.01; (***): p < 0.001.
| Attribute | Light (L) |
Temperature (T) |
Soil reaction (R) |
Soil nutrient (N) |
Combined Ellenberg Index |
|---|---|---|---|---|---|
SR
U
|
0.14 | 0.01 | 0.07 | 0.23* | 0.24** |
FD
U dry
|
0.40*** | 0.51*** | 0.36*** | 0.30*** | 0.22* |
FD
U shade
|
-0.29*** | -0.17 | 0.13 | 0.10 | 0.01 |
FDU dry x shade |
0.22** | 0.33*** | 0.35*** | 0.23* | 0.23* |
| Understory cover | 0.25** | -0.13 | -0.23* | -0.06 | 0.48*** |
H
U
|
0.13 | -0.04 | 0.06 | 0.20* | 0.53*** |
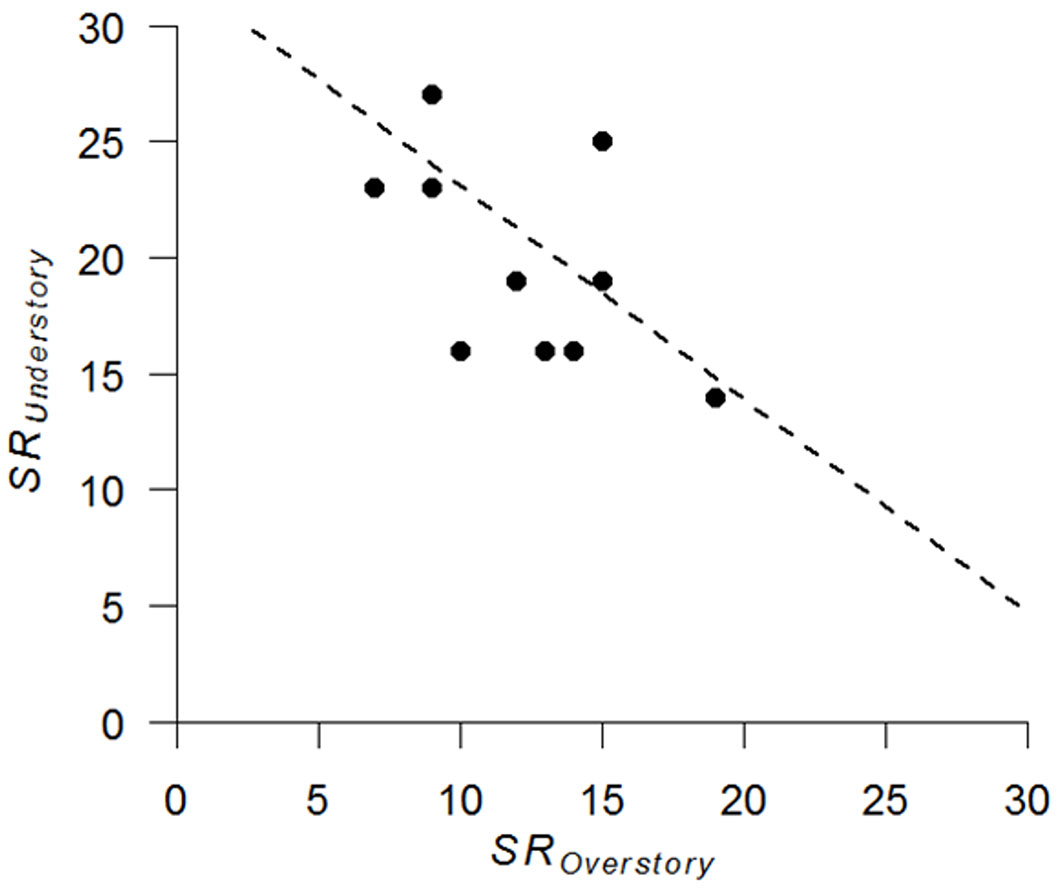
Analysis of overstory and understory relationship revealed a significant positive correlation in drought tolerance between the two layers (r = 0.82, n = 12, p = 0.01 - Fig. 3). In addition, understory species richness was slightly negatively correlated with overstory species richness (r = -0.57, n = 12, p = 0.055 - Fig. 4).
Fig. 3 - Relationship between functional dispersion of drought tolerance (FD) in the overstory and understory layers (n = 12).
Fig. 4 - Relationship between species richness (SR) of the overstory and understory layers (n = 12).
Leaf area index survey
Overstory LAI averaged (± SE) 4.1 ± 0.1, 4.4 ± 0.1 and 3.7 ± 0.1 in the xeric, mesic and moist plots, respectively. Understory leaf area index averaged 1.4 ± 0.1, 1.5 ± 0.1 and 1.1 in the xeric, mesic and moist plots, respectively. Understory LAI (LU) was positively correlated with overstory leaf area index (LO) in both the xeric (LU = 0.44 · LO - 0.38, n=120, r = 0.75) and mesic (LU = 0.36 · LO - 0.09, n=120, r = 0.71) plots, while was uncorrelated in the moist plot (LU = 0.08 · LO + 0.79, n=120, r = 0.01).
Discussion
The studied stands were characterized by a complex and highly diverse structure, which is typical of floodplain forests, as indicated by the structural and diversity indices tested. However, our results revealed that site conditions are an important aspect in explaining species distribution patterns and their interaction. Species composition in the overstory layer appeared to vary according to soil water availability, being more similar in xeric and mesic plots, in which hornbeam and oaks are the dominant species, and favoring more hygrophilus species in the moist site. Such different overstory composition is reflected by the functional dispersion indices, which increased from moist to xeric conditions. A decreasing correlation between understory and overstory LAIs was also observed with respect to increasing soil water availability.
The significant and positive correlation observed in drought tolerance and leaf area indices between understory and overstory layers suggest a mutual influence on the structure and dynamics of the two layers in temperate broadleaf forests. Further, the positive correlation between the leaf area indices of the two layers in xeric and mesic plots is contrasting with previous studies conducted in managed forests, which reported an inverse relationship between overstory and understory LAI ([46], [37], [21]). The understory of mesic and xeric plots analyzed in this study was dominated by Butcher’s broom (Ruscus aculeatus, average cover 53%), followed by the shade-tolerant species Anemone nemorosa (16%) and the drought-tolerant Vinca minor (12%). Therefore, we attributed the positive correlation between overstory and understory LAI observed in these plots to the large abundance of Ruscus aculeatus, which combines drought and shade tolerance in limiting site conditions ([59]).
The high functional dispersion observed in the plots characterized by relatively drier conditions suggests that these stands are undergoing an early successional stage, in which ruderal species with wide ecological amplitude are exhibiting large competition for limited resources. In this context, the large dominance of Ruscus aculeatus, combined with its high tolerance, may further displace other species in the understory by strong competition, thus limiting their presence in this successional stage ([16]). In the moist plot, Butcher’s broom showed a lower occurrence (29%) in the understory, while species associated with fertile and water-rich soils like Euonymous europaeus (average cover 17%), Allium ursinum (27%), Anemone ranunculoides (14%) and Corylus avellana (14%) had fairly high frequency. In the moist plot, LAI proved to be uncorrelated between the two layers, thus it could be hypothesized that this stand reflects a more mature successional stage, in which the higher resource availability have promoted niche differentiation and favored late-successional (habitat-specialist) species ([16]), and where the overstory-understory dynamics are close to the equilibrium ([3]). Taken together, the above results agree with previous reports indicating that different overstory structures can determine different environmental conditions, which drive different plants strategies aimed at tolerating stressful vs. competitive, resource-rich environments ([72], [71], [63]). In general, our results emphasize the importance of the understory layer (often neglected in forest management decision) because of its crucial role in driving the future dynamics of the forests ([34]).
Based on our results, we conclude that local site conditions should be carefully considered in the management of mixed temperate floodplain forests. In the more resource-limited stands, a strong interplay between the overstory and understory layers may facilitate a fast recharge of nutrient pools ([67]) and provide a greater resilience to environmental stresses ([2]). Silvicultural practices aimed at the conservation of forest diversity should be targeted at maintaining an active dynamics in the stand by reaching a compromise between overstory canopy removal and environmental resources availability after the intervention. Finally, an effective assessment of the interplay between overstory and understory layers should be included in forest monitoring systems ([24]), in order to support forest planning and management decisions.
Acknowledgements
FM designed the experiment and coordinated the work. FC, EM and MJF conducted the experiment, analyzed the data and wrote the paper. PM and AC collected the data. PC provided the conceptual support. FC was supported by the Project “ALForLab” (PON03PE_00024_1) co-funded by the Italian Operational Programme for Research and Competitiveness (PON R&C) 2007-2013, through the European Regional Development Fund (ERDF) and national resource (Revolving Fund - Cohesion Action Plan (CAP) MIUR). We are grateful to the anonymous reviewers for the useful suggestions that improved an early version of the manuscript.
References
Gscholar
Gscholar
CrossRef | Gscholar
Gscholar
Gscholar
Gscholar
CrossRef | Gscholar
Gscholar
Gscholar
Gscholar
Gscholar
Gscholar
Gscholar
Gscholar
Gscholar
Gscholar
CrossRef | Gscholar
Gscholar
Gscholar
Gscholar
Authors’ Info
Authors’ Affiliation
Most Jannatul Fardusi
Paolo Merlini
Andrea Cutini
Piermaria Corona
Consiglio per la ricerca in agricoltura e l’analisi dell’economia agraria, Forestry Research Center (CREA-SEL), Arezzo (Italy)
National Forest Service, National Center for the Study and Conservation of Forest Biodiversity “Bosco Fontana” (CNBFVR), str. Mantova 29, I-46045 Marmirolo, MN (Italy)
National Forest Service, National Center for Study and Conservation of Forest Biodiversity “Bosco Fontana”, National Taxonomic Laboratory for Invertebrates (CNBFVR-LANABIT), v. Tomaso Da Vico 1, I-37123 Verona (Italy)
Corresponding author
Paper Info
Citation
Chianucci F, Minari E, Fardusi MJ, Merlini P, Cutini A, Corona P, Mason F (2016). Relationships between overstory and understory structure and diversity in semi-natural mixed floodplain forests at Bosco Fontana (Italy). iForest 9: 919-926. - doi: 10.3832/ifor1789-009
Academic Editor
Gianluca Piovesan
Paper history
Received: Aug 03, 2015
Accepted: May 06, 2016
First online: Aug 21, 2016
Publication Date: Dec 14, 2016
Publication Time: 3.57 months
Copyright Information
© SISEF - The Italian Society of Silviculture and Forest Ecology 2016
Open Access
This article is distributed under the terms of the Creative Commons Attribution-Non Commercial 4.0 International (https://creativecommons.org/licenses/by-nc/4.0/), which permits unrestricted use, distribution, and reproduction in any medium, provided you give appropriate credit to the original author(s) and the source, provide a link to the Creative Commons license, and indicate if changes were made.

Web Metrics
Breakdown by View Type
Article Usage
Total Article Views: 54116
(from publication date up to now)
Breakdown by View Type
HTML Page Views: 43732
Abstract Page Views: 4139
PDF Downloads: 4738
Citation/Reference Downloads: 50
XML Downloads: 1457
Web Metrics
Days since publication: 3601
Overall contacts: 54116
Avg. contacts per week: 105.20
Article Citations
Article citations are based on data periodically collected from the Clarivate Web of Science web site
(last update: Mar 2025)
Total number of cites (since 2016): 6
Average cites per year: 0.60
Publication Metrics
by Dimensions ©
Articles citing this article
List of the papers citing this article based on CrossRef Cited-by.
Related Contents
iForest Similar Articles
Review Papers
Digital hemispherical photography for estimating forest canopy properties: current controversies and opportunities
vol. 5, pp. 290-295 (online: 17 December 2012)
Research Articles
Evaluation and correction of optically derived leaf area index in different temperate forests
vol. 9, pp. 55-62 (online: 11 June 2015)
Research Articles
The estimation of canopy attributes from digital cover photography by two different image analysis methods
vol. 7, pp. 255-259 (online: 26 March 2014)
Research Articles
Mapping Leaf Area Index in subtropical upland ecosystems using RapidEye imagery and the randomForest algorithm
vol. 7, pp. 1-11 (online: 07 October 2013)
Research Articles
Advantages of the point-intercept method for assessing functional diversity in semi-arid areas
vol. 8, pp. 471-479 (online: 31 October 2014)
Technical Advances
Thermal canopy photography in forestry - an alternative to optical cover photography
vol. 8, pp. 1-5 (online: 07 May 2014)
Research Articles
Estimation of forest leaf area index using satellite multispectral and synthetic aperture radar data in Iran
vol. 14, pp. 278-284 (online: 29 May 2021)
Technical Advances
A simplified methodology for the correction of Leaf Area Index (LAI) measurements obtained by ceptometer with reference to Pinus Portuguese forests
vol. 7, pp. 186-192 (online: 17 February 2014)
Research Articles
Edge tree functional traits and their association with edaphic factors in seasonally dry forests in northern Thailand
vol. 15, pp. 273-280 (online: 26 July 2022)
Research Articles
Functional turnover from lowland to montane forests: evidence from the Hyrcanian forest in northern Iran
vol. 8, pp. 359-367 (online: 16 September 2014)
iForest Database Search
Search By Author
Search By Keyword
Google Scholar Search
Citing Articles
Search By Author
Search By Keywords
PubMed Search
Search By Author
Search By Keyword


