Functional turnover from lowland to montane forests: evidence from the Hyrcanian forest in northern Iran
iForest - Biogeosciences and Forestry, Volume 8, Issue 3, Pages 359-367 (2015)
doi: https://doi.org/10.3832/ifor1002-008
Published: Sep 16, 2014 - Copyright © 2015 SISEF
Research Articles
Abstract
Plant functional traits and functional diversity play key roles in ecosystem functioning. Exploring patterns of functional diversity is of great importance in the management process of forest ecosystems. Altitudinal pattern of plant functional diversity is poorly investigated in Hyrcanian relict forest, N Iran. We explored differences in trait composition between lowland and montane forest types. Altitudinal variation of plant functional traits along 2400 m altitudinal gradient was examined. In order to collect species and vegetation data, 67 vegetation sampling plots were placed along the altitudinal gradient. Eight plant functional traits; related to plant physiognomy, competitive ability and dispersal, were selected for 174 recorded vascular plants and weighted by importance-value of taxa. We used generalized linear model, principal coordinate analysis along with functional diversity metrics to investigate functional changes along the gradient. The importance of different traits such as chamaephyte life form, tiny leaves, dry indehiscent fruits and small seeds increase with altitude. In contrast, other traits including large leaves, taller plants, fleshy fruits, anemophily as well as medium to large seeds decrease with increasing elevation. Functional difference between lowland and montane forest vegetation is strongly supported in our results. Trait associations, different environmental parameters, disturbance type and especially altitude were concluded to be important predictors of functional changes. Vegetation type is a key determinant of functional patterns in temperate forests. We strongly recommend exploring and considering functional diversity in forest management practices.
Keywords
Functional Diversity, Gradient, Hyrcanian Forest, Multivariate Analysis, Vegetation
Introduction
Exploring the heterogeneous distribution of biological diversity and ecological communities in the biosphere has long been a core objective in ecological studies ([21]). Plant functional traits, as link factors of biological diversity to ecosystem functioning, are attributes with significant influence on establishment, survival and fitness of plant species in the ecosystem ([15]). Such traits vary both along the environmental gradients and among species occupying similar habitat conditions ([13]). Some functional traits are advantageous under specific environmental conditions, and they are prevalently represented by species groups which grow under such conditions ([16], [47]).
Elevation gradients are among the most interesting tools for exploring the distribution patterns of biological diversity ([51]), in that certain factors (such as general geological characteristics and evolutionary history of species) are constant, while others may abruptly change at short distance (e.g., temperature, radiation, precipitation, season length, etc.), making elevation gradients an ideal test system for understanding the ecosystems responses to environmental changes ([33], [19]).
Studies on the association between plant traits and habitat conditions along environmental gradients have a long history ([32], [18]), and may provide important hints on the processes and mechanisms governing species distribution, richness pattern, community assembly and ecosystem functioning ([35]). Due to complexity of the observed variation in plant traits, at least for elevation gradients, plant ecologists still debate over the generality of the patterns found ([34]). Some factors such as co-presence of environmental sub-gradients including temperature, precipitation and radiation, human interference including land use/land cover changes, phylogenetic bias in trait variation, surface area, season length, along with community composition, stand age, and competition are among the major causes of the aforementioned complexity ([33]).
Lowland forests present significant differences in trait composition as compared with montane forest. We hypothesized that the vegetation type may play a key role in the functional turnover along the elevational gradient. Montane and lowland forest ecosystems represent either a different set of plant functional traits or similar traits with different importance values. Our aims were to answer the following key questions: (1) Does functional trait composition differs between lowland and montane forests? (2) Which ecological drivers, including forest compositional and physiognomic properties, cause functional differences between lowland and montane forest types? (3) How and why the distribution of different plant functional traits change with altitude?
Material and Methods
Study area and sampling
Hyrcanian forest is a temperate deciduous forest ecosystem in the southeastern part of the Caucasus biodiversity hotspot, northern Iran. This unique ecosystem belongs to Euro-Siberian floristic region ([58]) and hosts relict flora which has survived the Quaternary glaciations ([38]). In spite of its limited extension, Hyrcanian forest along with adjacent mountains hosts about 44 % of the Iranian flora (more than 3000 taxa - [2]).
Hyrcanian forest suffers from numerous natural and anthropogenic threats including improper management, wood harvesting activities, flood, fire, land use/land cover changes, husbandry and intense grazing (especially in the montane part). Currently, about 40 conservation areas are partly or completely located in this region.
Precipitation in this area decreases from about 1300 mm in the northern part to 800 mm at 2400 m elevation peak in the south ([7]). The mean annual temperature decreases from 16.1 °C in the northern part to 10 °C in southwest and to 12.2 °C in the southeastern part. General climatic conditions abruptly change from very humid at the northern limit to the Mediterranean-like climate in the southern part. Maximum precipitation occurs in September-December in the north and March-May in the south ([26]).
The study area is mainly covered by brown forest soils with relatively thick humus layer ([14]). Based on the TAVO soil map ([57]), northern lowlands is dominated by fluvisol formed by alluvial deposits, while cambisol is the most widespread soil type in the area. Bedrock is a late Quaternary (Maastrichtian) sedimentary rocks and limestones spread over most parts of the area.
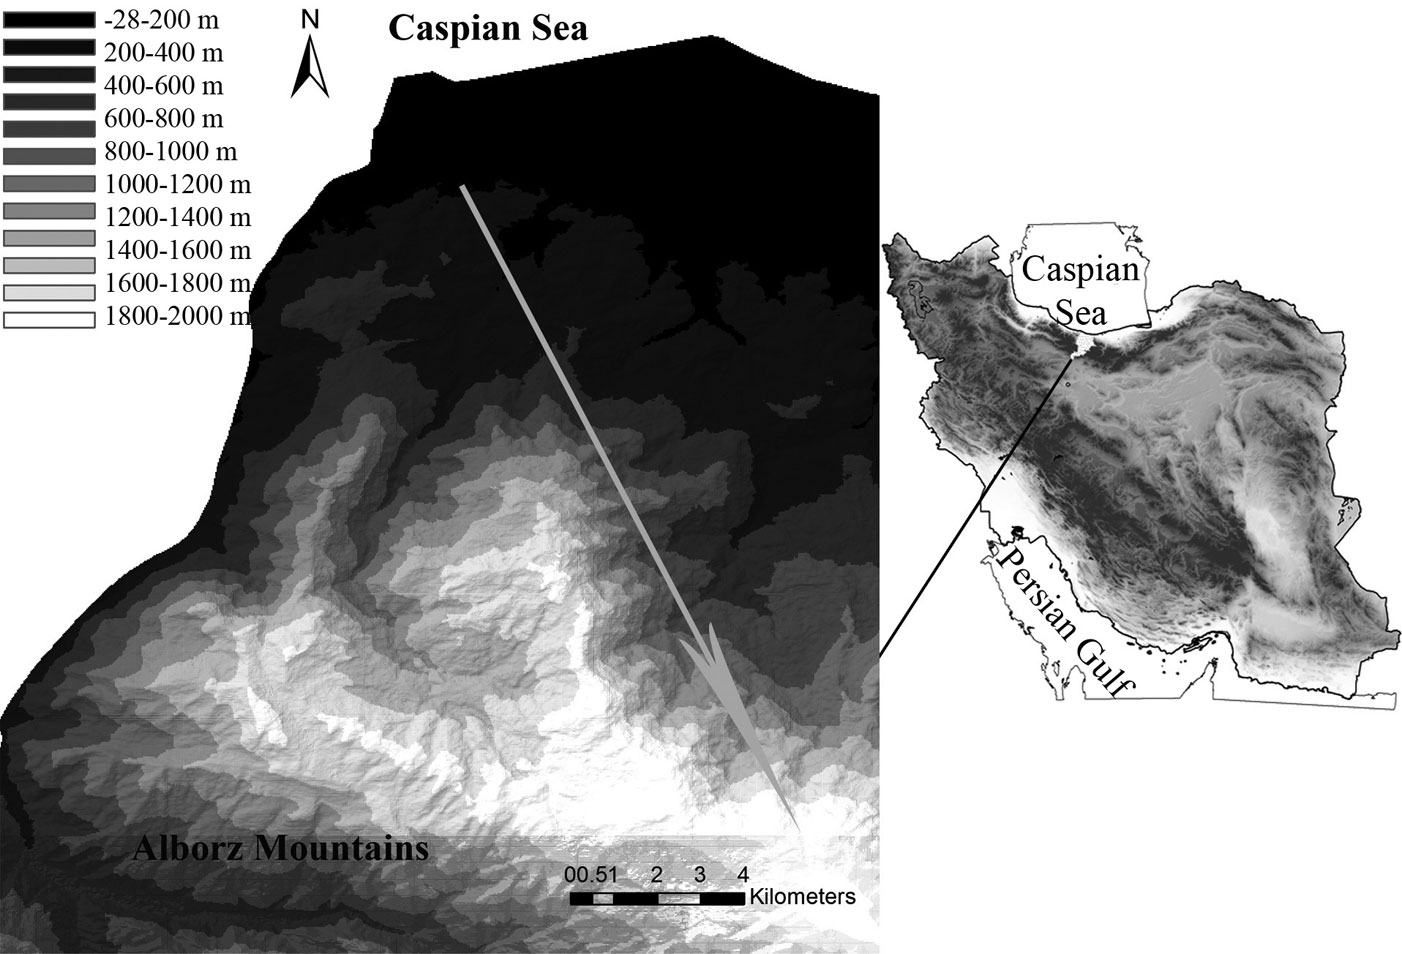
In order to address our objectives, a 2400 m altitudinal gradient was selected in the Hyrcanian forest ecosystem in the Central Alborz Protected Area, northern Iran (Fig. 1). The selected gradient spans from the lowland deciduous forest at lower elevations to the montane deciduous forest at upper elevations. Lowland forests roughly extend from 0 to 800 m a.s.l. and is characterized by semi-tropical climatic conditions. It is dominated by cold sensitive taxa such as Parrotia persica C.A.Mey, Quercus castaneifolia C.A. Mey., Carpinus betulus L., Acer velutinum Boiss., Tilia platyphyllos Scop. and evergreen broadleaf shrubs such as Buxus hyrcana Pojark. and Prunus laurocerasus L. Montane forests is more heterogeneous and dominates above 1600 m a.s.l. It is mainly characterized by the presence of Fagus orientalis Lipsky at mid-altitudes, Quercus macranthera Fisch. & C.A.Mey. at higher elevations, and a transitional Fagus-Quercus forest vegetation in between.
Fig. 1 - Geographic location of the study area in northern Iran, with the elevation transect (grey arrow) located on the Central Alborz Mountains.
Major land use/land cover categories in lowlands are deciduous forest, orchards, agriculture and urban land cover classes. Mid-altitude habitats are characterized by deciduous forests, fragmented to some extent due to local husbandry and ranching activities in forest openings. Lowland forests have been subject to anthropogenic disturbance during last few decades due to easy accessibility ([50]). Generally, disturbance intensity decreases from lowland to mid-altitudes, and increases again in montane forests ([27]). The montane forests are characterized by a lower stem density, and gradually shifts into montane shrublands and rangelands, due to the increasing intensity of grazing with the elevation.
Sampling
Based on the results of former floristic and vegetation studies ([27]), the selected gradient was split in three altitudinal zones (0-800 m, 800-1600 m, 1600-2400 m a.s.l.) covered by lowland (LoF), mid-altitude (MiF) and montane (MoF) forests, respectively. Each zone was further divided in four 200 m altitudinal belts, and 4 to 7 sampling plots (20 × 20 m - 400 m2) were established within each belt in homogenous, mature and undisturbed forest stands (Tab. 1). Overall, 67 sampling plots were established along the above gradient.
Tab. 1 - Characteristics of the elevational belts considered along the main altitudinal gradient in the Hyrcanian forest. (LoF): Lowland Forest; (MiF): Mid-altitude Forest; (MoF): Montane Forest.
| Elevational belt | Altitudinal range (m) | Surface Area (m2) |
Plots | No. Species |
Vegetation Type |
|---|---|---|---|---|---|
| Belt1 | 0-200 | 52 192 295.40 | 5 | 92 | LoF |
| Belt2 | 200-400 | 59 860 284.44 | 7 | 87 | LoF |
| Belt3 | 400-600 | 56 189 891.22 | 7 | 89 | LoF |
| Belt4 | 600-800 | 54 236 731.49 | 5 | 81 | LoF |
| Belt5 | 800-1000 | 54 298 613.78 | 5 | 70 | MiF |
| Belt6 | 1000-1200 | 56 390 235.12 | 7 | 71 | MiF |
| Belt7 | 1200-1400 | 60 473 692.62 | 7 | 73 | MiF |
| Belt8 | 1400-1600 | 65 444 387.42 | 7 | 71 | MiF |
| Belt9 | 1600-1800 | 39 392 717.61 | 5 | 69 | MoF |
| Belt10 | 1800-2000 | 20 546 466.74 | 4 | 64 | MoF |
| Belt11 | 2000-2200 | 10 217 539.31 | 4 | 52 | MoF |
| Belt12 | 2200-2400 | 2 856 641.13 | 4 | 40 | MoF |
Vegetation and species composition for each plot were recorded during 2009-2010 vegetative seasons using the Braun-Blanquet approach ([9]). Diameter at breast height (DBH) and tree ring width data were used to estimate the age of dominant forest species. Overall, 174 species of vascular plants were recorded (see Appendix 1). Taxonomic status of all taxa was double checked using published and online resources ([11]).
Plant functional traits
Plant traits related to physiognomy, productivity, competitive ability, dispersal and reproduction were considered in this analysis (Tab. 2). For each species in each plot three mature leaves were collected, and the leaf area measured by scanning using the image analyzer CANQV EZF LSA software ([6]). Maximum plant height was assessed for each species in each plot using standard stick methods, and then averaged over plots to obtain a mean value for each species in each belt. As for pollination mechanism, species were assigned to the categories listed in Tab. 2 based on the information obtained from available databases (such as BJPMFMPSF plant trait database - [31], and IOUFSADUJPO WFB DAUABACF), except for 7 species for which it was determined based on field observations. For 5 species no information was available at all. Mean seed weight for each species was obtained from the SFFE IOGPSNAUJPO DAUABACF ([53]) and LEDA TSAJUBACF ([30]). The seed weight trait represents the weight of 1000 seeds in gram. For plant taxa not listed in the above databases, the mean value of the closest relative species (when available) was considered. Each species was assigned to life form categories based on the authors’ field experience and checked a posteriori using online resources ([31], [30]).
Tab. 2 - Plant functional traits related to plant physiognomy, competitive ability and dispersal in Hyrcanian forest ([4], [30], [31], [52], [53]). (a): Quantitative traits were transformed to multi-class traits for GLM analysis.
| Trait group | Trait Type | Traits |
|---|---|---|
| Life form | Categorical | Phanerophyte (LFPhan), Chamaephyte (LFCham), Hemicryptophyte (LFHemi), Geophyte (LFGeop), Therophyte (LFTher), Fern (LFFern), Liana/Climber (LFLian), Hydrophyte (LFHydr) |
| Maximum Height | Quantitative | MH (m) [Categories: MH1 (<0.5 m), MH2 (0.5-1 m), MH3 (1-6 m), MH4 (6-20 m), MH5 (>20 m) |
| Leaf Type | Categorical | Simple leaves (LTSimp), Compound leaves (LTComp) |
| Mean Leaf Area |
Quantitative | MLA (cm2) [Categories: MLA1 (<1 cm2 ), MLA2 (1-2 cm2 ), MLA3 (2-4 cm2 ), MLA4 (4-6 cm2 ), MLA5 (6-8 cm2 ), MLA6 (8-10 cm2 ), MLA7 (10-15 cm2 ), MLA8 (15-25 cm2 ), MLA9 (25-40 cm2 ), MLA10 (40-70 cm2 ), MLA11 (70-100 cm2 ), MLA12 (100-200 cm2 ), MLA13 (>200 cm2 ) |
| Seasonality | Categorical | Woody deciduous (SWDeci), Woody evergreen (SWEver), Perennial (SPere), Biennial (SBien), Annual (SAnnu) |
| Fruit type | Categorical | Fleshy (FTFles), Dry Dehiscent (FTDDe), Dry Indehiscent (FTDIn), Without Fruit (FTNone) |
| Pollination | Categorical | Entomophily (PEnto), Anemophily (PAnem), Hydrophily (PHydr), Self-Pollination (PSelf) |
| Seed Weight | Quantitative | SW (mg of 1000 seeds). Categories: SW1 (<1 mg), SW2 (1-2 mg), SW3 (2-3 mg), SW4 (3-4 mg), SW5 (4-5 mg), SW6 (5-10 mg), SW7 (10-20 mg), SW8 (20-50 mg), SW9 (50-100 mg), SW10 (100-200 mg), SW11 (>200 mg), SW12 (No seeds) |
Data nalysis
Values for quantitative traits were grouped into categorical classes. Categorization was primarily implemented using frequency of range values within our dataset.
Data collected were arranged in two “state” matrices of 174 species × 12 belts and 174 species × 60 traits, and then combined to obtain a 12 belts × 60 traits state matrix, according to the method proposed by Diaz et al. ([16]). Cover-abundance values for each species were averaged over plots in each belt and used as belt-wise weighting factor in that belt. After weighting species in each belt, the frequency of each trait category was calculated and converted to proportion, and then transformed by the arcsine function prior to analysis ([56]).
A generalized linear model function (normal distribution with identity link) was applied by the software package SPSS 20.0 ([25]) using the proportion of the trait states as dependent variable, and the mean elevation of each belt as predictor.
In order to analyze the variation in the composition of functional traits along the elevation gradient, principal coordinate analysis (PCoA - [22]) was applied on a pairwise belt-to-belt dissimilarity matrix based on Gower’s coefficients (because of the categorical nature of the dataset - [23]) using the PAST software package ([24]). UPGMA clustering method using the Gower’s coefficient matrix was adopted to re-test the PCoA results. In addition, several functional metrics, such as the modified attribute functional diversity (MFAD - [55]) and the community based functional diversity index (FDc - [48]), were calculated for each altitudinal belt using the FDJWFSCJUZ software ([10]) and then compared. MFAD may take values in the range 0-1 and it was calculated as follows ([49] - eqn. 1):
where dij is the Gowers’ dissimilarity between functional units i and j, and N is the number of functional units. This index reduces the matrix dimensions by summarizing similar species as functional units, providing a simple numerical index to compare communities in the functional space ([55]). FDc is a dendrogram-based index, and equals the total length of the branches of the dendrogram constructed from information on species functional traits ([48]). Moreover, Shannon’s index of taxonomic diversity (H′) was calculated for each belt as follows (eqn. 2):
where pi is the relative importance value of the i-th species and S is the total number of species.
Results
Leaf size and type
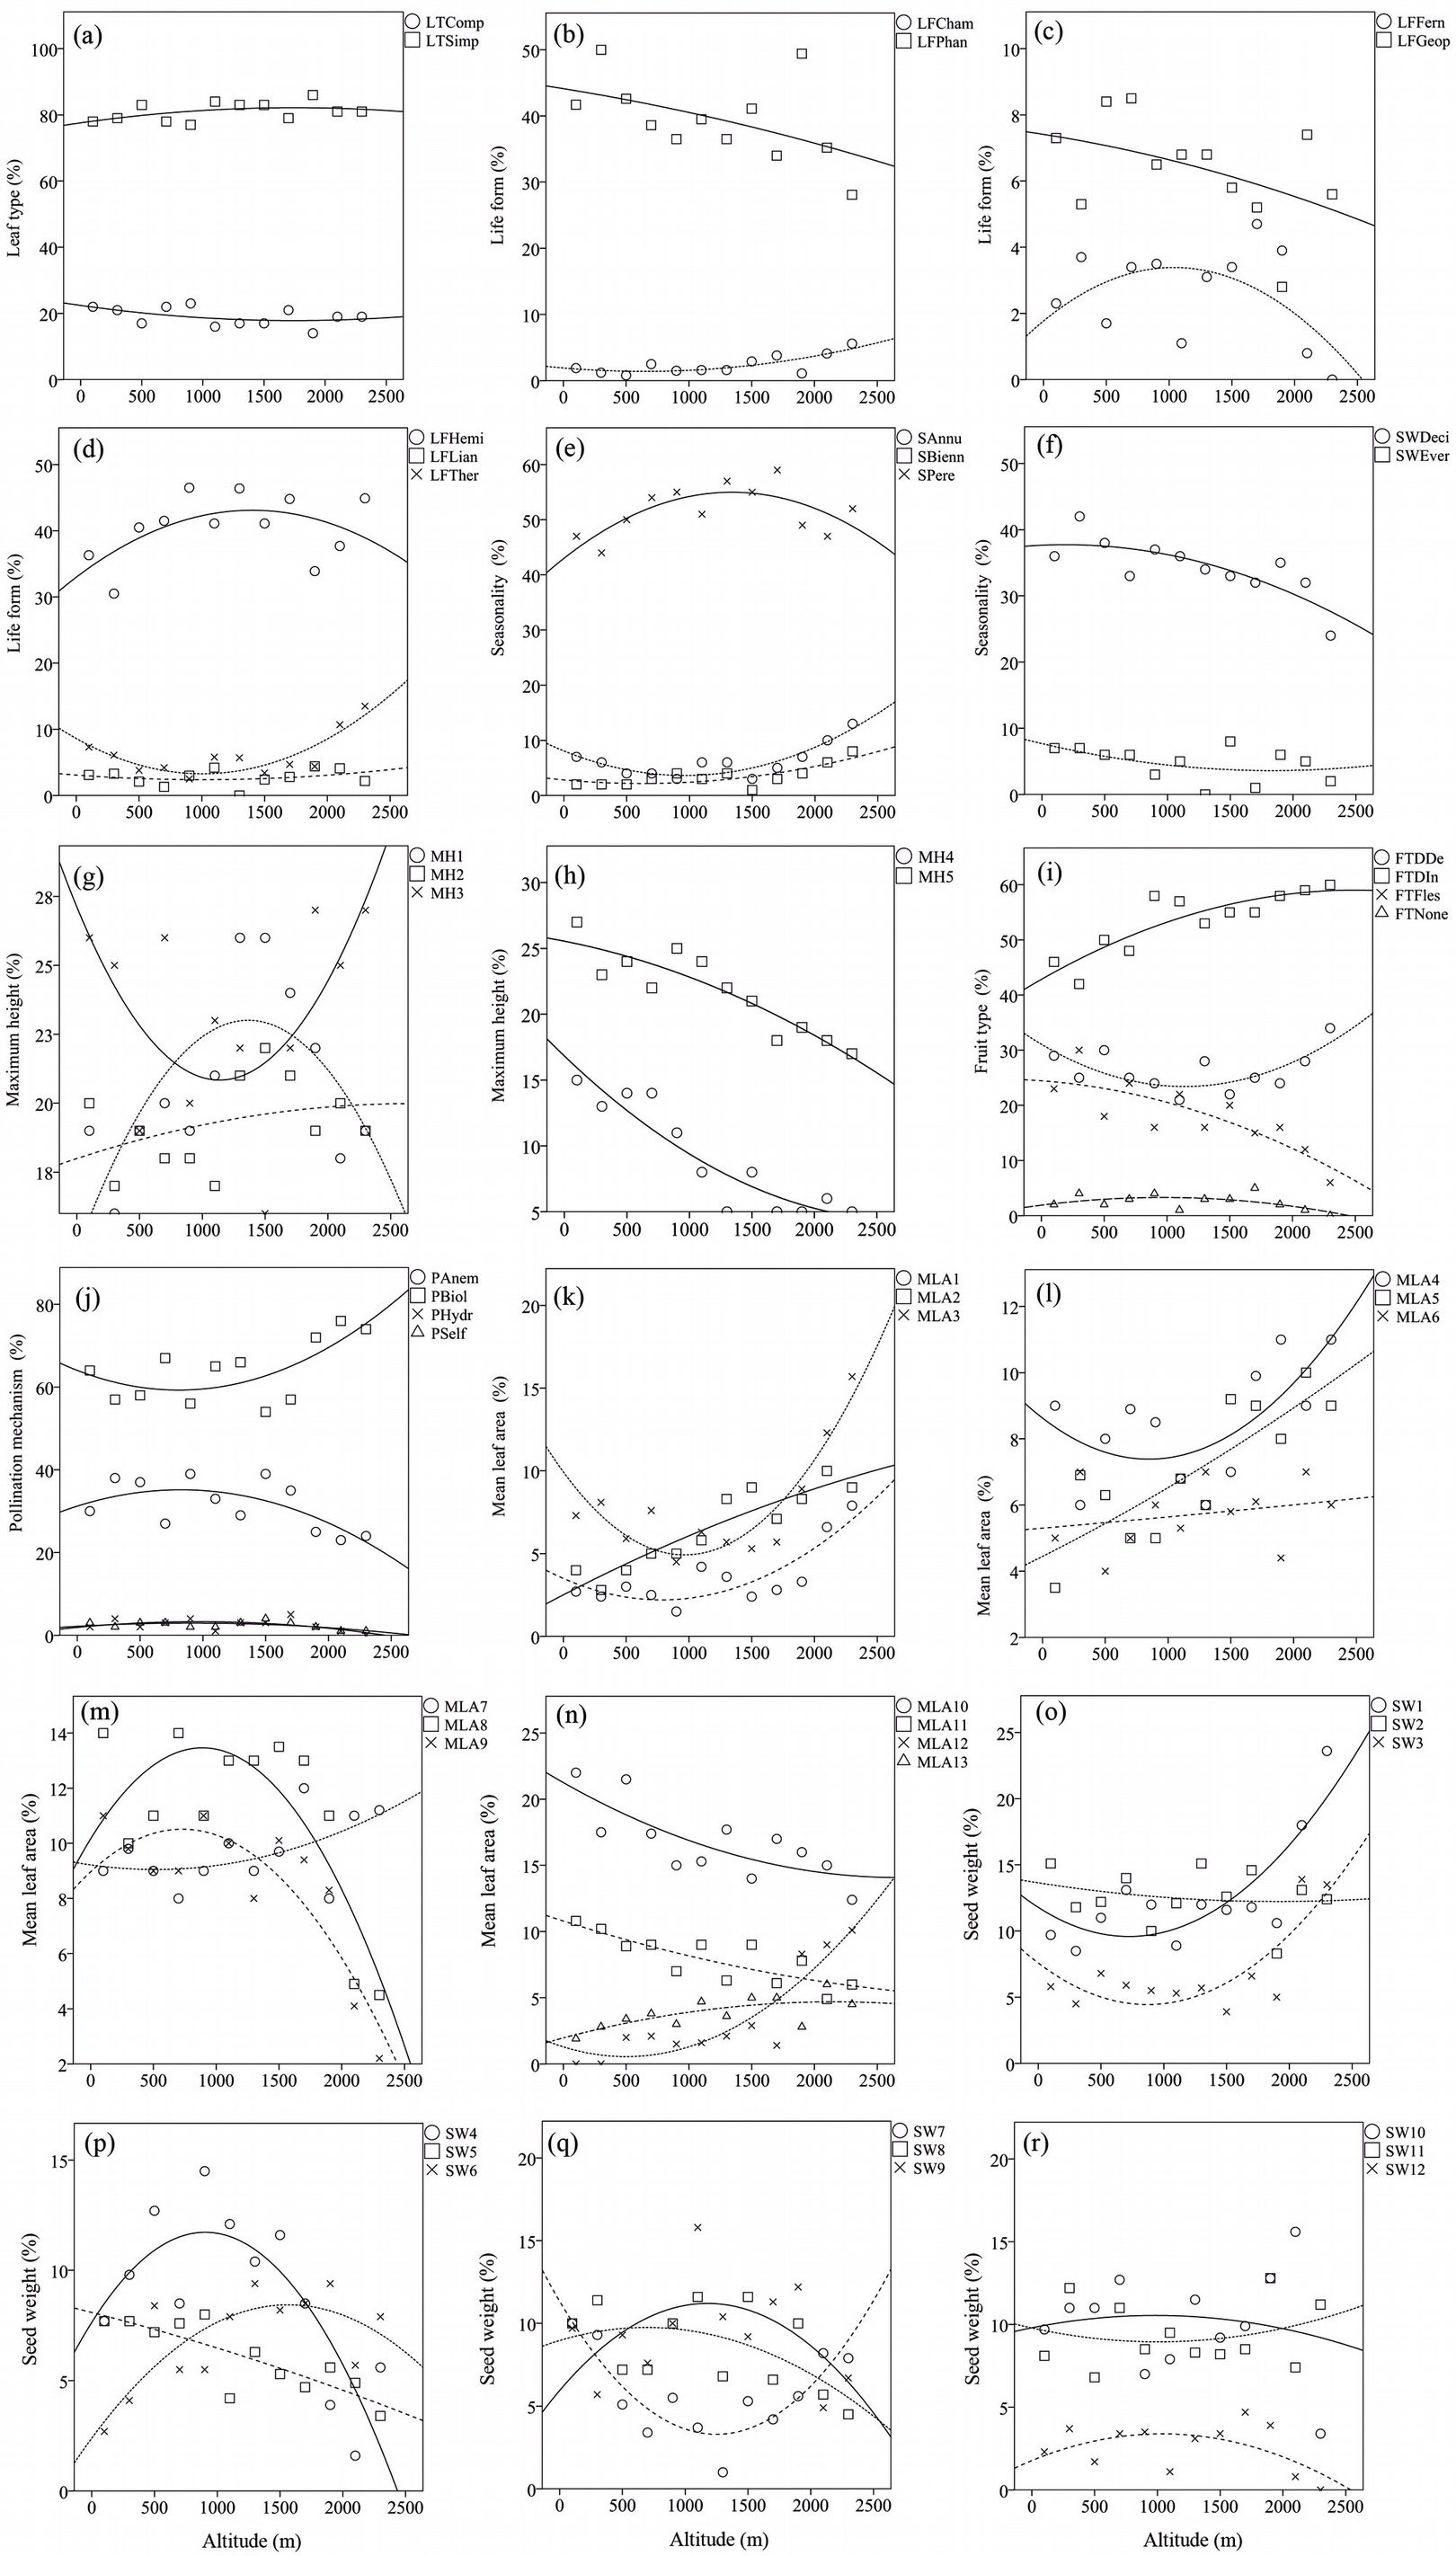
Despite the prevalence of species with simple leaf type in comparison with compound leaf type in both lowland and montane forests, the proportion of both leaf types showed negligible changes with altitude and forest type (Tab. 3, Fig. 2a). The relative abundance of medium and large leaf classes (MLA8, MLA10, MLA11, MLA12 and MLA13) showed a meaningful negative correlation with altitude (Tab. 3, Fig. 2m, n). The proportion of small leaved species significantly increased from lowland to montane forests (MLA1: B=3.921, P<0.05; MLA2: B=4.835, P<0.05; MLA3: B=4.119, P<0.05; MLA4: B=5.667, P<0.05) (Fig. 2k, l). Patterns of change at mid-altitudes for mean leaf area trait differed from the patterns at the gradient extremes. For example, an increase in the frequency of classes MLA8, MLA9 and MLA13 was observed at mid elevations, as well as a reduction in proportion for classes MLA3, MLA4 and MLA11 (Fig. 2k, l, m, n).
Tab. 3 - Generalized linear model correlation between proportion of plant functional traits and altitude in the Hyrcanian forest. (WMP): Weighted mean proportion; (LF): Lowland forest; (MF): Montane forest. (*): p<0.05; (**): p<0.01; (***): p<0.001.
| Trait group |
Trait | Altitude | LF | MF | |
|---|---|---|---|---|---|
| B | P-value | ||||
| Leaf type | Simple leaf (LTSimp) | 2.093 | 0.150 | 0.800 | 0.820 |
| Compound leaf (LTComp) | -2.093 | 0.150 | 0.200 | 0.180 | |
| Life form | Phanerophyte (LFPhan) | -4.509 | 0.061 | 0.432 | 0.366 |
| Chamaephyte (LFCham) | 4.187 | 0.005** | 0.017 | 0.037 | |
| Hemicryptophyte (LFHemi) | 2.146 | 0.323 | 0.372 | 0.403 | |
| Geophyte (LFGeop) | -2.180 | 0.107 | 0.073 | 0.052 | |
| Therophyte (LFTher) | 3.718 | 0.130 | 0.053 | 0.083 | |
| Fern (LFFern) | -3.331 | 0.183 | 0.027 | 0.023 | |
| Liana/climber (LFLian) | 6.124 | 0.806 | 0.024 | 0.033 | |
| Maximum height | Maximum Height <0.5 m (MH1) | 4.186 | 0.045 | 0.126 | 0.351 |
| Maximum Height 0.5-1 m (MH2) | 9.721 | 0.563 | 0.193 | 0.216 | |
| Maximum Height 1-6 m (MH3) | -6.315 | 0.055 | 0.294 | 0.204 | |
| Maximum Height 6-20 m (MH4) | -4.260 | 0.038* | 0.173 | 0.054 | |
| Maximum Height > 20 m (MH5) | -6.750 | 0.061 | 0.241 | 0.198 | |
| Mean leaf area |
Mean Leaf Area < 1 cm2 (MLA1) | 3.921 | 0.000*** | 0.031 | 0.213 |
| Mean Leaf Area 1-2 cm2 (MLA2) | 4.835 | 0.002** | 0.042 | 0.097 | |
| Mean Leaf Area 2-4 cm2 (MLA3) | 4.119 | 0.031* | 0.034 | 0.123 | |
| Mean Leaf Area 4-6 cm2 (MLA4) | 5.667 | 0.022* | 0.065 | 0.164 | |
| Mean Leaf Area 6-8 cm2 (MLA5) | 9.998 | 0.835 | 0.048 | 0.051 | |
| Mean Leaf Area 8-10 cm2 (MLA6) | 2.931 | 0.051 | 0.050 | 0.081 | |
| Mean Leaf Area 10-15 cm2 (MLA7) | 8.789 | 0.221 | 0.113 | 0.115 | |
| Mean Leaf Area 15-25 cm2 (MLA8) | -6.002 | 0.048* | 0.211 | 0.125 | |
| Mean Leaf Area 25-40 cm2 (MLA9) | 5.128 | 0.128 | 0.109 | 0.111 | |
| Mean Leaf Area 40-70 cm2 (MLA10) | -5.660 | 0.001** | 0.357 | 0.114 | |
| Mean Leaf Area 70-100 cm2 (MLA11) | -2.732 | 0.019* | 0.182 | 0.0.91 | |
| Mean Leaf Area 100-200 cm2 (MLA12) | -6.543 | 0.030* | 0.110 | 0.070 | |
| Mean Leaf Area > 200 cm2 (MLA13) | -2.211 | 0.004** | 0.029 | 0.033 | |
| Seasonality | Woody deciduous (SWDeci) | -3.854 | 0.028* | 0.375 | 0.327 |
| Woody evergreen (SWEver) | -3.397 | 0.338 | 0.065 | 0.040 | |
| Perennial (SPere) | 1.276 | 0.580 | 0.485 | 0.502 | |
| Biennial (SBienn) | 3.678 | 0.025* | 0.025 | 0.047 | |
| Annual (SAnnu) | 3.718 | 0.130 | 0.052 | 0.085 | |
| Fruit type | Fleshy (FTFles) | -7.730 | 0.016* | 0.230 | 0.146 |
| Dry dehiscent (FTDDe) | 2.447 | 0.923 | 0.266 | 0.262 | |
| Dry indehiscent (FTDIn) | 5.595 | 0.001** | 0.475 | 0.567 | |
| Without fruit (FTNone) | -3.331 | 0.183 | 0.027 | 0.023 | |
| Pollination mechanism |
Entomophily (PEnto) | 5.485 | 0.926 | 0.612 | 0.582 |
| Anemophily (PAnem) | -5.923 | 0.052 | 0.330 | 0.250 | |
| Hydrophily (PHydr) | 4.387 | 0.623 | 0.027 | 0.015 | |
| Self-pollination (PSelf) | -5.148 | 0.052 | 0.032 | 0.017 | |
| Seed weight (mg x 1000 seeds) |
Seed weight < 1 mg (SW1) | 5.442 | 0.002** | 0.107 | 0.162 |
| Seed weight 1-2 mg (SW2) | -8.663 | 0.518 | 0.132 | 0.120 | |
| Seed weight 2-3 mg (SW3) | 4.854 | 0.030* | 0.060 | 0.010 | |
| Seed weight 3-4 mg (SW4) | -6.981 | 0.021* | 0.010 | 0.052 | |
| Seed weight 4-5 mg (SW5) | -4.421 | 0.000*** | 0.077 | 0.047 | |
| Seed weight 5-10 mg (SW6) | 4.558 | 0.012* | 0.052 | 0.080 | |
| Seed weight 10-20 mg (SW7) | -9.338 | 0.776 | 0.067 | 0.065 | |
| Seed weight 20-50 mg (SW8) | -3.489 | 0.056 | 0.087 | 0.070 | |
| Seed weight 50-100 mg(SW9) | -5.038 | 0.830 | 0.082 | 0.087 | |
| Seed weight 100-200 mg (SW10) | -1.529 | 0.556 | 0.112 | 0.105 | |
| Seed weight > 200 mg (SW11) | 5.667 | 0.701 | 0.095 | 0.100 | |
| No seeds (SW12) | -8.427 | 0.101 | 0.027 | 0.025 | |
Fig. 2 - Variation of trait proportions along the studied elevation gradient. The weighted proportions of traits (Y-axis) are plotted against elevation (X-axis).
Life form, seasonality and maximum height
As for life form traits, the importance of geophytes and ferns showed a non-significant decrease with elevation (B = -2.180, P = 0.107; B = -3.331, P = 0.183, respectively - Fig. 2b, c). Moreover, ferns do not produce fruits and the proportion of the “FTNone” class decreased non-significantly with altitude (B = -3.331, P = 0.183). On the contrary, the proportion of chamaephytes significantly increased with altitude along the gradient (B = 4.187, P < 0.05). Generally, phanerophytes showed non-significant (or marginally significant) relationship with altitude (B = -4.509, P = 0.061). However, a significant decrease of woody deciduous taxa (B = -3.854, P < 0.05) was observed from lowland to high altitude forests (Fig. 2f). Furthermore, a non-significant variation in the proportion of woody evergreens (usually shrubs, e.g., phanerophyte or chamaephyte life forms) was detected along the altitudinal gradient (B = -3.397, P = 0.338 - Fig. 2f).
Annual species or therophytes showed a non-significant but non-negligible increase in proportion from lowland to montane forests (B = 3.718, P = 0.130). Hemicryptophytes (including forbs and non-rhizomatous grasses) were dominant in both vegetation types and their importance rises from lowland to montane type (0.372 vs. 0.403 WMP - Tab. 3, Fig. 2d, e). Generally, the proportion of herbaceous taxa (including annual, biennial and perennial species) increased non-linearly with altitude, while perennials and annuals showed an opposite pattern of change at mid-altitudes. In contrast to perennials, annuals decreased in proportion at mid-altitude sites, then rise up again in the montane forest type (Fig. 2e).
Concerning maximum height, all classes showed a significant correlation with altitude (Fig. 2g, h), except MH2 (0.5 to 1 m). For example, herbaceous plants (class MH1) increase their importance along the altitudinal gradient (B = 4.186, P < 0.05). Shrub species (MH3, 1-6 m of maximum height) presented a small decrease from low to high altitudes (0.296 to 0.256 WMP). As expected, tall woody plants (MH4 and MH5) significantly decrease in importance with altitude (Fig. 2h, Tab. 3).
Fruit, pollination and seed traits
Fleshy fruit species significantly decreased (B = -7.730, P < 0.05) along the gradient from lowland to montane forests, while dry indehiscent fruit showed a significant increase (B = 5.595, P < 0.05 - Fig. 2i).
As for pollination types, the percentage of the anemophilous and self-pollinating species showed a significant decrease with altitude (B = -5.923, P < 0.05; B = -5.148, P < 0.05, respectively). As for the latter category (PSelf), this could be due to low number of self-pollinating species (7) found in the lowland forest type (Fig. 2j). On the other hand, the proportion of insect-pollinated species decreased from lowland to mid-altitude forests (0.612 to 0.602 WMP), and increased from mid-altitude up to the timberline forests (0.602 to 0.750 WMP).
The proportion of tiny seed species (classes SW1 to SW3) showed a positive correlation with elevation, increasing significantly from low to high altitudes (Fig. 2o). The proportion of small-medium sized and medium sized seeds decreased along the gradient (e.g., SW4: B = -6.981, P < 0.05; SW5: B = -4.421, P < 0.05; SW8: B = -3.489, P < 0.05 - Fig. 2p, q). The importance of large seeds decreased (though not significantly) with elevation (Fig. 2r). On the contrary, mid-altitude pattern of variation for SW4 and SW7 was completely different, in that the proportion of seeds with 3-4 mg and 10-20 mg weight reached their maximum and minimum values at mid-altitudes, respectively.
Multivariate analysis of functional diversity
Principal coordinate analysis revealed remarkable differences among the altitudinal belts (Fig. 3a). The first two axes accounted for 73 % of the total variation in functional trait composition. The first axis (variance accounted for: 52.9%) may be clearly interpreted as related to the elevation, since belts are fairly well-distributed along this axis following a forest altitudinal gradient (1-4: lowland > 5-8: mid-altitude > 9-12: montane forest vegetation types). Contrastingly, the second coordinate (variance accounted for: 20.1%) may be interpreted as related to both forest disturbance and diversity in structural parameters. Indeed, the second coordinate clearly separated lowland and montane forest types (belts 1-4 and 9-12) from mid-altitude plant communities (belts 5-8). Concerning belt 9, it is characterized by a transitional vegetation type, and this may explain its intermediate position in the space of the first two coordinates.
Fig. 3 - Multivariate analysis of functional turnover along the altitudinal gradient in Hyrcanian forest. Principal coordinate analysis (a) and cluster analysis (b) clearly revealed functional differences between lowland (belts1-4) and montane (belts 9-12) forest types.
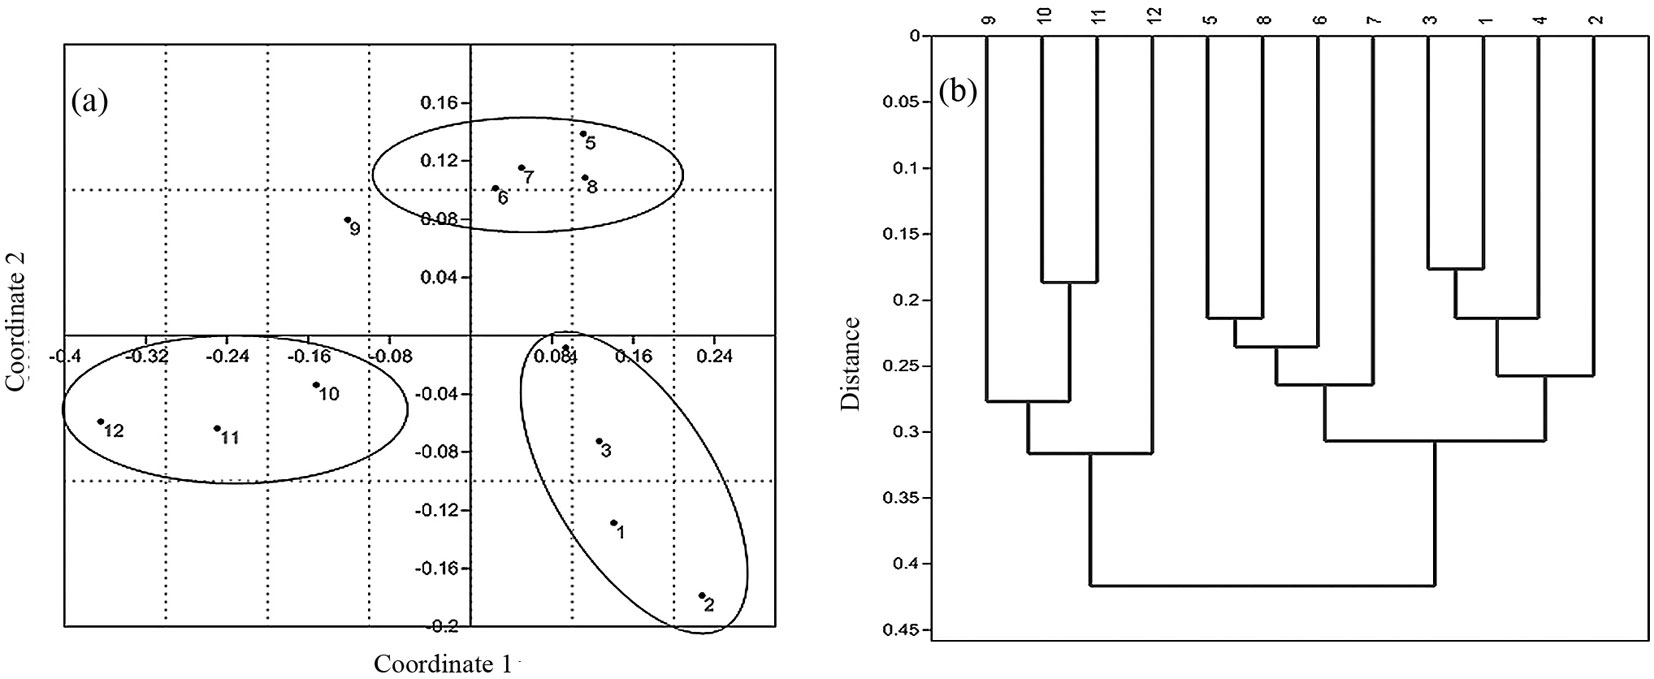
Cluster analysis using paired-group algorithm further supported the pattern observed by the principal coordinate analysis, clearly distinguishing the three forest types (Fig. 3b).
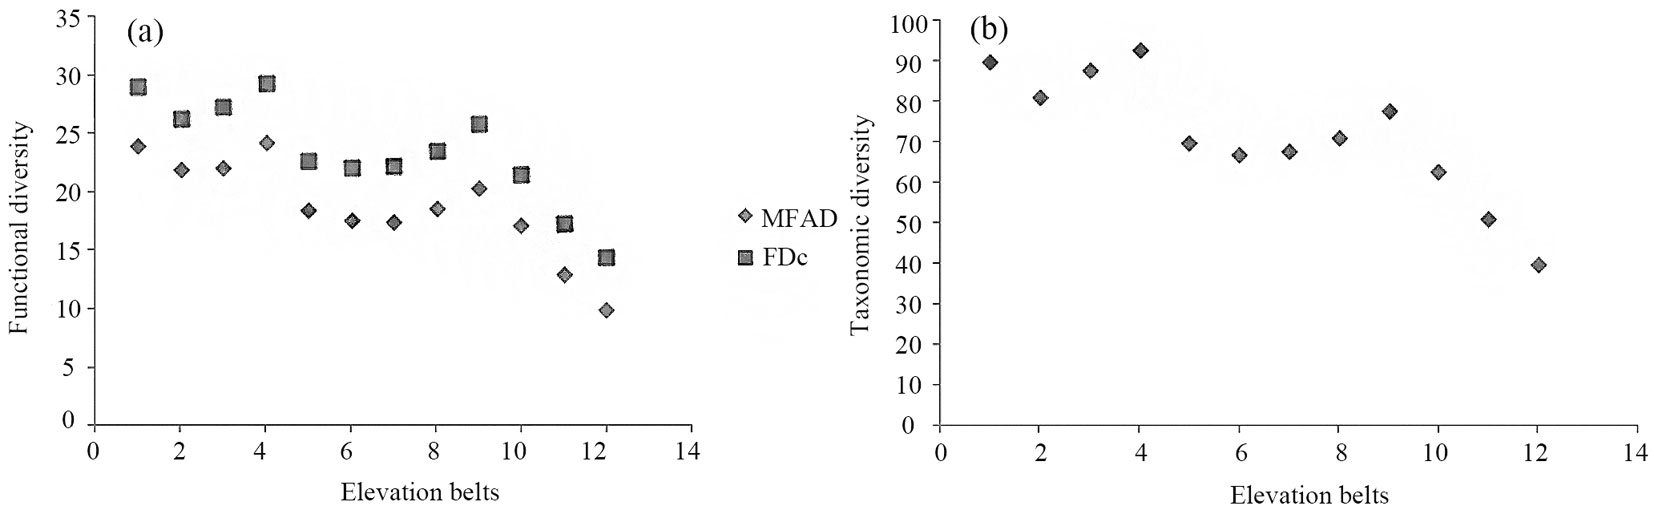
Based on the obtained results, lowland forest vegetation was more similar in functional trait composition to mid-altitude forest communities. Likely, this was due to the high number of “key” linking species shared by the mentioned vegetation types. Among shared key species with high importance values, Fagus orientalis and, to a lesser extent, Acer velutinum and Quercus castaneifolia, are worth to be mentioned. Generally, functional diversity decreased from lowland to montane forest vegetation types (Fig. 4a). Such trend fully agrees with the observed pattern for taxonomic diversity (Fig. 4b). Finally, average values of MFAD, FDc and Shannon’s index clearly distinguished lowland, mid-altitude and montane forest types.
Fig. 4 - Pattern of functional (a) and taxonomic diversity (b) along the altitudinal gradient studied in the Hyrcanian forest. (MFAD): Modified Functional Attribute Diversity, (FDc): community based Functional Diversity.
Discussion
Traits and altitude
The dominance of simple leaf type species at both lowland and high altitudes is probably due to taxonomic and historical reasons. Compound leaf trait is mainly represented in this study by three different functional groups: (1) woody taxa including Albizia julibrissin Durazz., Pterocarya fraxinifolia and Gleditsia caspica Desf.; (2) ferns, for which the fronds were considered as compound leaves; (3) herbaceous taxa of Fabaceae and Rosaceae. The high importance values of these groups in lowland forests may therefore be due by the higher proportion of such taxa in lowland forest. In this study, we did not find sufficient evidences to discuss about two major theories related to evolution of compound leaf trait (rapid growth and seasonal drought hypotheses - [41]). General decrease of leaf size from lowland to montane forest is probably related to the warmer, more shady and humid conditions occurring in lowland forests. Moreover, considering the observed patterns for life form and seasonality traits under the Corner’s rule scenario ([12]), the observed decrease in leaf size with altitude was expected to some extent. Leaf size decreases in response to stressful condition of higher altitude as compared with the resource-rich condition and fertile soil of lowland forests ([3]).
Generally, phanerophytes need more humidity, deeper soils and a longer vegetative season to complete their annual growth. In contrast, chamaephyte life form is a prominent adaptation to wind and grazing stresses, and shorter season length as well. Soil depth ([17]), length of the growing season ([32]) and humidity ([28]) decrease with the altitude in the Hyrcanian forest. Moreover, forest openings above 1800 m a.s.l. imply higher wind speed and easy accessibility for grazing and trampling. As a consequence, the dominance of phanerophytes in lowland and an increasing frequency of chamaephytes along altitudinal gradients are expected based on the above ecological considerations. Altitudinal distribution of broad-leaved evergreen taxa is probably limited by the duration of low temperature period in winter which increases with altitude in the study area ([1], [60]). Herb layer of montane forest vegetation hosts higher proportion of therophytes, contrasting with the accepted trend for high altitude ecosystems ([32]). Low competition for light and disturbances (e.g., grazing and local timber harvesting) are factors favoring a higher proportion of therophytes in understory vegetation layer ([42]).
Taller plants may intercept more light in closed forest ecosystems ([54], [62]). A decrease in plant height with elevation has been observed in several regions ([29]). However, the use of elevation as an environmental predictor of plant height is still under debate ([45]). Indeed, Moles et al. ([45]) found that the precipitation of the wettest month was an efficient predictor of plant height. Based on such evidence, we may expect taller plants in the lowland forest types analyzed in this study. Decrease in forest density lessens the competition for light and implies high wind speed and irradiance at higher altitudes. Such factors may trigger an overall reduction of plant height, even within life form classes.
Increasing pattern of dry indehiscent fruits is clearly influenced by dominant species in montane forests (e.g., Fagus orientalis Lipsky, Carpinus orientalis Mill., Quercus macranthera Fisch. and C.A.Mey. and Acer hyrcanum Fisch. and C.A.Mey.), which mostly produce dry indehiscent fruits, especially achenes. There are two hypotheses which may explain the evolution of fleshy fruits, including fruit shift and habitat shift theories ([8]). Central to both theories is that evolution of fleshy fruits coincides with the appearance of closed forest ecosystems in early Tertiary period. Proportion of fleshy fruits dramatically decreases from lowland closed forests to montane open forests. If the above theory holds, forest opening at higher elevations decreases the need of fruits to be a fleshy reward for dispersers. Genera belonging to the Rosaceae family, such as Crataegus, Rubus, Mespilus and Prunus, cladode-bearing plants such as Ruscus and Danae and some other groups such as Diospyros, Cornus, Celtis and Frangula, all producing fleshy fruits, are mostly abundant in lowland forests. Therefore, based on the above considerations and on the ecological costs of producing fleshy fruits, we can expect a lower frequency of such species at higher altitudes.
Anemophilous pollination depends on wind and subsequently increases with both altitude and latitude ([46]). Pollination of anemophilous taxa in temperate deciduous forests occurs earlier than for non-anemophilous taxa, before leaf flushing ([61]). In this study, lowland forests were dominated by anemophilous woody taxa, therefore a decreasing pattern of the wind pollination trait was observed along the elevation gradient ([20]). Contrastingly, biotic pollination is usually associated with closed habitats, though this trait showed non-significant changes with altitude in our study. The constant closeness of forest canopy along the elevation gradient may have contributed in this pattern.
It has been proposed that shaded environments such as tropical forest ecosystem may host species with larger seeds than less shaded habitats ([36]). Lowland forests in in the study area area present semi-tropical conditions such as closeness, high temperature and moisture. In addition, parameters such as plant size ([5]), growth form ([39]), dispersal mechanism ([40]), length of the growing season and primary productivity ([43]) can influence seed mass and size. In the present study, overall larger size (e.g., higher maximum height) and longer growing season in lowland forests may favor taxa with heavier seeds. Moreover, vertebrate-dispersed species such as those carrying fleshy fruits normally carry also larger seeds ([37]), which are represented in higher proportion in the lowland forest type. In contrast, tiny seeds generally increase with altitude in our study, and this may be due to a shorter growing season, stressful conditions, dominance of smaller life forms and non-vertebrates dispersers in the montane forest vegetation type ([44]).
Functional diversity
Diversity along environmental gradients has often been investigated ([51]) and vegetation types are usually considered as explanatory factors ([47]). In this study, we sought for differences in trait composition and functional diversity between lowland and montane forest vegetation types. Principal coordinate analysis revealed a remarkable difference in functional trait composition among the altitudinal belts considered (Fig. 3a). Elevation seems to explain fairly well the main functional trait variation in the study area, as it can be inferred from the distribution of belts along the first axis from lowland to montane forest types. The obtained dendrogram (Fig. 3b) corroborates these results. Along with species richness (Tab. 1), trait composition in both forest types remarkably differs. Functional diversity is an indicator of the complexity of relationships between species diversity and ecosystem processes ([48]). Climax communities in a stable environment represent maximum capacity of interaction and complexity ([59]). In this study, lowland forests experience more stable conditions compared to the montane forest type, reflecting in a higher functional and taxonomic diversity in low altitude forests. Generally, frequency and intensity of perturbations or environmental stability, stressful condition, competition for light, wind speed, irradiance, biotic interactions and human interference may play key role in the emergence of specific pattern of plant traits along altitude. Variation of the above factors may favor functional difference between habitats. For eample, logging and harvesting practices may remove key plant species and consequently important functional traits, deeply affecting the ecological functioning of the Hyrcanian forest ecosystem. Therefore, along with floristic and vegetation studies, the exploration of patterns of functional diversity in this ecosystems is of utmost importance.
Acknowledgments
This research was supported by the Research Council of the University of Tehran (Iran). Data collection and taxonomic treatment was partly implemented during a research stay of SMJ at the Botanical Garden and Botanical Museum (BGBM) in Dahlem (Berlin, Germany). The authors thank the Iranian Ministry of Science, Research and Technology and BGBM for providing financial support and facilities for the research stay. Mr. Atabak Roohi is acknowledged for his help in the statistical analysis.
References
Gscholar
Gscholar
Gscholar
Gscholar
Gscholar
Gscholar
CrossRef | Gscholar
Online | Gscholar
Gscholar
CrossRef | Gscholar
CrossRef | Gscholar
Gscholar
Gscholar
Gscholar
Gscholar
Gscholar
Gscholar
Authors’ Info
Authors’ Affiliation
Shahin Zarre
Department of Botany, School of Biology and Center of Excellence in Phylogeny of Living Organisms, College of Science, University of Tehran, P.O. Box 14155-6455, Tehran (Iran)
Department of Cartography, Faculty of Geography, University of Tehran, Enqelab Ave., Vesal St.,Tehran (Iran)
Department of Plant Biology, Faculty of Biological Sciences, Kharazmi University, 43 Dr. Mofatteh Avenue, Tehran (Iran)
Corresponding author
Paper Info
Citation
Jafari SM, Zarre S, Alavipanah SK, Ghahremaninejad F (2015). Functional turnover from lowland to montane forests: evidence from the Hyrcanian forest in northern Iran. iForest 8: 359-367. - doi: 10.3832/ifor1002-008
Academic Editor
Giustino Tonon
Paper history
Received: Apr 02, 2013
Accepted: Mar 30, 2014
First online: Sep 16, 2014
Publication Date: Jun 01, 2015
Publication Time: 5.67 months
Copyright Information
© SISEF - The Italian Society of Silviculture and Forest Ecology 2015
Open Access
This article is distributed under the terms of the Creative Commons Attribution-Non Commercial 4.0 International (https://creativecommons.org/licenses/by-nc/4.0/), which permits unrestricted use, distribution, and reproduction in any medium, provided you give appropriate credit to the original author(s) and the source, provide a link to the Creative Commons license, and indicate if changes were made.

Web Metrics
Breakdown by View Type
Article Usage
Total Article Views: 58100
(from publication date up to now)
Breakdown by View Type
HTML Page Views: 47732
Abstract Page Views: 3987
PDF Downloads: 4610
Citation/Reference Downloads: 18
XML Downloads: 1753
Web Metrics
Days since publication: 4306
Overall contacts: 58100
Avg. contacts per week: 94.45
Article Citations
Article citations are based on data periodically collected from the Clarivate Web of Science web site
(last update: Mar 2025)
Total number of cites (since 2015): 7
Average cites per year: 0.64
Publication Metrics
by Dimensions ©
Articles citing this article
List of the papers citing this article based on CrossRef Cited-by.
Related Contents
iForest Similar Articles
Research Articles
Advantages of the point-intercept method for assessing functional diversity in semi-arid areas
vol. 8, pp. 471-479 (online: 31 October 2014)
Research Articles
Changes in vegetation diversity and composition following livestock removal along an upland elevational gradient
vol. 8, pp. 582-589 (online: 22 April 2015)
Research Articles
Towards a functional phytosociology: the functional ecology of woody diagnostic species and their vegetation classes in Northern Italy
vol. 14, pp. 522-530 (online: 22 November 2021)
Research Articles
Scale dependency of the effects of landscape structure and stand age on species richness and aboveground biomass of tropical dry forests
vol. 16, pp. 234-242 (online: 23 August 2023)
Research Articles
Long-term outcome of precommercial thinning on floristic diversity in north western New Brunswick, Canada
vol. 1, pp. 145-156 (online: 25 November 2008)
Technical Reports
Decision making in forest road planning considering both skidding and road costs: a case study in the Hyrcanian Forest in Iran
vol. 6, pp. 59-64 (online: 21 January 2013)
Research Articles
Relationships between overstory and understory structure and diversity in semi-natural mixed floodplain forests at Bosco Fontana (Italy)
vol. 9, pp. 919-926 (online: 21 August 2016)
Short Communications
Determining Pleiades satellite data capability for tree diversity modeling
vol. 10, pp. 348-352 (online: 19 November 2016)
Research Articles
Trade-offs and spatial variation of functional traits of tree species in a subtropical forest in southern Brazil
vol. 9, pp. 855-859 (online: 07 July 2016)
Research Articles
Influences of mature Pinus nigra plantations on the floristic-vegetational composition along an altitudinal gradient in the central Apennines, Italy
vol. 13, pp. 279-285 (online: 03 July 2020)
iForest Database Search
Search By Author
Search By Keyword
Google Scholar Search
Citing Articles
Search By Author
Search By Keywords
PubMed Search
Search By Author
Search By Keyword


