
Exploring biomass modeling in the Amazon Forest: assessing the effect of sample size of model calibration datasets
iForest - Biogeosciences and Forestry, Volume 19, Issue 4, Pages 261-268 (2026)
doi: https://doi.org/10.3832/ifor4919-019
Published: Jul 21, 2026 - Copyright © 2026 SISEF
Research Articles
Abstract
Tree-level models are commonly used to estimate the mean and total forest aboveground biomass (AGB). However, tree biomass predictions can vary significantly between models due to limited understanding of how calibration datasets influence their performance. The aim was to recommend a sample size for a dataset to calibrate tree biomass models that estimate mean AGB per unit area with the best possible precision and accuracy. The methodology consisted of (i) simulating an Amazonian forest using the Monte Carlo Method (MCM) and m out of n Bootstrap, (ii) estimating the average forest biomass using models calibrated with datasets of varying sample sizes, (iii) analyzing the precision and accuracy of the estimate of the mean AGB in Mg ha-1 per unit area using the models calibrated with different sample sizes, and (iv) relating characteristics of the calibration datasets with the errors produced by the models. Our findings indicate that increasing sample size improves the precision of biomass estimates, with notable gains at 200 trees. The study highlights that larger samples better represent tree diversity and support reliable biomass modeling, which is essential for effective forest management. We conclude that a minimum calibration sample size of 200 trees is sufficient to optimize biomass predictions while balancing practical sampling constraints. These results can aid in developing forest management strategies and improving carbon credit calculations in tropical ecosystems.
Keywords
Forest Simulation, Tree Biomass Modeling, Bootstrap Sampling
Introduction
Tropical forests are essential to the global carbon cycle, sequestering 40%-55% of carbon found in terrestrial plants and making a substantial contribution to primary productivity ([12], [15]). These ecosystems play a crucial role in the context of climate change, serving as significant carbon sinks and influencing atmospheric carbon dynamics ([22]).
To generate carbon credits under the REDD+ program (Reducing Emissions from Deforestation and Forest Degradation), accurate estimates of forest carbon stocks are essential. Efforts in carbon measurement have focused on carbon stocks in forests ([5], [20]), which play a significant role in mitigating climate change by removing CO2 from the atmosphere and storing it in biomass and soil, as well as combating deforestation and forest degradation. These measures allow developing countries with verified greenhouse gas reductions and increased carbon stocks to qualify for results-based payments from international sources, such as the Green Climate Fund (GCF). Therefore, accurate estimates of carbon emissions from these forests necessitate reliable assessments of forest biomass.
The development of pantropical allometric equations has substantially improved biomass estimation across diverse tropical forest types ([11]). Nevertheless, multiple sources of uncertainty still affect the reliability of these estimates, making accurate biomass assessment challenging ([42]). Among these sources of uncertainty, determining the appropriate size of the calibration dataset remains a critical issue. Although larger sample sizes are generally assumed to enhance model accuracy, the relationship between sample size and predictive performance remains poorly understood.
In addition to pantropical allometric equations, forest biomass estimation has increasingly incorporated a broader range of statistical and machine-learning approaches. Traditional parametric models, including linear and nonlinear regressions, remain widely used due to their interpretability and solid theoretical foundation in forest biometrics ([24]). More recently, non-parametric and artificial intelligence-based methods have gained attention for their ability to model complex and nonlinear relationships in biomass prediction ([27], [4]). In particular, Random Forest and other ensemble learning algorithms have been extensively applied to remote sensing-based biomass modeling due to their strong predictive performance and robustness to multicollinearity ([7], [32]). However, despite their flexibility, these methods are sensitive to the quality and representativeness of calibration data, and their predictive performance is strongly influenced by training sample size, reflecting the well-known bias-variance trade-off in statistical learning ([28], [37]). This underscores the need for a deeper understanding of how calibration dataset size influences the reliability and stability of biomass model predictions.
Although biomass can also be estimated using plot-level expansion factors ([39]) or remote sensing-based models ([36]), tree-level calibration remains a fundamental component of forest inventory and carbon accounting. Errors originating at the individual-tree modeling stage may propagate to stand-level estimates, particularly when calibration datasets are limited or unrepresentative ([45]). While previous studies have primarily focused on improving model form or predictor selection ([11], [2]), investigations examining the role of calibration sample size have largely addressed its effects across scales, without explicitly evaluating how it influences the reliability of stand-level biomass estimates ([21], [26]).
Within this context, this study investigates whether variation in calibration dataset size affects the reliability of stand-level mean biomass estimates. The aim was to recommend a sample size for the dataset to calibrate tree biomass models that estimate mean aboveground biomass (AGB) per unit area with the highest possible accuracy. We hypothesize that increasing the calibration sample size enhances the accuracy and stability of stand-level mean AGB estimates in Amazonian forests, because selecting a representative sample requires multiple trees from the assessed population, and an insufficient sample size may yield a less precise model ([18], [41]). By investigating this relationship, we hope to provide insights that could enhance forest management practices and contribute to more reliable carbon accounting in tropical forest ecosystems.
Material and methods
Study area
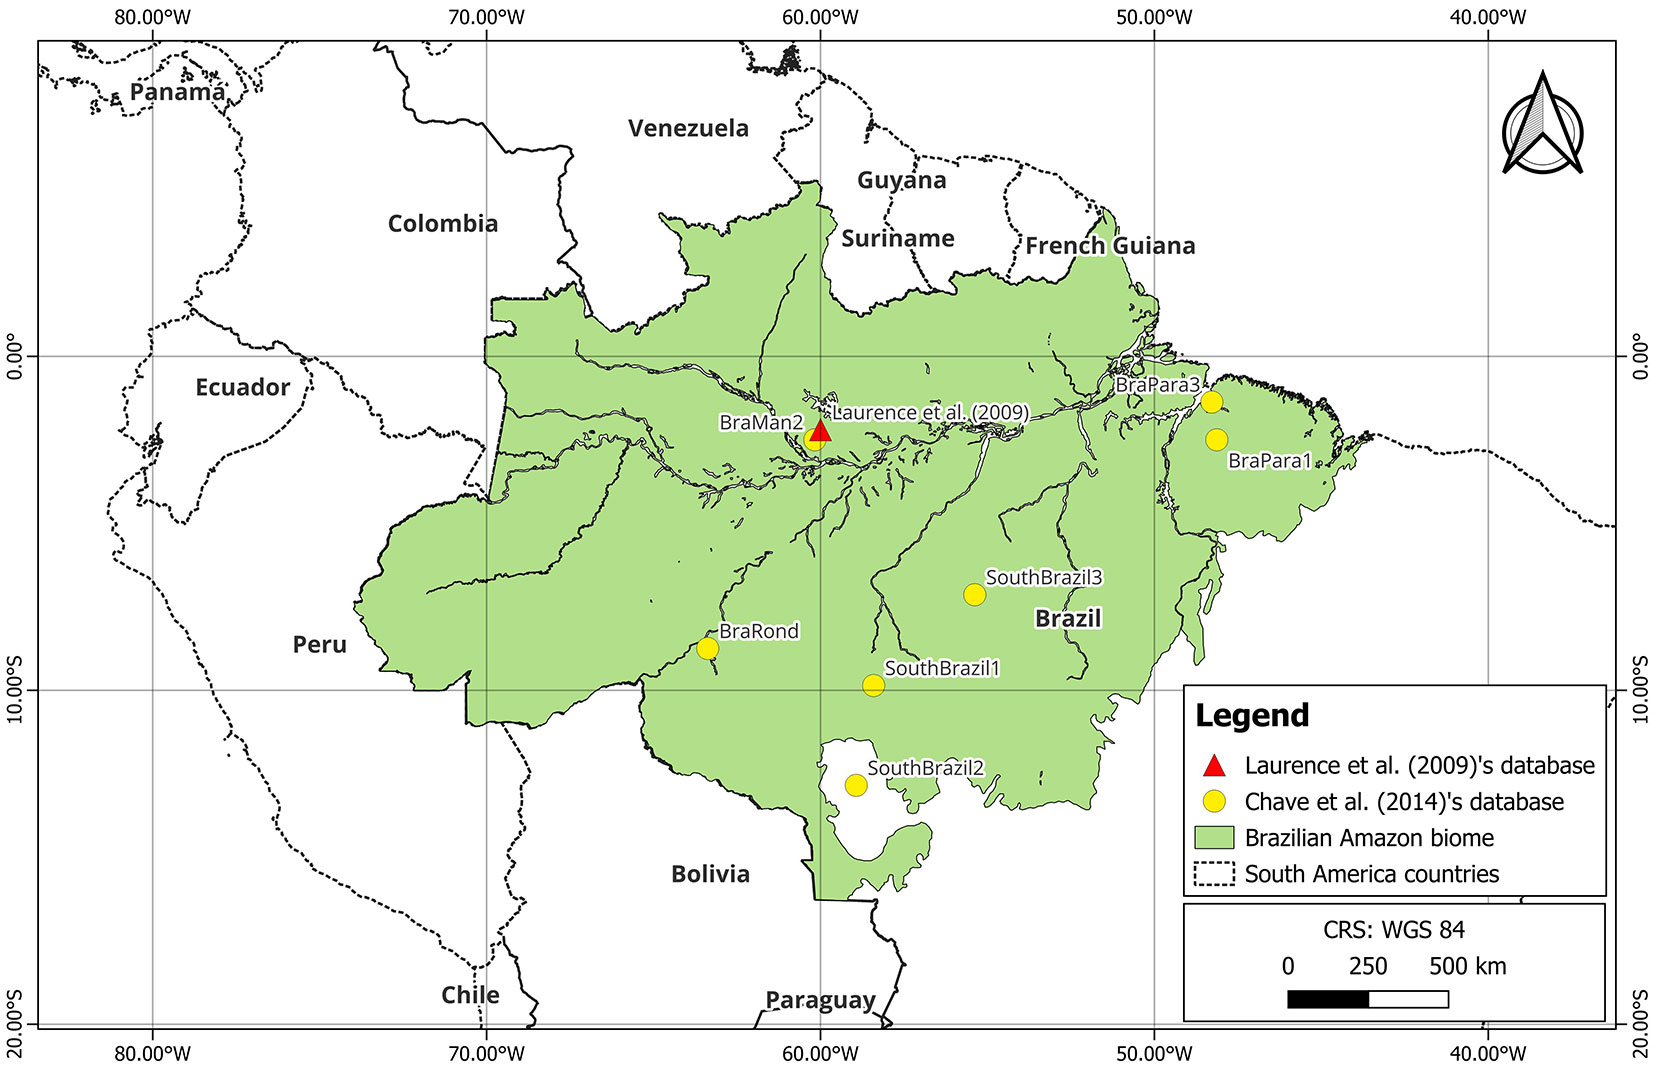
Although our study uses forest simulation, the study area is defined as the central Amazon, with forest stand attributes obtained from Laurance et al. ([29]). The authors collected data in a forest remnant of 1,000-km2 in the region of Manaus, State of Amazonas, Brazil (Fig. 1). The area consists of forest fragments, primary rainforest, and a matrix of grassland and regenerating forest at 50- to 100-m elevation ([33], [30], [29]). The average precipitation is 2,600 mm per year, with a moderately strong dry season from June to August. The region also features nutritionally poor, highly acidic soils classified as Yellow Latosol ([8]).
Data
For the simulation process described in the next section, in addition to the forest stand attributes consulted in Laurance et al. ([29]), we utilized trees from a sub-dataset taken from Chave et al. ([11])’s database. The database (freely available at ⇒ https://zenodo.org/records/14932971) comprises 4,004 trees, with destructively collected diameter at breast height (DBH) and total height (HT) measurements, from 58 sites spanning the tropics. The sub-dataset included only trees with a DBH ≥ 10 cm, collected within or near the Brazilian Amazon Forest, encompassing the sites labeled as BraMan2, BraPara1, BraPara3, BraRond, SouthBrazil1, SouthBrazil2, and SouthBrazil3 (Fig. 1).
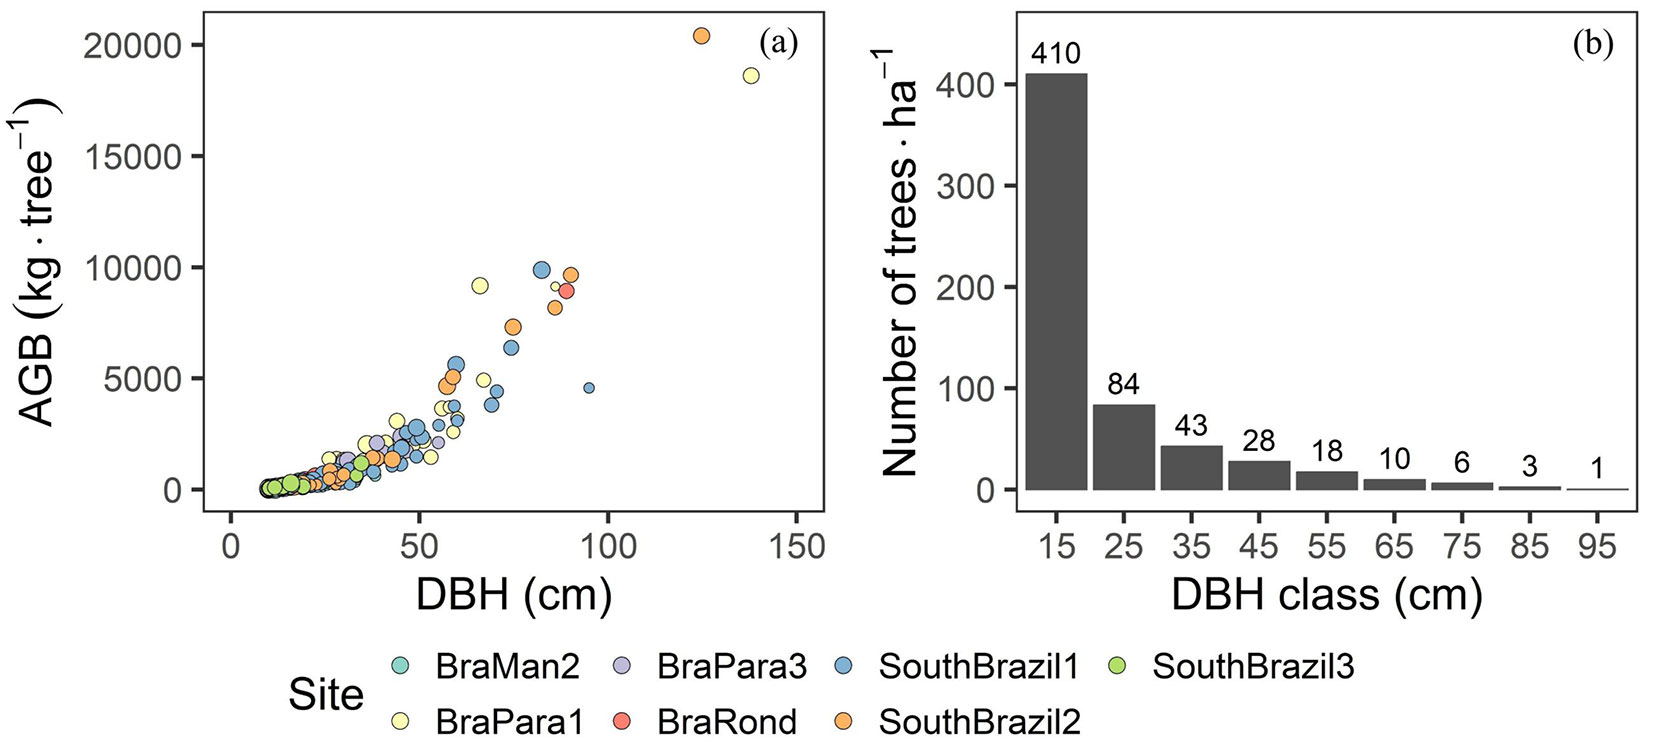
The sub-dataset with Amazon’s trees comprises nAMZ = 410 trees and will hereafter be referred to as the Amazonian sub-dataset. Descriptive statistics of the Amazonian sub-dataset are given in Tab. 1. The scatter plot of DBH and AGB for the Amazonian sub-dataset is presented in Fig. 2a.
Tab. 1 - Descriptive statistics of the Amazonian sub-dataset from Chave et al. ([11])’s database. (DBH): diameter at 1.30 m above ground; (HT): total height; (AGB): aboveground biomass; (SD): standard deviation; (CV): coefficient of variation.
| Variable | Minimum | Mean | Maximum | Median | SD | CV (%) | n AMZ |
|---|---|---|---|---|---|---|---|
| DBH (cm) | 10.0 | 22.6 | 138.0 | 16.4 | 17.0 | 75.0 | 410 |
| HT (m) | 6.0 | 19.4 | 54.1 | 17.6 | 7.4 | 38.3 | 410 |
| AGB (kg.tree-1) | 12.3 | 730.5 | 20.416.0 | 142.8 | 1937.7 | 265.3 | 410 |
Fig. 2 - Relationship between aboveground biomass (AGB) and tree diameter at breast height (DBH) (a) and diameter distribution (b). Diameter distribution of the forest simulated (n. of trees = 6014) through the Monte Carlo method. In (a), each point represents a single tree that has been individually weighed. The size of the points corresponds to wood specific gravity.
Forest simulation and modeling
To simulate a forest, we adopted an inverted J-shaped diameter distribution typical of humid tropical forests ([14]), as well as parameters for basal area and tree density per hectare observed by Laurance et al. ([29]) in a forest in central Amazonia. The algorithm for executing the forest simulation, tree biomass modeling, and forest biomass prediction was divided into two parts (see below).
Part I: Forest simulation
Part I involved simulating ten 1-ha field plots using the Monte Carlo Method (MCM), with diameter at breast height (DBH) following an inverted J-shaped distribution. The algorithm involves the steps described below.
Define i as a tree and j as a 1-ha plot.
(i) Define the parameters of the beta distribution (α; β) to reflect an inverted J-shape. To achieve this, α was set to 0.3 and β to 2.0 (eqn. 1):
(ii) For the j-th plot, obtain Xi = 10 + x100, where x is a random vector of size n drawn from the beta distribution that ranges from 0 to 1. X is a vector representing the DBHs, with values ranging from 10 to 100 cm, and n is a random number between 594 and 613, representing the number of trees ≥ 10 cm per ha, as in Laurance et al. ([29]).
(iii) For the j-th plot, save the vector X if Gj = Σi=1nj (π Xi2) is between 27 and 30 m2 ha-1, as in Laurance et al. ([29]).
(iv) Replicate steps i-iii 10 times.
Steps i-iv define the diameter distribution of the forest, which consists of 6.014 trees distributed across ten 1-ha plots. The results of these steps are shown in Fig. 2b.
The following steps describe how the forest was simulated using trees selected from the Amazonian sub-dataset (nAMZ = 410).
Denote k for the diameter class, where k = 1 corresponds to a DBH of 10-20 cm and k = 9 corresponds to a DBH of 90-100 cm.
(v) For the j-th plot created in steps i-iv, count the number of trees in the k-th diameter class, being this number represented by njk.
(vi) For the j-th plot and the k-th class, randomly select with replacement njk trees from the Amazonian sub-dataset (nAMZ = 410).
(vii) Repeat steps v-vi for the remaining diameter classes.
(viii) Repeat steps v-vii for the remaining plots.
The simulation process allowed us to determine the actual value (parameter) of the AGB for the ten 1-ha plots, as the Amazonian sub-dataset provides the observed biomass value for each tree, along with the variables DBH and HT. Tab. 2 presents descriptive statistics for AGB, DBH, and HT of the trees in the simulated forest.
Tab. 2 - Descriptive statistics of the simulated forest (n = 6.014 trees) based on tree selection from the Amazonian sub-dataset. (DBH): diameter at 1.30 m in cm; (HT): total height in m; (AGB): aboveground biomass in Mg ha-1; (SD): standard deviation; (CV): coefficient of variation.
| Variable | Minimum | Mean | Median | Maximum | CV (%) |
|---|---|---|---|---|---|
| DBH (cm) | 10.0 | 21.2 | 15.9 | 95.0 | 67.2 |
| HT (m) | 6.0 | 18.8 | 17.0 | 54.1 | 36.8 |
| AGB (kg tree-1) | 12.3 | 576.2 | 133.7 | 9879.0 | 221.2 |
Part II: Biomass modeling under different sample sizes and uncertainty analysis
In Part II, tree biomass models were fitted using six calibration dataset sizes. The resulting equations from these fittings were used to predict the AGB in the ten 1-ha plots.
Denote i for trees, j for plots, and m for the sample size of the calibration dataset, where m = 1, ncalib.1 = 13; m = 2, ncalib.2 = 25; m = 3, ncalib.3 = 50; m = 4, ncalib.4 = 100; m = 5, ncalib.5 = 200; m = 6, ncalib.6 = 400 trees.
(i) For the m-th sample size, randomly select with replacement a sample of nm trees from the Amazon subset, where nm < nAMZ, thereby implementing the m out of n Bootstrap technique.
(ii) Obtain descriptive statistics for the DBH variable from the sample selected in the previous step, including: minimum, maximum, range, mean, standard deviation, coefficient of variation (CV), Q1 (1st quartile), Q2 (2nd quartile), Q3 (3rd quartile), range between Q1 and Q2, number of trees with DBH > Q3, number of trees with DBH > 1.5 × Q3, skewness, kurtosis, and number of trees with DBH < Q1.
(iii) Fit the biomass model at the individual tree level (eqn. 2) and obtain the vector of coefficients βp:
where βÌ‚ij is the predicted tree biomass, in kg; DBHij is the diameter of the tree at 1.30 m above the ground from the selected sample, in cm; HTij is the total height of the tree from the selected sample, in m.
The application of a model that, in addition to DBH, includes tree height as an explanatory variable acknowledges that ignoring tree height in biomass estimation can lead to significant errors ([23], [10], [25], [17], [20]).
(iv) For the j-th plot, predict the biomass for the i-th tree using the coefficient vector of βp and applying the bias correction factor as described by Sprugel ([40]).
(v) For the j-th plot, obtain the biomass at the stand level, in Mg ha-1, using eqn. 3. Subsequently, calculate the average estimated and observed AGB across the 10 plots using eqn. 4 and eqn. 5, respectively:
(vi) Estimate the mean error (εrep) and root mean square error (RMSErep) of the average AGB, in Mg ha-1, using eqn. 6 and eqn. 7:
(vii) Replicate steps i-vi 5000 times.
(viii) Repeat steps i-vii for the remaining sample sizes.
Note that eqn. 4 is a model-assisted estimator of the mean AGB per unit area, eqn. 5 is a sample-based estimator of the mean AGB per unit area, and eqn. 6 and eqn. 7 are measures of accuracy of the mean AGB per unit area. Steps i-viii generate, for each sample size, two separate vectors containing 5000 mean errors and 5000 RMSE of forest biomass in Mg ha-1. The last two steps of the algorithm involve measuring the precision and accuracy of the estimated mean AGB in Mg ha-1, as described below.
(ix) For the m-th sample size, calculate the range (eqn. 8, eqn. 9) and the mean (eqn. 10, eqn. 11) of mean error and RMSE in Mg ha-1 across the replications:
(x) Repeat step ix for the remaining sample sizes.
The range of RMSE and errors was used to assess precision, as the common variance is not suitable in cases with a large number of replications. To evaluate accuracy, the mean RMSE and error across replications were considered.
To complement the evaluation of precision and accuracy, we calculated the probability of achieving an acceptable relative error threshold. For each calibration sample size, the proportion of replications in which the absolute relative error of the mean AGB estimate was less than or equal to 10% was computed (eqn. 12). This probability was estimated from the distribution of 5.000 replicated simulations using an indicator function approach. Similarly, the probability of obtaining RMSE values below the same threshold was calculated (eqn. 13):
where I() is an indicator function equal to 1 when the condition is satisfied and 0 otherwise. These metrics provide an intuitive measure of the reliability of the estimator across different calibration sample sizes.
To quantify the incremental improvement in precision associated with increasing calibration sample size, we calculated the percentage reduction in the range of RMSE and error between successive sample sizes. For each transition (e.g., 13 to 25 trees, 25 to 50 trees, etc.), the relative decrease in the range was computed with respect to the previous sample size. This analysis allowed us to assess how much additional precision was gained when increasing the number of calibration trees and to identify potential stabilization of improvements at larger sample sizes.
Explaining error of forest biomass estimate through characteristics of model calibration dataset
In addition to analyzing precision and accuracy of the estimate of the mean AGB in Mg ha-1 as described above, we also related characteristics of each calibration dataset of the models to the RMSE and mean error (eqn. 6, eqn. 7) produced by the models. The descriptive statistics calculated in step ii of Part II of the algorithm were adopted as characteristics of the datasets. Note that the RMSE and error obtained from eqn. 6 and eqn. 7 and the descriptive statistics are calculated 5.000 times for each m-th sample size of the calibration dataset.
The first attempt to explain the error in terms of dataset characteristics involved using Pearson’s correlation coefficient r (eqn. 14):
The normality of the data was assessed using the Shapiro-Wilk test. In this case, each descriptive statistic (minimum DBH, maximum DBH, etc.) for the datasets was correlated with the estimated error in forest biomass (Mg ha-1). We considered a strong correlation when r ≥ 0.75, moderate when 0.50 ≤ r < 0.75, and weak when r < 0.50. The calculation included only 50 data pairs, corresponding to the percentiles (0%, 2%, …, 98%, 100%) of the RMSE and mean error obtained from eqn. 6 and eqn. 7.
In summary, the analytical procedure consisted of (i) simulating an Amazonian forest using the Monte Carlo Method (MCM) and m out of n Bootstrap, (ii) estimating the average forest biomass using models calibrated with datasets of varying sample sizes, (iii) analyzing the precision and accuracy of the mean AGB estimate in Mg ha-1 using the models calibrated with different sample sizes, and (iv) relating characteristics of the calibration datasets with the errors produced by the models.
Results
Our analytical procedure generated 5,000 mean errors and RMSE values using eqn. 6 and eqn. 7 for each sample size (ncalib.1 = 13, …, ncalib.6 = 400) in the calibration dataset. The histograms of the mean errors and RMSE for all sample sizes are depicted in Fig. 3. The histograms of the errors depicted an expected normal distribution, as confirmed by the Shapiro-Wilk test.
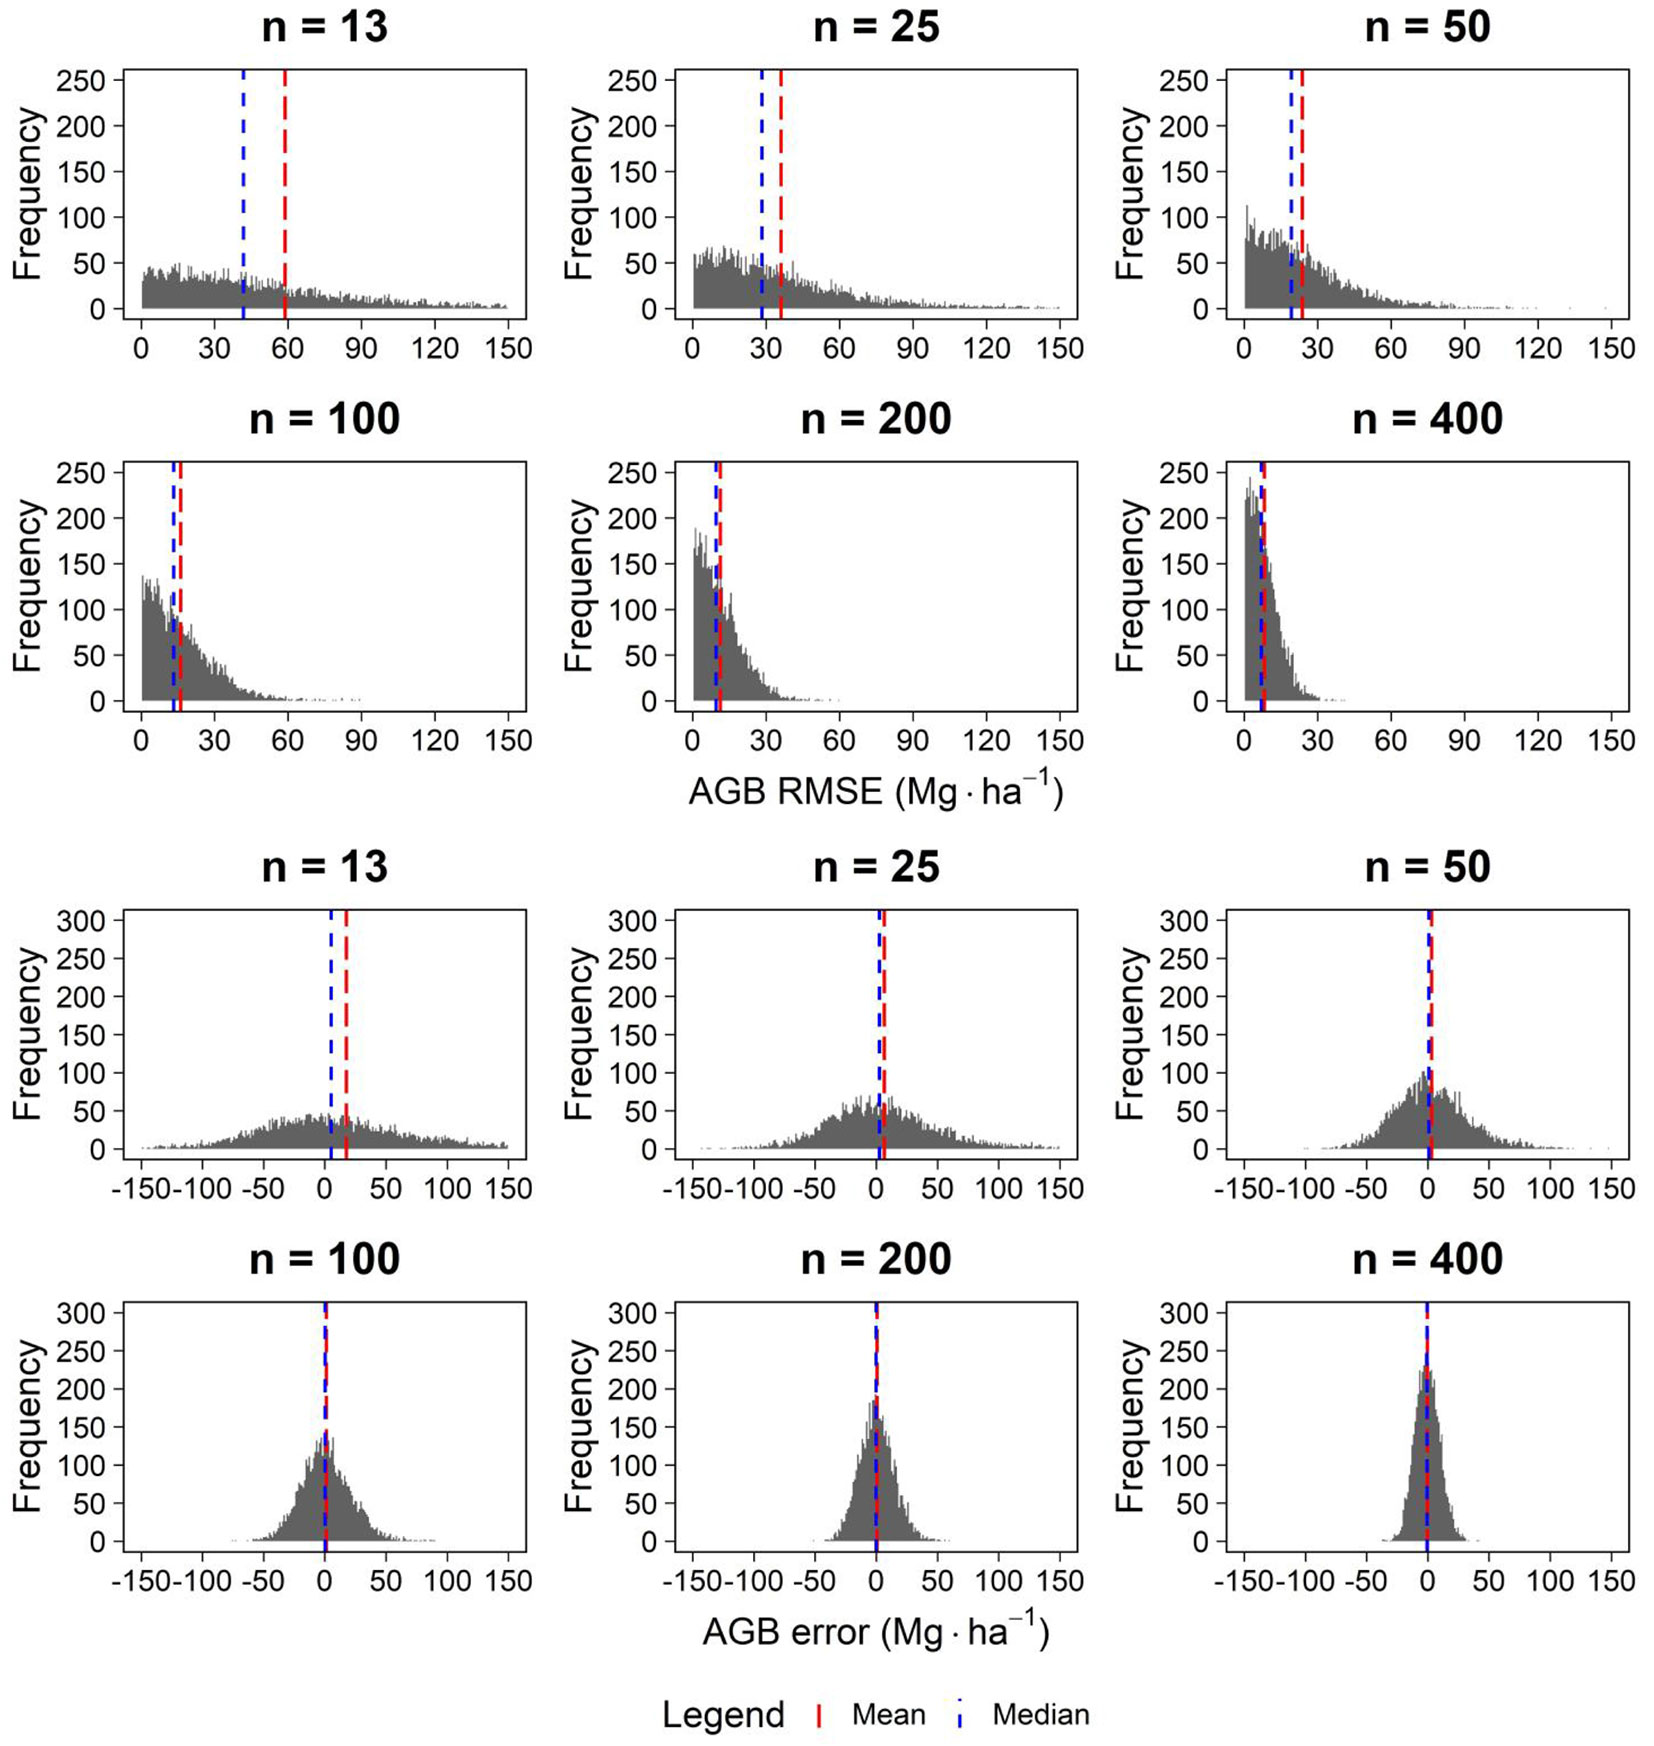
Descriptive statistics for the RMSE and errors are given in Tab. 3 and Tab. 4, where the range and mean values were obtained using eqn. 8-11, respectively. We noted that the amplitude of the RMSE and errors, which reflect the precision of the mean AGB estimate (Mg ha-1), decreases as the calibration dataset sample size increases. The difference between the largest and smallest amplitudes indicates that the biomass estimate’s precision increased by up to 32 times with the increase in sample size.
Tab. 3 - Descriptive statistics of 5.000 mean error values for the mean AGB estimate (Mg ha-1), including the percentage reduction relative to the previous sample size and the probability that |%error| ≤ 10%.
| Sample size |
Minimum | Mean | Median | Maximum | Range | % reduction vs. previous |
P(|%error| ≤ 10%) |
|---|---|---|---|---|---|---|---|
| 13 | -244.3 | 17.6 | 5.1 | 1315.3 | 1559.6 | - | 0.67 |
| 25 | -143.1 | 6.3 | 2.5 | 373.2 | 516.3 | 66.9 | 0.77 |
| 50 | -100.6 | 3.1 | 0.7 | 198.3 | 298.8 | 42.1 | 0.86 |
| 100 | -75.3 | 1.1 | 0.1 | 89.2 | 164.6 | 44.9 | 0.94 |
| 200 | -50.9 | 0.4 | -0.2 | 59.4 | 110.3 | 33.0 | 0.99 |
| 400 | -37.3 | -0.3 | -0.7 | 41.0 | 78.3 | 29.0 | 1.00 |
Tab. 4 - Descriptive statistics of 5.000 RMSE values for the mean AGB estimate (Mg ha-1), including the percentage reduction relative to the previous sample size and the probability that |%RMSE| ≤ 10%.
| Sample size |
Minimum | Mean | Median | Maximum | Range | % reduction vs. previous |
P(|%RMSE| ≤ 10%) |
|---|---|---|---|---|---|---|---|
| 13 | 0.0 | 58.7 | 41.7 | 1315.3 | 1315.3 | - | 0.43 |
| 25 | 0.0 | 36.0 | 28.2 | 373.2 | 373.2 | 71.6 | 0.59 |
| 50 | 0.0 | 23.7 | 19.2 | 198.3 | 198.3 | 46.9 | 0.77 |
| 100 | 0.0 | 16.1 | 13.2 | 89.2 | 89.2 | 55.0 | 0.91 |
| 200 | 0.0 | 11.3 | 9.5 | 59.4 | 59.3 | 33.5 | 0.99 |
| 400 | 0.0 | 8.1 | 7.0 | 41.0 | 41.0 | 30.9 | 1.00 |
The accuracy of the biomass estimate, as reflected by the mean values in Tab. 3 and Tab. 4, showed less variation across sample sizes than the precision. We observed a reduction in the mean RMSE (from 58.7 to 8.1 Mg ha-1) and a decrease in the mean error (from 17.6 to -0.3 Mg ha-1) as the sample size in the calibration dataset increased. Also, the RMSE and error medians decreased with sample size, though less than the mean did. The positive error medians observed for sample sizes up to 100 indicate that biomass per unit area was frequently overestimated.
To quantify the effect of increasing calibration sample size on precision, we calculated the marginal reduction in RMSE and error across successive sample sizes (Tab. 3, Tab. 4). The largest improvements occurred at smaller sample sizes, with RMSE reductions of 71.6% (13-25), 46.9% (25-50), 55.0% (50-100), 33.5% (100-200), and 30.9% (200-400). A similar pattern was observed for error range (66.9%, 42.1%, 44.9%, 33.0%, and 29.0%, respectively), indicating diminishing returns and stabilization of precision gains beyond 200 trees.
The probability of achieving acceptable relative error and relative RMSE (eqn. 12, eqn. 13) increased markedly with calibration sample size. For error (Tab. 3), this probability rose from 0.67 at 13 trees to 0.86 at 50 trees and reached ~1.00 from 200 trees onward, indicating the stabilization of the average bias at relatively large sample sizes. For RMSE (Tab. 4), the probability increased from 0.43 (13 trees) to 1.00 (400 trees). Notably, with 100 trees, the probability of obtaining RMSE ≤ 10% already exceeded 0.90, demonstrating high reliability at this calibration size. However, with 200 trees, the probability reached approximately 1.0 for both error and RMSE. These results indicate that improvements diminish beyond 200 trees, supporting this value as a practical threshold for stable and precise mean AGB estimation.
The correlation between the estimated RMSE and error of forest biomass and each descriptive statistic was considered weak for all tested sample sizes, as the values were less than 0.50, except between the error and the coefficient of variation of DBH when the sample size was 200 (r = 0.51, indicating a moderate correlation). However, none of the metrics explained the behavior of the estimation error, as evidenced by the low correlation values.
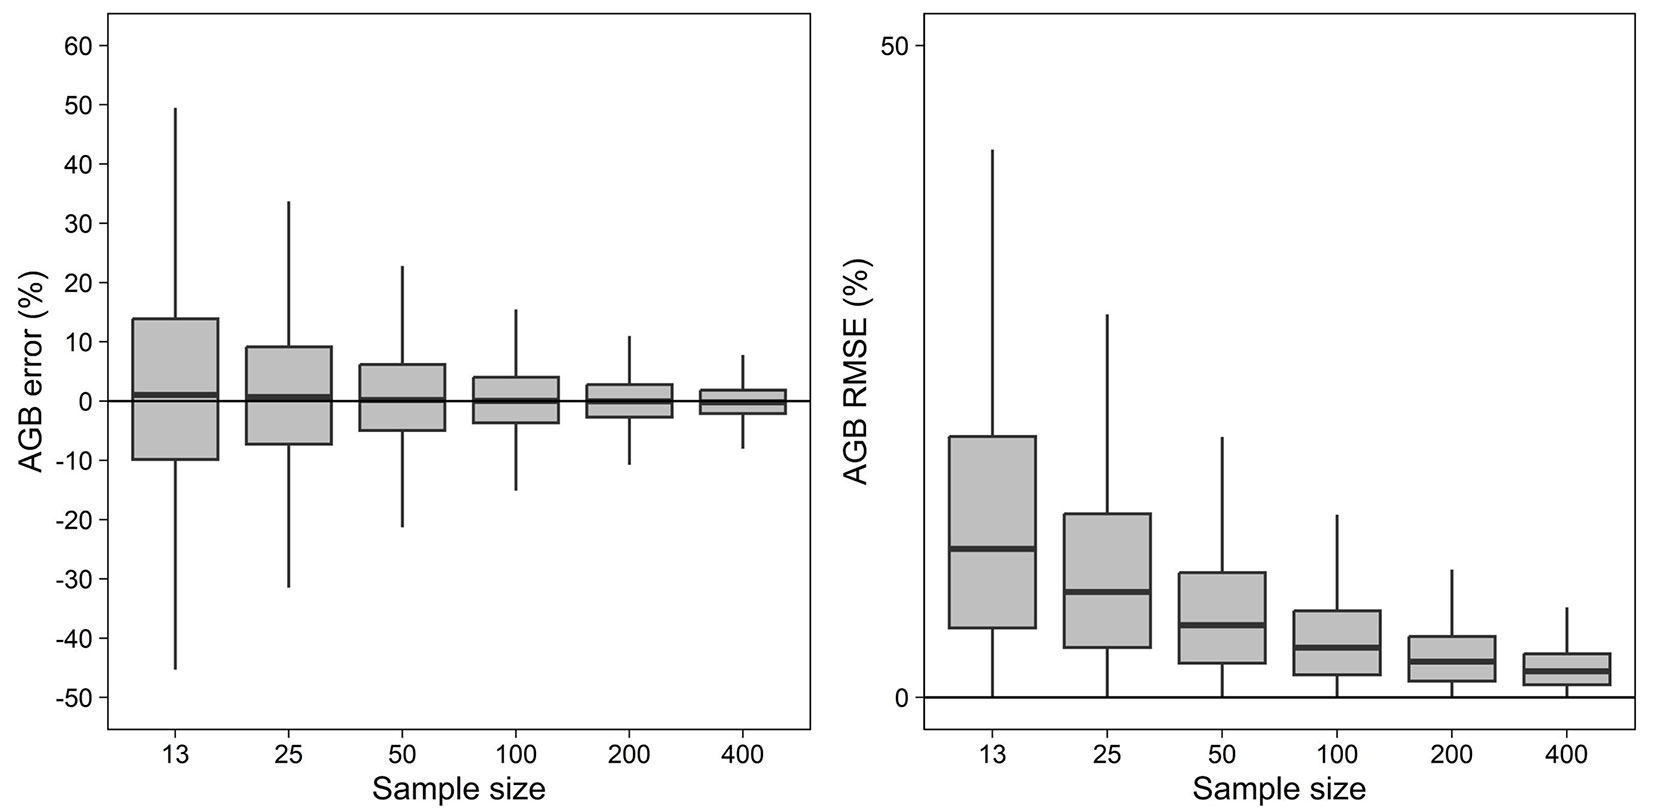
The percentage error of the mean AGB estimate for the tested sample sizes is shown in Fig. 4. The sample sizes of 200 and 400 exhibited the lowest percentage error ranges, specifically -14.70% to 17.13% and -10.76% to 11.84%, respectively. The smaller the number of samples, the greater the error range, with amplitudes of 450.04%, 148.98%, 86.23%, 47.49%, 31.83%, and 22.61% for 13, 25, 50, 100, 200, and 400 samples, respectively. The same patterns were observed for RMSE values. Notably, when the sample size was doubled from 200 to 400, the error and RMSE amplitudes decreased by 9.22% and 11.84%, respectively. Almost all mean values of percentage error were positive, ranging from 5.08% for the smallest sample size to -0.11% for 200.
Fig. 4 - Boxplots of relative errors of the mean AGB estimate (Mg ha-1) for different sample sizes (number of trees) of model calibration datasets.
Discussion
The high variability of tree attributes (Tab. 1) is common in tropical forests, as they are characterized by structural and floristic diversity, along with the presence of large trees (e.g., Max. AGB = 20.416 kg tree-1, Tab. 1 - [3], [43], [47]). This high population heterogeneity increases the challenge of biomass estimation in natural forests ([13]). However, large trees must be included in the sample, as these individuals contribute a substantial proportion of the biomass and accurately reflect the population’s composition ([23], [1]). Using 5.000 repetitions across the different sample sizes in this study effectively reduced the effect of sample composition on the regression model fit, allowing for a more reliable analysis of model adjustments, consistent with the findings of Leão et al. ([31]).
The results underscore the reliability of the equations employed to estimate stand-level biomass, as they consistently approached the true mean despite the high variability observed in smaller samples. Furthermore, the normal distribution of the errors suggests a solid theoretical foundation.
The underestimation of biomass increased with sample size, while RMSE values decreased (Tab. 3, Tab. 4), suggesting a reduction in the influence of larger trees in the modeling process. Given the inverted-J distribution (e.g., most observations are of small trees, with only a small proportion of large trees), the larger the sample, the greater the tendency for more small trees to be selected. In line with this pattern, evidence in the literature indicates that allometric models focusing on large trees tend to overestimate biomass for smaller trees ([16], [44]).
In contrast, Dutca et al. ([19]) found that although sample size strongly influenced accuracy, it showed limited impact on the precision of biomass predictions. Conversely, Duncanson et al. ([18]), studying temperate forests across multiple sites, reported that the accuracy of allometric models is highly affected by sample size, with small samples yielding biased coefficients. Similarly, Aabeyir et al. ([1]) indicated that calibration with larger sample sizes yields more reliable coefficients. This behavior aligns with the gradual increase in mean AGB estimate (Mg ha-1) precision as more trees were used for model calibration (Tab. 3, Tab. 4, Fig. 4), indicating that small samples may not adequately represent the sampled population; thus, the larger the sample size, the greater the likelihood that additional observations (trees) yield consistent results ([6]). Although model diagnostics and parameter significance were not evaluated individually for each fitted equation, the observed variability among simulations reflects not only differences in sample composition but also the instability of parameter estimates associated with limited calibration datasets. Additionally, Chave et al. ([9]), in their study on biomass estimation in tropical forests, recommended that allometric equations be constructed from large samples, ideally comprising at least 100 trees spanning a broad diameter range. Such findings underscore the importance of evaluating the optimal sample size for forest management ([34]), as the number of sampled trees directly impacts fieldwork labor, survey costs, and the accuracy of models applied in forest inventory.
Beyond comparisons with previous sample-size studies, these findings have implications for broader biomass estimation methodologies. While many studies emphasize improvements in model form, predictor selection, or spatial scaling strategies ([11], [2]), comparatively less attention has been given to the structural role of calibration sample size in stand-level biomass inference ([21], [26]). Plot-based expansion approaches and remote sensing frameworks typically prioritize plot representativeness or landscape-level predictive performance ([39], [36], [7]), often assuming that tree-level allometric relationships are sufficiently stable. However, because large-scale biomass products ultimately depend on these underlying relationships ([32]), the present results demonstrate that calibration sample size alone can substantially influence the variability of stand-level mean AGB estimates, even when model structure remains unchanged. These findings reinforce the importance of treating calibration design as a structural component of model reliability rather than merely an operational constraint.
Although the literature indicates that sample sizes can exceed 200 trees ([38]), they often do not ([46], [35], [15]). Hetzer et al. ([26]) found that around 100 plots are necessary for biomass estimations; however, in the present study, a significant reduction in error was observed when the sample size was increased from 100 to 200 trees (e.g., reduction of 33.0% for error and 33.5% for RMSE - Tab. 3, Tab. 4). While sampling 200 trees provided good precision, the improvement in precision from doubling the sample size (from 200 to 400) was not substantial enough to justify the additional effort. Furthermore, a sample size of 200 is preferable, as it increases the chances of adequately representing a diverse range of tree sizes, as recommended by Chave et al. ([9]). Additionally, recognizing that it is not always possible to obtain such a sample size in practice, one should consider that when working with a limited sample size, it is crucial to be aware of the trade-off between sample size and the precision of the mean AGB estimate (Mg ha-1) at the stand level.
The ability to replicate findings is essential across all scientific disciplines to ensure the stability and generalizability of results. A reliable approach to guarantee this generalization is to apply these models to independent samples separate from the data used for model fitting. In this context, a limitation of the present study is that the same dataset was used to simulate forest structure and calibrate biomass models, which may influence the independence of model validation and should be considered when interpreting the generalizability of the results. Thus, developing a model with high accuracy should be regarded as only the first step in the validation process, as common validation methods do not eliminate the need to validate models on other samples ([6]). As observed in this study, an insufficient calibration sample size may yield satisfactory results for a specific dataset but present limitations when transferred to other forest conditions, leading to wasted time, field effort, and costs for inconclusive or less applicable outcomes. Consequently, simulation emerges as an essential tool to support the validation process, allowing assessment of model performance at the stand level, a practice still rarely applied in the development of biomass models ([19], [14]). Finally, although the forest structure here was simulated according to a typical inverted-J distribution representative of central Amazon forests, the variability level of the simulated stands remained within the ecological range reported by Laurance et al. ([29]). Therefore, our recommendation applies to forests with comparable structural heterogeneity, and future research should extend this framework using independent datasets and forests with contrasting diameter distributions and lower structural variability.
Conclusions
The sample size affects the precision of the mean AGB estimate (Mg ha-1) per unit area. Larger sample sizes yield better precision, but it does not affect accuracy. To compose a model calibration dataset, one should consider that precision can improve as the sample size increases. To estimate the mean and total forest biomass in the Amazon using tree-level modeling, we recommend a calibration dataset comprising 200 randomly sampled trees, with DBHs spanning the forest range.
Acknowledgements
David HC: conceptualization, methodology, supervision and writing - original draft, review & editing; Pereira FR: formal analysis, investigation, methodology, validation, and writing - original draft; Almeida TC: formal analysis, investigation, methodology, validation, and writing - original draft; García RA: methodology and writing; Galvão LMR: methodology and writing; Chivale XS: methodology and writing; Behling A: methodology and writing - review; Pelissari AL: methodology and writing - review; Ebling AA: methodology and writing - review.
References
CrossRef | Gscholar
CrossRef | Gscholar
CrossRef | Gscholar
CrossRef | Gscholar
CrossRef | Gscholar
CrossRef | Gscholar
CrossRef | Gscholar
CrossRef | Gscholar
Gscholar
Gscholar
CrossRef | Gscholar
CrossRef | Gscholar
Authors’ Info
Authors’ Affiliation
Thaís Chaves Almeida 0000-0002-0027-0022
Lina Mayra Reis Galvão 0009-0000-8012-5249
Xavier Simiao Chivale 0000-0001-7709-6408
Rebecca Araujo García 0000-0003-3553-7337
Federal University of Paraná, Pref. Lothário Meissner Avenue 900, Curitiba 80210-170, PR (Brazil)
Alexandre Behling 0000-0002-7032-2721
Angelo Augusto Ebling 0000-0002-4342-7405
Allan Libanio Pelissari 0000-0002-0915-0238
Department of Forest Science, Federal University of Paraná, Pref. Lothário Meissner Avenue 900, Curitiba 80210-170, PR (Brazil)
Corresponding author
Paper Info
Citation
Pereira FR, Almeida TC, David HC, Galvão LMR, Behling A, Ebling AA, Pelissari AL, Chivale XS, García RA (2026). Exploring biomass modeling in the Amazon Forest: assessing the effect of sample size of model calibration datasets. iForest 19: 261-268. - doi: 10.3832/ifor4919-019
Academic Editor
Maurizio Marchi
Paper history
Received: Jun 05, 2025
Accepted: Jun 17, 2026
First online: Jul 21, 2026
Publication Date: Aug 31, 2026
Publication Time: 1.13 months
Copyright Information
© SISEF - The Italian Society of Silviculture and Forest Ecology 2026
Open Access
This article is distributed under the terms of the Creative Commons Attribution-Non Commercial 4.0 International (https://creativecommons.org/licenses/by-nc/4.0/), which permits unrestricted use, distribution, and reproduction in any medium, provided you give appropriate credit to the original author(s) and the source, provide a link to the Creative Commons license, and indicate if changes were made.

Web Metrics
Breakdown by View Type
Article Usage
Total Article Views: 109
(from publication date up to now)
Breakdown by View Type
HTML Page Views: 23
Abstract Page Views: 50
PDF Downloads: 33
Citation/Reference Downloads: 0
XML Downloads: 3
Web Metrics
Days since publication: 2
Overall contacts: 109
Avg. contacts per week: 381.50
Article Citations
Article citations are based on data periodically collected from the Clarivate Web of Science web site
(last update: Mar 2025)
(No citations were found up to date. Please come back later)
Publication Metrics
by Dimensions ©
Articles citing this article
List of the papers citing this article based on CrossRef Cited-by.
Related Contents
iForest Similar Articles
Research Articles
Optimizing line-plot size for personal laser scanning: modeling distance-dependent tree detection probability along transects
vol. 17, pp. 269-276 (online: 07 September 2024)
Technical Advances
Improved estimates of per-plot basal area from angle count inventories
vol. 7, pp. 178-185 (online: 17 February 2014)
Review Papers
Integration of forest mapping and inventory to support forest management
vol. 3, pp. 59-64 (online: 17 May 2010)
Research Articles
Estimation of aboveground forest biomass in Galicia (NW Spain) by the combined use of LiDAR, LANDSAT ETM+ and National Forest Inventory data
vol. 10, pp. 590-596 (online: 15 May 2017)
Research Articles
Exploring machine learning modeling approaches for biomass and carbon dioxide weight estimation in Lebanon cedar trees
vol. 17, pp. 19-28 (online: 12 February 2024)
Research Articles
Estimation of forest biomass components using airborne LiDAR and multispectral sensors
vol. 12, pp. 207-213 (online: 25 April 2019)
Research Articles
Allometric relationships for volume and biomass for stone pine (Pinus pinea L.) in Italian coastal stands
vol. 6, pp. 331-335 (online: 29 August 2013)
Research Articles
Total tree height predictions via parametric and artificial neural network modeling approaches
vol. 15, pp. 95-105 (online: 21 March 2022)
Research Articles
Essential environmental variables to include in a stratified sampling design for a national-level invasive alien tree survey
vol. 12, pp. 418-426 (online: 01 September 2019)
Research Articles
Tree biomass and carbon density estimation in the tropical dry forest of Southern Western Ghats, India
vol. 11, pp. 534-541 (online: 01 August 2018)
iForest Database Search
Search By Author
Search By Keyword
Google Scholar Search
Citing Articles
Search By Author
Search By Keywords
PubMed Search
Search By Author
Search By Keyword