
Allometric relationships for volume and biomass for stone pine (Pinus pinea L.) in Italian coastal stands
iForest - Biogeosciences and Forestry, Volume 6, Issue 6, Pages 331-335 (2013)
doi: https://doi.org/10.3832/ifor0941-006
Published: Aug 29, 2013 - Copyright © 2013 SISEF
Research Articles
Abstract
Tree biomass plays a key role in sustainable forest management and in determining forest carbon stocks. Accurate estimates based on species-specific empirical data are necessary for regional and national inventories and forest carbon management. In this study, we obtained allometric relationships for volume and aboveground biomass for stone pine (Pinus pinea) based on empirical data collected in four coastal stands in Italy. Root sampling was also performed. The results enabled generalized equations for volume and aboveground biomass to be developed. However, an analysis also showed several differences in biomass allocation in stone pine resulting from different stand characteristics, emphasizing the importance of stand-dependent factors for adjusting regional or national biomass calculations. Biomass expansion factors were also provided. This study provides tools to help forest managers in quantifying volume and biomass, thereby contributing to the accurate estimation of carbon sequestration and stocks in stone pine stands in Italy.
Keywords
Allometric Equations, Aboveground Biomass, Belowground Biomass, Carbon Stocks, Biomass Expansion Factor
Introduction
Reliable estimates of forest biomass are essential for assessing ecosystem yield and carbon stocks in compliance with the Kyoto Protocol on greenhouse gas reduction ([4]). Tree biomass strongly affects both ecological and ecophysiological processed-based models of forest growth. In addition, determinations of forest stand biomass have usually been considered to ensure sustainable management, and foresters have applied different methods to obtain such estimates ([40]).
A distinction should be made between direct and indirect methods for assessing forest biomass. Direct methods involving harvesting and weighing tree biomass in the field are undoubtedly the most accurate approaches, but they are time-consuming, destructive, and only practical in small areas and for small samples of trees ([18]). Therefore, less destructive methods using allometry have been applied more frequently in forest ecosystems. This approach permits the estimation of stand volume or tree biomass from measurements of more accessible variables such as the diameter at breast height, height and crown radius. In estimating the biomass of a forest, the use of species-specific equations is preferred if such equations are available because allometric regressions should yield a more suitable fit at the specific site for which they were developed. However, because calibration for each site is unrealistic, different approaches involving empirical, biomechanical and ecophysiological models have recently been proposed to simplify allometric analyses of forest biomass (i.e., [37], [6], [18], [40], [27]).
Despite the variety of recently proposed approaches, allometric analyses to date have essentially been based on empirical relationships. Foresters have developed a plethora of allometric equations for different species growing in a wide range of environmental conditions ([39]). However, as biomass varies with stand and site characteristics, implementing allometric equations beyond the specific site and the diameter range for which they were developed could affect the accuracy of biomass estimates. To overcome this problem, generalized allometric equations for different forest tree species offer a valuable alternative for broad-scale applications ([25], [40], [41]). Within this framework, several reviews of volume and biomass equations for forest tree species have been published over the past few years ([16], [41]), and comprehensive databases for biomass and carbon factors are available, such as the “Allometric biomass and carbon factors” database provided by the Joint Research Center, European Commission (⇒ http://afoludata.jrc.ec.europa.eu/DS_Fr ee/abc_intro.cfm).
Despite these improvements, relatively few equations have been developed for southern Europe. In particular, few studies of tree biomass have been conducted for Mediterranean pine species, such as stone pine (Pinus pinea L.). Nevertheless, the species is of great interest because of numerous distinctive characteristics. Although stone pine has been traditionally cultivated for its edible nut (kernel), the species also yields several wood and non-wood forest products. Accordingly, the species has often been cultivated for multiple purposes aside from kernel production, such as timber, the reclamation of lowland areas, consolidation of coastal dunes and amenity planting ([9]). Moreover, stone pine has acquired a high ecological, recreational and landscape value in the past few decades ([20]). Additional important characteristics of the species include its genetic uniformity and its high level of phenotypic plasticity ([23], [35]). Stone pine appears either in arid inland or coastal sea areas affected by salinity stress and can potentially help in mitigating desertification problems in these areas ([8]). In addition, drought-tolerant species such as stone pine are of great interest in the context of climate change scenarios ([8]).
The majority of studies regarding forest biomass in stone pine have been performed on the Iberian Peninsula ([21], [8], [30]). Volume and biomass equations for stone pine in Italy have been recently developed by Tabacchi et al. ([34]) for national forest inventory purposes (NFI - ⇒ http://www.infc.it), but tree sampling was restricted to only 23 trees. Sample size is a particularly relevant issue because previous studies have shown that biomass allometry can vary considerably with stand structure in stone pine, despite the genetic uniformity of the species ([11], [8]). In pine plantations, different stand structural types, stand densities and seeding can strongly influence the patterns of allocation to biomass compartments ([11]), implying that empirical equations should be checked and validated for different study sites.
The main objective of this study was to develop volume and biomass allometric equations for stone pine in Italy. Four stands were selected in different forested areas of the country. These stands differed in stand structure and silvicultural practices. As a second objective, the study aimed to integrate and extend the information available for stone pine at the national and European levels. Biomass expansion factors were developed for this purpose to allow broad-scale estimation of biomass for use either in regional studies or for inventory purposes.
Materials and methods
Study sites
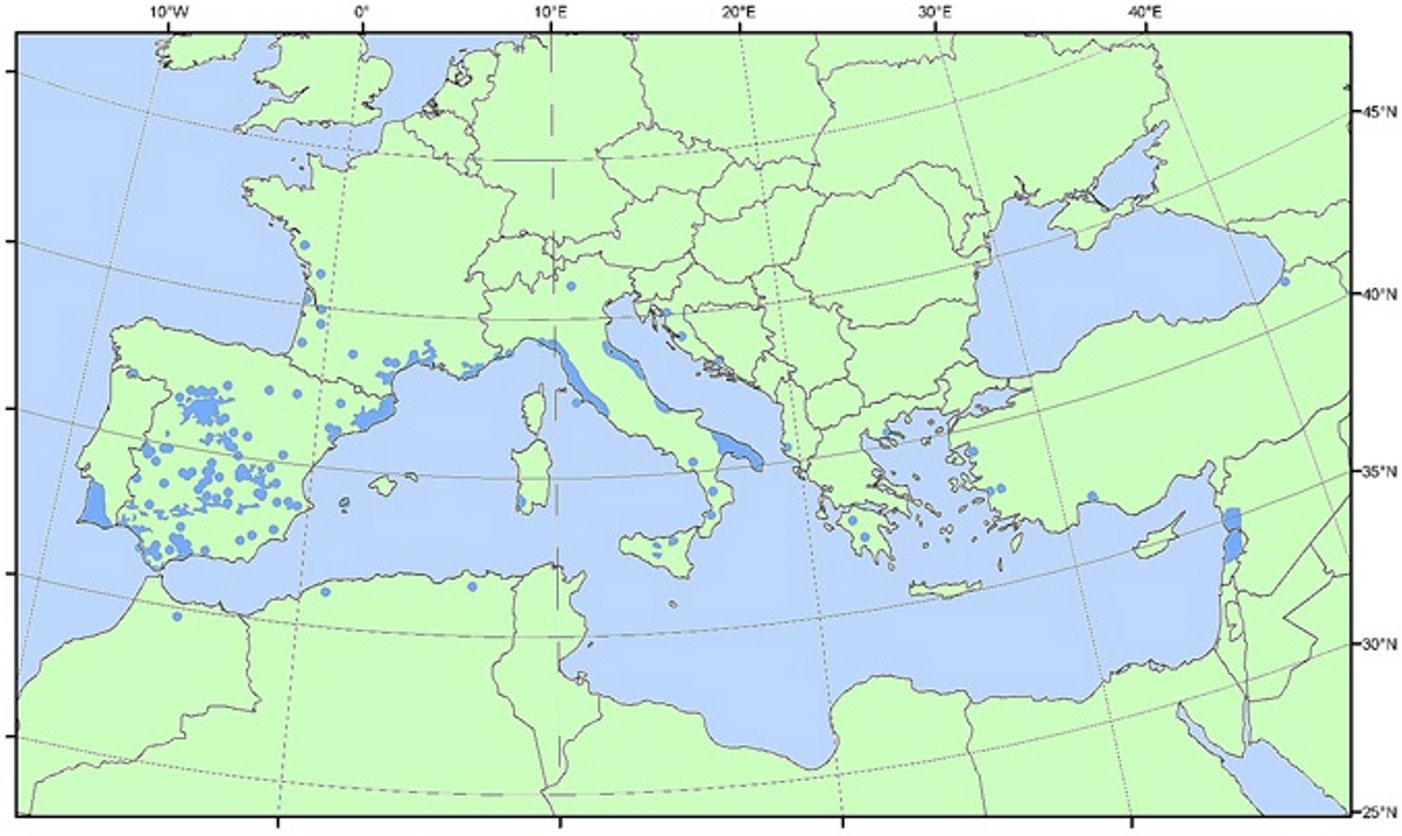
Stone pine is a native species of the Mediterranean Basin, covering approximately 650 000 ha of coastal lands (Fig. 1 - [28]). According to the Italian national forest inventory (NFI - ⇒ http://www.infc.it), stone pine covers 46 290 ha of Italian forests. Although it occurs throughout the country, the species is primarily distributed along the central-western coast and in Sardinia.
Fig. 1 - Stone pine distribution. Source: Fady et al. ([12]).
The study involved four even-aged pine stands in three sites in Italy. Two stands were sampled at study sites on the eastern and western Sardinian coast, in Bidderosa (BDR - 40°27’ N, 9° 46’ E) and Is Arenas (ISAR - 40°08’ N, 8°48’ E), respectively; the remaining two stands were sampled at the Castel Fusano study site, within the National Natural Reserve of the Roman Coast, 20 km southwest of Rome (CFUS - 41°43’ N, 12°19’ E). The climate of the forests can be classified as Mediterranean, with rainy winters and warm summers. The mean annual air temperature in BDR, ISAR and CFUS was 16.6, 16.9 and 16.2 °C, respectively; the mean annual precipitation was 536, 599 and 709 mm, respectively (data sourced from CRU TS 2.0 dataset, ⇒ http://www.cru.uea.ac.uk). The two Sardinian sites were characterized by drier summers than those in Castel Fusano, due to lower summer precipitation (approximately 50% lower).
Bidderosa lies on shallow soil derived from intrusive igneous rocks, partially metamorphic rocks, and limestone. Is Arenas lies on alluvial soil originating from alluvial deposits. The area is affected by strong winds and locally limited by acidity, salinity, and calcareous crusts. Castel Fusano lies on alluvial soil derived from alluvial deposits with inclusions of metamorphic rocks.
The selected stands showed differences in species composition, basal area, stand density, and structure. The two stands in Castel Fusano also differed in structural type as a consequence of different age and seeding. Stand type B originated from partial seeding in a pattern of alternating worked strips and firm-seeded strips, whereas type C originated from broadcast seeding (for more details, see [11]). Both the Sardinian plots originated from broadcast seeding; these stands were managed primarily for the consolidation of sand dunes, for protective purposes and for recreational purposes. The species composition in both Sardinian plots was pure. The two plots in Castel Fusano (CFUS -B and CFUS-C) were dominated by stone pine, with holm oak (Quercus ilex L.) also present (4% and 11% of basal area in B and C, respectively); these stands were managed for protective and aesthetic purposes ([10]). All the four stands were left to develop naturally (no silvicultural treatments were applied). Tab. 1 lists the principal stand characteristics of each plot.
Tab. 1 - Main characteristics of the studied stands. (Dg): diameter corresponding to mean basal area of stand.
| Stand ID |
Age years |
Stand density (n ha-1) |
Basal area (m2 ha-1) |
Dg (cm) |
D range (cm) |
Mean height (m) |
No. tree harvested (volume) |
No. tree harvested (biomass) |
|---|---|---|---|---|---|---|---|---|
| BDR | 48 | 462 | 23.72 | 25.6 | 12-35 | 8.8 | 20 | 20 |
| CFUS-B | 62 | 338 | 38.83 | 38.2 | 34-56 | 18.3 | 44 | 15 |
| CFUS-C | 50 | 370 | 33.8 | 33.7 | 26-65 | 15.4 | 39 | 17 |
| ISAR | 60 | 639 | 31.41 | 25 | 8-42 | 10.8 | 81 | 25 |
Data collection
Before the trees were harvested for this study, the diameter at breast height (D) was measured in all the sample plots. The harvested trees were representative of the diameter and height in each study plot. The D values of the selected trees ranged from 10 to 50 cm.
One hundred eighty-four trees were harvested to obtain data for volume equations. Seventy-seven trees were harvested to obtain data for biomass (see details in Tab. 1), wood basic density (WBD) and biomass expansion factors. The trees were cut from the stump, and dead and living branches were separated from the stem. D, total height (H) and height to the base of the crown were measured for each tree with a measuring tape. In addition, the diameter every 1 m from 0.50 m to the top of each tree was determined with a measuring tape. A sub-sample of round sections of wood was collected from the base, at breast height and at heights of H/2 and H along the stem. These sub-samples were used to calculate wood density and dry weight.
Each tree was divided into the following major fractions: (1) photosynthetic biomass (needles and twigs: diameter < 3 cm): (2) branches (diameter > 3 cm); (3) stem.
The total fresh weight of branches, twigs and needles was measured in the field with a portable digital scale with ± 1 g precision; a sample of both photosynthetic biomass and branches was dried in a forced-air stove at 85 ± 2 °C to a constant weight. A constant weight was attained after approximately 4-6 days of oven-drying. The dry weight and the dry-to-fresh weight ratio (θ) of the biomass components were then calculated.
Wood basic density and height-diameter model (H-D)
Wood basic density (WBD), defined as the ratio of dry biomass to green volume (kg m-3), was calculated using the round sections collected from the stem. Because wood weight and volume vary with moisture, WBD was expressed as the ratio of dry weight to fresh volume. Fresh volume was measured by immersion in water, and dry weight was measured after drying the wood in a forced-air stove at 85 ± 2 °C for 4-6 days, until a constant weight was attained. An average WBD value was calculated for each harvested tree.
Nonlinear H-D models were developed by log transforming both H and D. To investigate the effect of stand structure and density on the tree height curves, the resulting allometries were statistically compared among stands with an ANCOVA.
Volume and biomass calculations
Stem volume was calculated for each tree by applying Heyer’s formula, which is based on the volumes vi of n wood logs 1 m in length (eqn. 1):
where S1, S2, Sn-1 are the areas of each log 1 m in length, assuming a cylindrical geometric shape and measuring the diameter of each log at 0.5 m log length. The area of the top log, Sn, was estimated assuming a conical geometric shape.
The stem biomass was then calculated by multiplying the stem volume by the average WBD value estimated for each harvested tree. The biomass of branches, needles and twigs was calculated by multiplying the total fresh weight of the components by the dry-to-fresh weight ratio. The aboveground total biomass was then calculated by summing all the aboveground biomass components.
Volume and biomass equations
The volume equation was derived using the following formula (eqn. 2):
where D is the diameter at breast height (cm), H is the total height (m), and a is the scaling coefficient. Given that both D and H are subject to natural variation and measurement errors and are therefore not independent variables ([17]), we used a Reduced Major Axis (RMA) regression model II instead of an Ordinary Least Squares (OLS) regression to estimate the scaling coefficient in eqn. 2.
The choice of a linear model for volume prediction was primarily motivated because this approach is commonly used in Italy ([1]) and has also been adopted for the National forest inventory ([34]). Therefore, we used the linear form to compare the volume equation obtained in this study with that derived from the volume table for Pinus pinea L. provided by Tabacchi et al. ([33], [34]) for the Italian national forest inventory.
The most common mathematical model for estimating biomass in forestry is the power function. Accordingly, we adopted in this study a power function to model biomass allocation after performing a preliminary check of the fit ([41] - eqn. 3):
where Y is total biomass (kg) or one of its components, X is a tree dimension variable (e.g., D, H, DH) and a and b are the scaling coefficients. D is generally used as a single tree dimension predictor variable. Accordingly, we used D as a tree dimension variable, but we also investigated the influence of H as a second independent variable on the biomass predictions. Generally, the standard method to obtain estimates for the coefficients a and b is to use a linear regression of log-transformed data for X and Y ([40] - eqn. 4):
This transformation is appropriate if the standard deviation of Y at any X increases with X (heteroscedasticity - [18]). If this relationship holds, it implies that values of Y can be measured more accurately at low values of X than at high values of X ([38]). The linear form is applied to the log transformed data, and estimates for ln a and b are derived ([40]). The log transformation also results in homeoscedasticity of the transformed data; this property is a prerequisite for the regression model ([40]).
However, even though the equation for the log transformed data is mathematically equivalent to eqn. 3, they are not identical in a statistical sense ([24], [40]). In fact, using eqn. 4 produces a systematic bias when ln Y is converted back to the original scale. Several procedures to overcome bias in logarithmic regression estimates have been proposed ([32], [40]). In the current study, we first estimated the scaling coefficients by applying the log transformation (eqn. 4). We also used RMA regression analysis in this case to incorporate uncertainties associated with the X variable. We then calculated the scaling coefficients with a modified Gauss-Newton iterative method, assuming an additive error term ([26]). We assumed that the nonlinear procedure guaranteed the additivity property ([24]). The performance of each model for volume and biomass was tested using the relative difference (RD) criterion (eqn. 5):
where y and ÿ denote the real and the predicted response variable (i.e., biomass or volume), respectively. The root mean squared error (RMSE) and coefficient of determination (R2) were also reported. All statistical analyses were performed using R version 2.13.1 ([29]), with the “lmodel2” package uploaded.
Root sampling
At the two study sites in Sardinia, 14 trees were used for root biomass determination by excavation. Root sampling was not performed at the Castel Fusano study site because of regulatory constraints. The mean horizontal area covered by the root system of a tree was assumed to be equivalent to the crown cover, neglecting differences in natural overlap. Moreover, anastomosis was not observed in the harvested roots. The stump and the soil associated with the selected trees were then removed with a hydraulic excavator to the maximum depth of root penetration, which was approximately equal to 2 m. Roots were accumulated in layers according to soil horizons and depth. In each layer, roots were selected and washed by screening the soil through a sieve; the roots were then manually sorted into the following components: (i) fine roots (< 2 cm); (ii) coarse roots (> 2 cm); (iii) taproot; (iv) hypogeal stump.
The total fresh weight of the root components was measured in the field with a portable digital scale with ± 1 g precision. A sample of the components was then dried to a constant weight in a forced-air stove at 85 ± 2 °C for 4-6 days to reach constant dry weight. This procedure allowed the dry-to-fresh weight ratio (θ) of the root components to be estimated. The total dry biomass for each component was then calculated by multiplying the total fresh weight of the components by the dry-to-fresh weight ratio.
Biomass expansion factors (BEFs)
BEFs were computed only for the aboveground components due to limited root sampling. The BEF was obtained as the ratio of the total aboveground biomass to the stem biomass and volume ([14]). We did not test the dependence of the BEF on stand age due to the similar stand age of the studied stands. Using the 14 trees harvested for root sampling, we also calculated the root-to-shoot ratio (RSR) and root-to-biomass ratio (RBR) as the ratio of the root biomass to the total aboveground biomass and the ratio of the root biomass to the total above + belowground biomass, respectively.
Results
Wood basic density and height-diameter relationships
WBD averaged 538 ± 11 kg m3 over the entire dataset. WBD did not differ significantly among sites or between structural types (one-way ANOVA) and was not significantly correlated with either D or H. Moreover, WBD did not vary significantly with height (one-way ANOVA).
The analysis of the H-D power function (log transformed data) showed a significant effect of the site on the H-D relationship (ANCOVA, p<0.01). Moreover, a significant effect was found between structural types in the Castel Fusano study site (ANCOVA, p<0.05). Accordingly, the H-D equations were calculated separately for each site and structural type using log transformations of both H and D (Tab. 2). H and D were highly correlated only for the Bidderosa site; low correlations were obtained for Is Arenas and Castel Fusano (structural type C) because of the low R2 values of the log transformed data, despite the statistically significant correlation found between the two variables. The worst results were obtained with structural type B at the Castel Fusano study site (Tab. 2), most likely because of the influence of firm-seeding, the stand structure and the silvicultural practices applied in this stand. H and D were not statistically correlated for this structural type and site.
Tab. 2 - Reduced Major Axis (RMA) regression coefficients for height (H) and diameter at the breast height (D) using log-transformed data. The expression for regression was: ln(H)=ln(a)+b ln(D). Standard errors (SE) of the regression coefficients, root-mean squared errors (RMSE) of the regressions and significance of the regressions (Prob) are reported.
| Site | ln(a) | a | b | SE ln(a) |
SE (b) |
R2 | RMSE | Prob |
|---|---|---|---|---|---|---|---|---|
| Biderosa | 0.44 | 1.55 | 0.54 | 0.2 | 0.08 | 0.79 | 0.08 | 0.01 |
| CFUS-B | 2.91 | 18.3 | -0.005 | 0.14 | 0.04 | 0.0004 | 0.05 | 0.42 |
| CFUS-C | 2.24 | 9.42 | 0.13 | 0.14 | 0.04 | 0.21 | 0.06 | 0.02 |
| Is Arenas | 2.01 | 7.46 | 0.12 | 0.16 | 0.05 | 0.06 | 0.07 | 0.03 |
Allometric equations
Neither the site nor the structural type affected the volume estimates (ANCOVA); accordingly, a generalized volume equation was developed for the entire dataset. The RMA linear model II obtained takes the following form (eqn. 6):
Tab. 3 - Volume and biomass values estimated in the studied stands. Standard errors are reported in parentheses. RMA refers to the linear regression of log-transformed data (eqn. 4); NL refers to nonlinear regression.
| Estimate | Component | Parameters | BDR | CFUS-B | CFUS-C | ISAR |
|---|---|---|---|---|---|---|
| Volume (m3 ha-1) |
Current study | V=0.039(D2H) | 112.9 (0.9) |
299.6 (6.7) |
252 (6.2) |
181.5 (0.9) |
| Tabacchi et al. ([34]) | V=0.041(D2H) -0.40 |
111.1 (0.9) |
310 (4.7) |
259.3 (6.4) |
180.4 (0.9) |
|
| Biomass (Mg ha-1) |
Aboveground | RMA | 108.7 (0.9) |
236 (9.1) |
190.5 (3.2) |
145.5 (0.8) |
| NL | 114.5 (0.9) |
237.5 (9.2) |
193 (3.3) |
152.9 (0.8) |
||
| Stem | RMA | 76.6 (0.6) |
165.3 (2.5) |
133.5 (3.3) |
102.5 (0.5) |
|
| NL | 85.4(0.7) | 160.7 (2.4) |
132.7 (3.3) |
113.6 (0.6) |
||
| Stem+Branches | RMA | 93.4 (0.8) |
211.7 (3.2) |
169.8 (4.2) |
125.3(0.6) | |
| NL | 98 (0.8) |
203.8 (3.1) |
165.5 (4.1) |
130.8 (0.7) |
||
| Photosynthetic | RMA | 17.7 (0.1) |
24.5 (0.4) |
21 (0.5) |
27.4 (0.1) |
|
| NL | 17.5 (0.1) |
17.8 (0.3) |
20.9 (0.5) |
26.8 (0.1) |
Tab. 4 - Goodness-of-fit statistics from the residual analysis performed in volume (184 trees) and biomass (77 trees) data set. RMA and NL refers to the linear and nonlinear procedure, respectively.
| Component | Context | Dataset | R2 | RMSE | RD |
|---|---|---|---|---|---|
| Volume | Tabacchi et al. ([34]) | All data | 0.97 | 62.57 | 0.08 |
| Current study | All data | 0.98 | 55.17 | 0.08 | |
| Aboveground total biomass |
RMA | All data | 0.97 | 97.2 | 0.17 |
| NL | All data | 0.93 | 96.59 | 0.18 | |
| Photosynthethic biomass | RMA | BDR | 0.72 | 4.39 | 0.17 |
| NL | BDR | 0.91 | 3.91 | 0.23 | |
| RMA | CFUS-B | 0.63 | 11.69 | 0.17 | |
| NL | CFUS-B | 0.71 | 16.39 | 0.31 | |
| RMA | CFUS-C | 0.96 | 2.44 | 0.14 | |
| NL | CFUS-C | 0.83 | 2.74 | 0.15 | |
| RMA | ISAR | 0.86 | 5.18 | 0.13 | |
| NL | ISAR | 0.96 | 4.93 | 0.14 | |
| Stem Biomass | RMA | All data | 0.91 | 76.92 | 0.23 |
| NL | All data | 0.87 | 70.85 | 0.26 | |
| Stem and branches biomass |
RMA | All data | 0.92 | 87.93 | 0.2 |
| NL | All data | 0.9 | 85.14 | 0.21 |
(n=184, R2=0.98, p=0.01 ) where volume (V), D and H are expressed in dm3, cm and m, respectively. The measured volume was also well predicted by the equation provided by Tabacchi et al. ([34]); results from each study stand are reported in Tab. 3. On average, the RD values in both the equations were less than 10% (Tab. 4). Excluding H from the linear equation resulted in a lower accuracy for the volume predictions (eqn. 7):
(n=184, R2=0.91, p=0.01). The RD value in eqn. 7 averaged 53%.
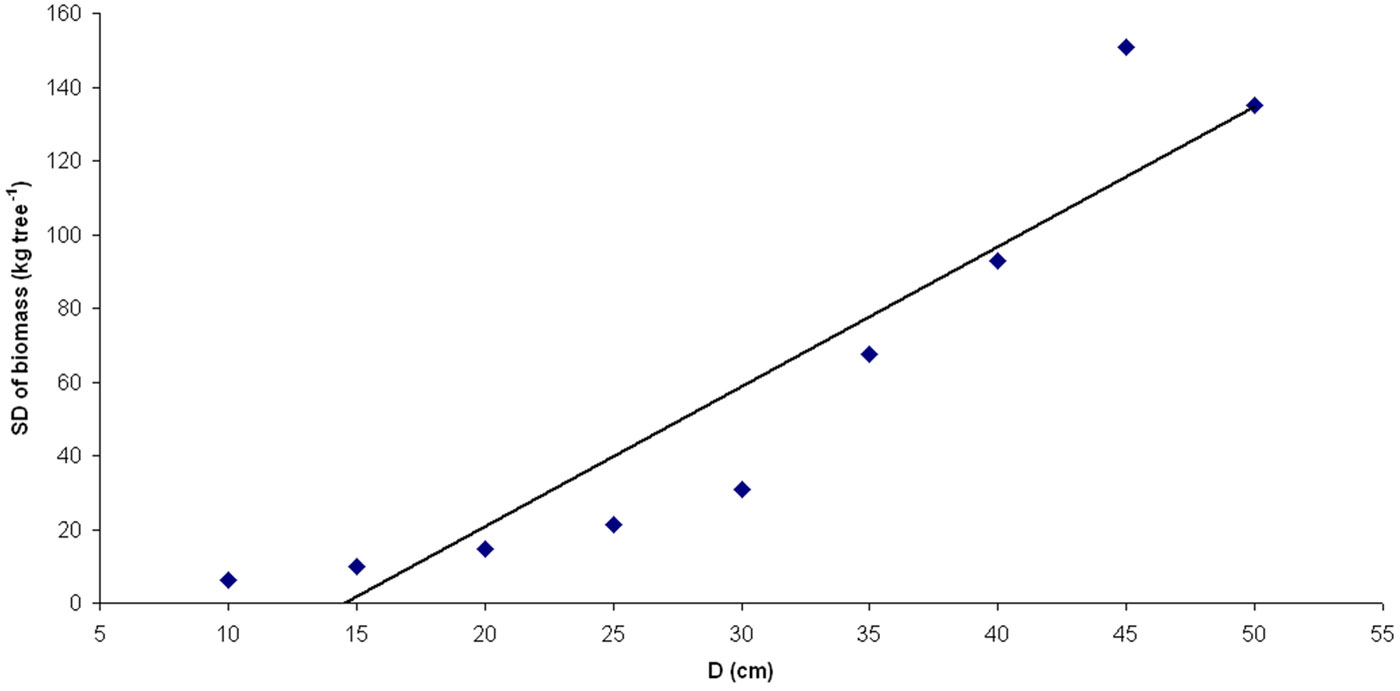
We found that the standard deviation of the biomass components at any D increased with D (Fig. 2). Accordingly, the data were log transformed using eqn. 4. Except for the photosynthetic component, no interactions were found between biomass components and site (ANCOVA, p<0.01). Similarly, no interactions were found between biomass components and structural type at the Castel Fusano study site with the exception of the photosynthetic component (ANCOVA, p<0.05). As a consequence, we predicted all biomass components by generalized equations using the entire dataset, with the exception of photosynthetic components, which were modeled separately for each site and structural type. The results are reported in Tab. 5. Root biomass and total biomass (above + belowground) were excluded from the analysis due to limited root sampling.
Fig. 2 - Standard deviation (SD) of tree biomass for 5 cm diameter size classes.
Tab. 5 - Regression coefficients for biomass components and diameter at the breast height (D) using linear (RMA) and nonlinear (NL) procedures.
| Dependent variable Y | n | Parameters | ln(a) | a | b | R2 | SE ln (a) |
SE (b) |
|---|---|---|---|---|---|---|---|---|
| Aboveground total biomass | 77 | RMA | -3.351 | 0.035 | 2.71 | 0.97 | 0.22 | 0.07 |
| 77 | NL | - | 0.054 | 2.594 | - | 0.022 | 0.11 | |
| Photosynthethic biomass | 77 | RMA | -3.822 | 0.022 | 2.271 | 0.88 | 0.31 | 0.1 |
| 77 | NL | - | 0.009 | 2.537 | - | 0.006 | 0.183 | |
| BDR | 20 | RMA | -4.66 | 0.00946 | 2.555 | 0.72 | 0.55 | 0.23 |
| 20 | NL | - | 0.001117 | 3.2 | - | 0.001198 | 0.316 | |
| CFUS-B | 15 | RMA | -11.091 | 0.000015 | 4.192 | 0.63 | 1.13 | 0.41 |
| 15 | NL | - | 0.0000001 | 5.449 | - | 0.000000 | 0.85 | |
| CFUS-C | 17 | RMA | -5.449 | 0.004303 | 2.68 | 0.96 | 0.51 | 0.18 |
| 17 | NL | - | 0.01066 | 2.428 | - | 0.01143 | 0.294 | |
| ISAR | 25 | RMA | -4.019 | 0.01798 | 2.406 | 0.86 | 0.32 | 0.12 |
| 25 | NL | - | 0.009569 | 2.591 | - | 0.006031 | 0.179 | |
| Stem Biomass | 77 | RMA | -3.641 | 0.026 | 2.694 | 0.91 | 0.28 | 0.09 |
| 77 | NL | - | 0.091 | 2.346 | - | 0.038 | 0.114 | |
| Stem and branches biomass | 77 | RMA | -3.88 | 0.021 | 2.819 | 0.92 | 0.24 | 0.08 |
| 77 | NL | - | 0.045 | 2.602 | - | 0.019 | 0.114 |
The nonlinear regression coefficients were estimated using a nonlinear Gauss-Newton iterative procedure. The input coefficients used were those obtained from the linear formula (eqn. 4). The results are reported in Tab. 5.
Both approaches provided good estimates of biomass; on average, the RD values obtained with the two approaches were always less than 30% regardless of the biomass component considered (Tab. 4). Overall, the linear regression underestimated the measured biomass, whereas the nonlinear regressions overestimated the measured biomass, considering either total aboveground biomass or its distinct components. Because of its lower RMSE, the nonlinear method yielded more accurate results than the linear method despite the relatively small differences in the biomass estimates. The inclusion of H in all the equations tended neither to increase R2 nor to decrease RMSE.
Root sampling
The taproot represented the largest fraction of root biomass (57.4 %), followed by coarse roots (22.3 %), fine roots (10.6 %) and hypogeal stump (9.7 %). The RSR ranged from 0.11 to 0.42 (average 0.25 ± 0.03); the RBR ranged from 0.10 to 0.30 (average 0.19 ± 0.02). Although no significant correlations were found between RSR and D or between RBR and D, both indices appeared to decrease as D increased.
Biomass expansion factor
Using nonlinear equations for biomass and linear eqn. 6 for volume, we calculated the BEF factor for total aboveground biomass given either stem biomass or volume. The BEF values ranged from 1.34 to 1.48 based on stem biomass (average ± standard error: 1.40 ± 0.04) and from 0.77 to 1.01 based on stem volume (average ± standard error: 0.85 ± 0.06).
Discussion
The WBD value found by this study was similar to that reported by previous studies for the same species ([14], [8]). A satisfactory correlation between height and diameter was found only for the Bidderosa site, where the sampled trees were characterized by a lower height than the trees at the Castel Fusano and Is Arenas sites. It is well known that height growth in stone pine is quite slow in habitats where natural resources are limiting. In such habitats, the dominant trees tend to be approximately 10-20 m in height or even less when culminating ([22]). Therefore, it is reasonable to infer that the low height growth pattern in stone pine would cause the height-diameter growth function to be relatively inaccurate, particularly for taller trees, in which the diameter would culminate later than the height. In addition, the low R2 obtained for structural type B in Castel Fusano most likely indicates the influence of firm-seeding, stand structure and the applied silvicultural practices on the tree height curves. Strip-planting provided a high stand density and, as a result, supported a rapid and relatively uniform height growth pattern in the stand trees, regardless of individual diameter; for this reason, diameter and height were not significantly correlated ([11]). Overall, it is probable that the reliability of H as an explanatory variable in allometric equations for stone pine should be carefully evaluated. Other stand variables, such as stand density, stand age and dominant height, could be used to improve the fraction of variance explained by the height-diameter growth model ([5]).
The volume allometry agreed well with that derived for stone pine by Tabacchi et al. ([34]) for the Italian National forest inventory; as such, the volume data obtained in this study can be used to implement the existing generalized equation for Pinus pinea, thus providing a more comprehensive database for stone pine to be developed and used at the regional and national scales.
Biomass can be measured more precisely at low than at high values of D (Fig. 2). Moreover, diameter explained much of the variability in biomass values. Including height in the biomass equation did not significantly improve the fraction of variance explained by the biomass models, in contrast to the results of previous studies ([8], [30]). This outcome has usually been explained by the high correlation between D and H (multicollinearity; [18], [39]). Conversely, the low correlation between D and H observed in the current study most likely indicates that the explanatory power of H is lower than that of D. Note, however, that the inclusion of H improves the linear equation for volume obtained in the current study (eqn. 6); therefore, the choice of the form of the mathematical function (e.g., a linear or power function) for the volume and biomass allometries should be of importance in selecting and including tree dimension variable predictors such as H.
The nonlinear regression method used for estimating biomass outperformed the linear method using log transformed data (eqn. 3). However, relatively small differences were found between the two approaches. Although the linear method produces a systematic bias in biomass retrieval, Beauchamp & Olson ([3]) found very little difference between the measured and uncorrected estimates. This result is consistent with the corresponding findings of the current study.
The total aboveground biomass appeared insensitive to stand density and structure in stone pine. The scaling exponents b obtained from both the linear and nonlinear aboveground biomass equations were similar to the universal exponent b=8/3 derived from a universal structural model of the vascular network proposed at the tree level by West et al. ([37]) and also empirically demonstrated by Anfodillo et al. ([2]).
Photosynthetic biomass is the only aboveground biomass component that differed among sites and between structural types. This result could be explained by the occurrence of distinctive crown shape features in stone pine. Because canopy architecture is strongly influenced by stand structure, different crown architecture shapes occur, ranging from the globulus and umbrella to the candelabrum type depending on stand characteristics ([7]). This outcome should be carefully evaluated when canopy photosynthesis models are calibrated. The results also confirmed the high investment in crown biomass occurring in stone pine and facilitating high cone production in this species.
The mean RSR value found (0.25) was in agreement with those reported in different pine species ([19], [36]). The RSR was lower than the 0.30 obtained by Correia et al. ([8]) and the 0.32 reported by IPCC ([15]), both in Portuguese pine stands, but it was similar to the 0.24 obtained by Ruiz-Peinado et al. ([30]) for stone pine stands in Spain. The results also outlined the importance of the taproot system in stone pine, in agreement with Frattegiani et al. ([13]), who demonstrated the importance of a long taproot in this species to avoid competition from understory vegetation, particularly during the juvenile phase of stand development.
Conclusions
Better volume and biomass estimates are essential to a wide range of studies, including forest inventory, carbon and nutrient cycling and global change. Our study demonstrated several differences in biomass allocation in stone pine, a consequence of different stand characteristics. These results underscored the importance of stand-dependent factors and equations for calibrating biomass. Nevertheless, this study also enabled generalized equations for volume, biomass and carbon factors to be developed for stone pine. These results can integrate and extend the existing databases for allometry and carbon factors for this Mediterranean species ([31]).
Acknowledgements
This research was supported by RI.SELV. ITALIA Research Program 3.1 - “Silviculture, productivity and conservation of forest ecosystems” research project, funded by the Italian Ministry of Agriculture and Forest Policies. The study was also funded by the Municipality of Rome, Department for Environmental Policies and Agricultural Resources, within the research project “Management of stone pine stands in Castel Fusano National Natural Reserve”. The study was also funded by Ente Foreste della Sardegna within the research project “Aboveground biomass and carbon equations of stone pine in Sardinia”. We would like to thank Dr. Antonio Casula (Ente Foreste della Sardegna) and Dr. Simona Pallanza (Corpo Forestale e di Vigilanza Ambientale - Oristano) for logistical assistance. We also thank Massimiliano Hajny, Tessa Giannini, Claudia Becagli, Umberto Cerofolini, Andrea Ciofini, Luigi Mencacci and Maurizio Piovosi (CRA-SEL) for assistance with field data collection.
References
Gscholar
Gscholar
Gscholar
Gscholar
Gscholar
Gscholar
Gscholar
Gscholar
Gscholar
Gscholar
Gscholar
Gscholar
Gscholar
Gscholar
Gscholar
Gscholar
Authors’ Info
Authors’ Affiliation
Francesco Chianucci
Maria Chiara Manetti
Consiglio per la Ricerca e la sperimentazione in Agricoltura, Forestry Research Centre (CRA-SEL), v.le S. Margherita 80, I-52100 Arezzo (Italy )
Corresponding author
Paper Info
Citation
Cutini A, Chianucci F, Manetti MC (2013). Allometric relationships for volume and biomass for stone pine (Pinus pinea L.) in Italian coastal stands. iForest 6: 331-335. - doi: 10.3832/ifor0941-006
Academic Editor
Luca Salvati
Paper history
Received: Dec 28, 2012
Accepted: May 14, 2013
First online: Aug 29, 2013
Publication Date: Dec 02, 2013
Publication Time: 3.57 months
Copyright Information
© SISEF - The Italian Society of Silviculture and Forest Ecology 2013
Open Access
This article is distributed under the terms of the Creative Commons Attribution-Non Commercial 4.0 International (https://creativecommons.org/licenses/by-nc/4.0/), which permits unrestricted use, distribution, and reproduction in any medium, provided you give appropriate credit to the original author(s) and the source, provide a link to the Creative Commons license, and indicate if changes were made.

Web Metrics
Breakdown by View Type
Article Usage
Total Article Views: 64551
(from publication date up to now)
Breakdown by View Type
HTML Page Views: 51109
Abstract Page Views: 5351
PDF Downloads: 6160
Citation/Reference Downloads: 95
XML Downloads: 1836
Web Metrics
Days since publication: 4680
Overall contacts: 64551
Avg. contacts per week: 96.55
Article Citations
Article citations are based on data periodically collected from the Clarivate Web of Science web site
(last update: Mar 2025)
Total number of cites (since 2013): 24
Average cites per year: 1.85
Publication Metrics
by Dimensions ©
Articles citing this article
List of the papers citing this article based on CrossRef Cited-by.
Related Contents
iForest Similar Articles
Research Articles
Allometric equations to assess biomass, carbon and nitrogen content of black pine and red pine trees in southern Korea
vol. 10, pp. 483-490 (online: 12 April 2017)
Research Articles
Effects of planting density on the distribution of biomass in a douglas-fir plantation in southern Italy
vol. 8, pp. 368-376 (online: 09 September 2014)
Research Articles
Allometric equations to estimate above-ground biomass of small-diameter mixed tree species in secondary tropical forests
vol. 13, pp. 165-174 (online: 02 May 2020)
Research Articles
Equations for estimating belowground biomass of Silver Birch, Oak and Scots Pine in Germany
vol. 12, pp. 166-172 (online: 15 March 2019)
Research Articles
Belowground biomass models for young oligotrophic Scots pine stands in Latvia
vol. 11, pp. 206-211 (online: 01 March 2018)
Technical Reports
Biomass equations for European beech growing on dry sites
vol. 9, pp. 751-757 (online: 17 June 2016)
Technical Reports
Allometric biomass and carbon factors database
vol. 1, pp. 107-113 (online: 09 July 2008)
Research Articles
Estimation of aboveground forest biomass in Galicia (NW Spain) by the combined use of LiDAR, LANDSAT ETM+ and National Forest Inventory data
vol. 10, pp. 590-596 (online: 15 May 2017)
Research Articles
Aboveground tree biomass of Araucaria araucana in southern Chile: measurements and multi-objective optimization of biomass models
vol. 14, pp. 61-70 (online: 09 February 2021)
Research Articles
Allometric models for estimating biomass, carbon and nutrient stock in the Sal zone of Bangladesh
vol. 12, pp. 69-75 (online: 24 January 2019)
iForest Database Search
Search By Author
Search By Keyword
Google Scholar Search
Citing Articles
Search By Author
Search By Keywords
PubMed Search
Search By Author
Search By Keyword


