Tree biomass and carbon density estimation in the tropical dry forest of Southern Western Ghats, India
iForest - Biogeosciences and Forestry, Volume 11, Issue 4, Pages 534-541 (2018)
doi: https://doi.org/10.3832/ifor2190-011
Published: Aug 01, 2018 - Copyright © 2018 SISEF
Research Articles
Abstract
United Nations Framework Convention on Climate Change highlights the significance of carbon storage and emission in forests towards climate change mitigation. The aim of this study was to quantify the tree biomass and carbon density (carbon storage) in the tropical dry forest of the Chinnar Wildlife Sanctuary of Kerala located in the Southern Western Ghats, India. We investigated the species-wise contribution of carbon (C) storage, as well as the species-wise and plot-wise correlation between carbon and other dendrometric variables. We also analysed the girth (diameter) wise distribution of carbon and tree density in the study region. The study was conducted in eight selected sample plots of the region, each with an area of 0.1 hectare. Species-specific volume and specific gravity relationship coupled with suitable regression equation were used to estimate biomass. Tree carbon was assumed to be 47% of the biomass. The results showed that the average biomass and carbon density of the vegetation were 64.13 t ha-1 and 30.46 t-C ha-1, respectively. Among the 32 species identified, Tamarindus indica L. (17%), Hardwickia binata Roxb. (14%), Terminalia arjuna (Roxb. ex DC.) Wight & Arn (10%) and Pleiospermium alatum (Wight & Arn.) Swingle (10%) were dominant as for carbon storage. The correlation analysis showed that basal area is a good predictor of tree biomass and carbon, while the role of tree density and tree diversity remain uncertain in determining carbon storage. With respect to diametric class distribution, tree density showed a reverse J-shaped pattern indicating the sustainable regeneration of the analysed forest, where the small- (diameter at breast height 3-9 cm) to medium-sized trees (diameter at breast height 10-69 cm) were found to contribute to more than 50% of biomass and carbon in the forest. The study provides useful information for carbon mitigation strategies in a tropical dry forest in the Southern Western Ghats.
Keywords
Above Ground Tree Biomass, Carbon, Tropical Dry Forest, Kerala, Southern Western Ghats
Introduction
Forests represent a significant part of the global carbon cycle and play an important role in carbon sequestration. Forests cover 40% of the terrestrial surface though they contribute by 90% and 70% to terrestrial biomass and productivity, respectively ([27]). The significant role of forests in containing global carbon dioxide levels (CO2) was acknowledged in Kyoto in December 1997. In the present climate change scenario, the international community is increasingly made aware of the fact that the alleviation of global warming cannot be achieved without the inclusion of forests in the mitigation plan. Reducing Emissions from Deforestation and Forest Degradation and enhancing forest carbon (REDD+) is a new initiative of the United Nations Framework Convention on Climate Change (UNFCCC). It is led by developing countries with rich forest cover and calls for economic incentives to reduce the emissions of greenhouse gases from deforestation and forest degradation in developing countries ([17]). Beyond carbon sequestration, REDD+ is also expected to play a major role in other ecosystem services and has the potential to generate benefits for indigenous and local communities. To achieve and optimize these “co-benefits”, the developing countries need to have well-established estimates of forest carbon densities or stocks for a successful implementation of mitigating policies and to take advantage of the REDD+ programme ([45]). According to Canadell & Raupach ([8]), increasing the carbon density or stock of existing forests is also an important option in this regard. It is therefore vital to understand the potential role of forests, especially tropical forest, in curtailing the impact of global warming. As the climate change debate progresses, policy makers also require more scientific and reliable information on the current status of carbon storage that would benefit in effective resource management, in developing policies and setting priorities for the forest in Southern Western Ghats, India.
Tropical dry forests represent 42% of the landmass in the tropics ([31]) and are estimated to detain 110 Gt (giga tonne) vegetation carbon compared to 134 Gt vegetation carbon in tropical rainforests ([15]). Among the major tropical forest types, tropical dry forests are the most threatened, as about 90% of these forests are exposed to a variety of threats largely resulting from human activity ([31]). Further, while tropical rainforests are the most studied among the tropical forest types, the seasonally dry tropical forests have been seriously neglected ([13]). These forests are characterized by seasonal rainfall, with several months of severe drought in the annual cycle ([33]). Regarding the total forest cover in India, tropical dry deciduous forests cover an area of 34.80 % followed by tropical moist deciduous forests (33.19 %), tropical semi evergreen forests (7.72 %) and tropical wet evergreen forests (7.54 % -[44]). Various attempts were made in the recent past to evaluate biomass and carbon density/stock in different forest types in India and these estimates exhibit large temporal and spatial variation. Hence, it is important to develop suitable biomass estimation methods which minimize errors for accurate and consistent reporting of forest carbon inventories.
The Western Ghats (south-western India) is known for its rich biodiversity and endemism, and is prone to high risk of anthropogenic impacts in the form of deforestation, developmental activities, expansion of plantations and habitat fragmentation ([32]). Any alterations in this ecosystem can directly contribute to carbon emission, thus turning it in a potential carbon source. Therefore, it is inevitable to appraise the status of forests in terms of regional terrestrial carbon storage and their role in global warming abatement. Although there is a growing interest in estimating the biomass of forests and their role in carbon cycling, a baseline database involving tree biomass and carbon are lacking from the tropical dry forests of Chinnar in Southern Western Ghats.
In the present study, we included small-diameter trees (DBH < 10 cm), which are generally ignored in carbon sequestration studies due to the absence of suitable equations, thereby improving the precision and accuracy of biomass and carbon estimation. This will provide a strong basis for management programmes which prioritize carbon sequestration in the tropical dry forest of Chinnar in Southern Western Ghats. Our main objectives were: (i) to estimate tree biomass and carbon density of the forest ecosystem; (ii) to identify the major carbon storing tree species in the ecosystem; (iii) to examine the both species- and plot-wise relationship between carbon and other stand variables (dendrobiometric variables); (iv) to investigate the distribution of carbon among different diametric classes along with tree density in the area. The hypotheses tested in this study were: (i) dendrobiometric variables like basal area, tree density and tree diversity are good indicators and predictors of biomass and carbon of the system; (ii) smaller to medium trees have a greater role in carbon storage compared to the larger trees in the tropical dry forest.
Materials and methods
Study area
The study region is the lower area of southern tropical dry forest in the Chinnar Wildlife Sanctuary (400-500 m a.s.l.) in Idukki district of Kerala, India. It is situated in the Southern Western Ghats part of peninsular India (Fig. 1a). Chinnar Wildlife Sanctuary comprises an area of 9.044 ha located between 77.09568° E - 77.20435° E longitude and 10.25063° N - 10. 35212° N latitude, along the rain shadow region of the Southern Western Ghats. The terrain is undulating and rocky and the annual rainfall ranges from 300 to 500 mm in Chinnar ([23]). Since the area is located in the rain shadow region, unlike most forests of Kerala, only about 48 rainy days occur in a year during the northeast monsoon. The temperature ranges from a minimum of 13 °C during December to a maximum of 37.8 °C during April and May. The dry period lasts for 6-7 months at the lower elevations, while it shorter at higher altitude. Relative humidity also varies from 19 to 100% during the rainy months of October and November ([24]). The climate of Chinnar is generally dry and soil is sandy loam with weak fine granular structure ([9]). The dominant height of vegetation is up to 16 meters in the dry deciduous forest, which covers about 50 % of the total forest area ([24]). The main tree species are Pleiospermium alatum (Wight & Arn.) Swingle, Canthium coromandelicum (Burm.f.) Alston, and Atalantia monophylla DC. Other major species include Chloroxylon swietenia DC. Cordia sinensis Lam., Acacia planifrons Wight & Arn., Azadirachta indica A. Juss., Dichrostachys cinerea (L.) Wight & Arn., Tamarindus indica L., Sapindus emarginatus Vahl , Cordia gharaf (Forssk.) Ehrenb. ex Asch, Lepisanthes tetraphylla (Vahl) Radlk., Vitex leucoxylon L.f., Sapindus emarginatus Vahl (see Tab. S1 in Supplementary material). Although the region falls within the protected area, anthropogenic interference such as tribal settlements and interstate highway (road) passing through the sanctuary poses quite a few threats to the biota in the ecosystem.
Fig. 1 - Location of the study area (a) and scheme of the sampling plots (b).
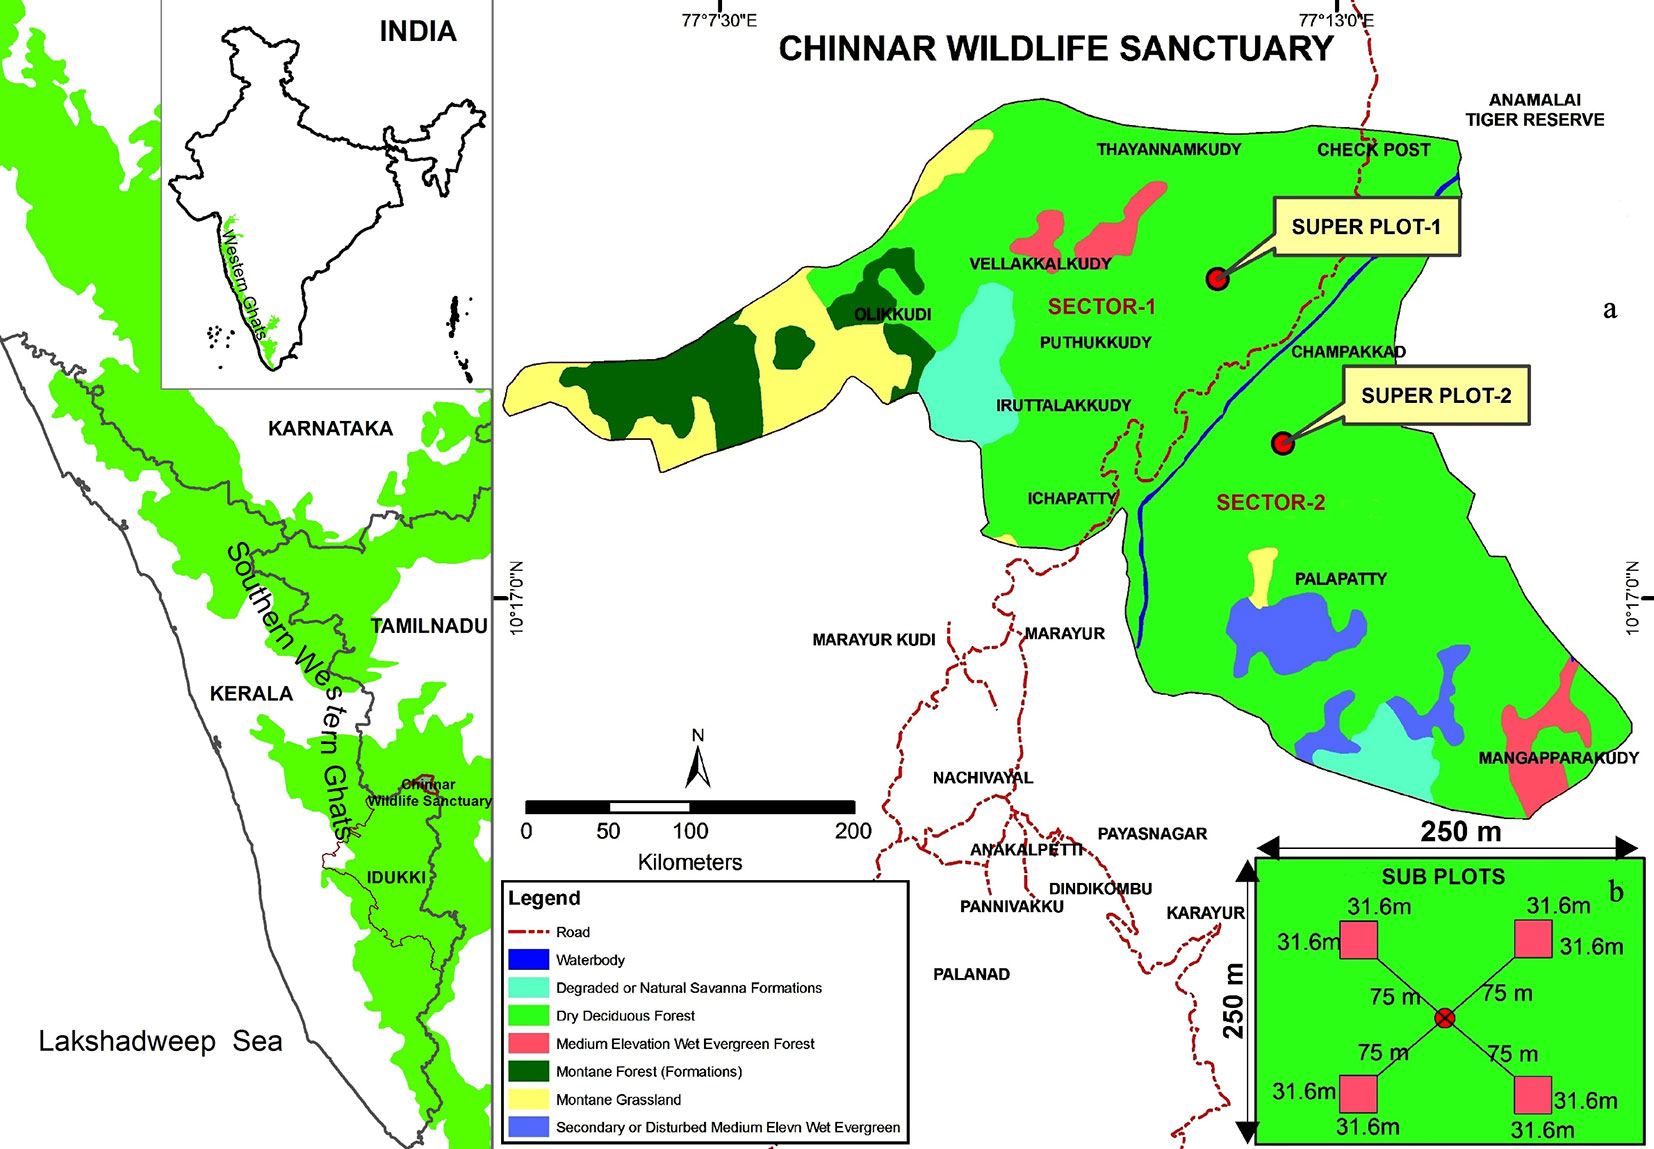
Sampling and data collection
The adopted methodology for data collection is mainly from the Intergovernmental Panel on Climate Change guidelines ([21]) for terrestrial carbon inventory specifically under land use, land use change and forestry (LULUCF) category, as well as from the field manual for vegetation carbon pool assessment of India ([47]). For the purpose of sampling, species composition, topography, soil type and climatic conditions of the dry forest were taken into account. The whole area was subdiveded in two main sectors, which are split by a stream and a road (Fig. 1). A major plot (hereafter called “super plot”) of 250×250 m was randomly established in each sector. Four subplots of 31.6 × 31.6 m (0.1 ha) were then established in the four corners of each super plot, whose distance from the center of the major plot was 75 m (Fig. 1b). Such eight subplots from the two sectors were surveyed for the carbon inventory of the dry forest. Tree diameter at breast height (DBH ≥ 3 cm) and tree height were recorded with respect to species. All tree species were identified with the help of regional flora of Sasidharan ([46]) and other standard floras. Tree height was measured with a Blume-Leiss hypsometer and the diameter was measured at breast height using a diameter tape. The study was carried out during 2011-2012.
Aboveground stem biomass (AGB) trees with DBH ≥ 10 cm
For trees having DBH ≥ 10 cm, the aboveground phytomass (stem biomass) was calculated by multiplying the volume calculated for individual trees by wood specific gravity in the respective plot ([5], [43]). Biomass was expressed as stem dry weight and measured in tonnes (t). Tree volume was calculated using species-specific volume equations developed by Forest Survey of India ([16]) - Tab. 1), using the diameter at breast height (DBH or D) and height (H) as inputs. Area-specific generalized volume equations developed by FSI were selected for those species for which equations were not available. Wood specific gravity data was obtained from Indian Council of Forestry Research and Education ([20] - Tab. 1). For those tree species whose species-specific gravity was not available, an area-specific average gravity was calculated. The obtained stem biomass of each tree was then summed up within each plot to obtain the plot-level biomass (t 0.1 ha-1).
Tab. 1 - List of volume equations and specific gravity values used in the present study. (*): Average specific gravity; (GV): generalized volume equation; (V): species-specific volume equation; (D): diameter at breast height; (H): tree height.
| No. | Tree species | Volume equation | Specific gravity |
|---|---|---|---|
| 1 | Albizia amara (Roxb.) B.Boivin | V = -0.033-0.526·D+6.396·D2 | 0.950 |
| 2 | Atalantia monophylla DC. | GV = 0.16948-1.85075·D+10.63682·D2 | * |
| 3 | Azadirachta indica A.Juss. | GV = 0.16948-1.85075·D+10.63682·D2 | 0.680 |
| 4 | Bauhinia racemosa Lam | V = -0.04262+6.09491·D2 | * |
| 5 | Canthium coromandelicum (Burm.f.) Alston | GV = 0.16948-1.85075·D+10.63682·D2 | 0.805 |
| 6 | Canthium sp. | GV = 0.16948-1.85075·D+10.63682·D2 | 0.805 |
| 7 | Chloroxylon swietenia DC. | GV = 0.16948-1.85075·D+10.63682·D2 | 0.980 |
| 8 | Commiphora berri (Arn.) Engl. | GV = 0.16948-1.85075·D+10.63682·D2 | * |
| 9 | Commiphora caudata (Wight & Arn.) Engl. | GV = 0.16948-1.85075·D+10.63682·D2 | * |
| 10 | Cordia gharaf (Forssk.) Ehrenb. ex Asch | V = -0.49388+7.56417·D-31.45373·D2+50.93877·D3 | 0.495 |
| 11 | Dichrostachys cinerea (L.) Wight & Arn. | GV = 0.16948-1.85075·D+10.63682·D2 | * |
| 12 | Diospyros cordifolia Roxb | V = 0.024814-0.578532·D+6.11017·D2 | 0.760 |
| 13 | Diospyros ebenum J.Koenig ex Retz. | V = 0.024814-0.578532·D+6.11017·D2 | * |
| 14 | Diospyros ovalifolia Wight. | V = (-0.184139+2.89723·D)2 | 0.760 |
| 15 | Ehretia ovalifolia Wight. | V = 0.0790+0.4149·D2H | 0.600 |
| 16 | Euphorbia antiquorum L | V = -0.0287+0.48016 ·D2H | * |
| 17 | Ficus microcarpa L.f. | V = 0.0153+0.3856·D2H | 0.530 |
| 18 | Ficus sp. | V = 0.0153+0.3856·D2H | * |
| 19 | Gmelina arborea Roxb. | V = 0.25058-3.55124 ·D+16.41720·D2 | 0.470 |
| 20 | Grewia villosa Willd. | V = 0.015+0.281·D2H | 0.651 |
| 21 | Gyrocarpus americanus Jacq. | GV = 0.16948-1.85075·D+10.63682·D2 | 0.305 |
| 22 | Hardwickia binata Roxb.(Endemic) | V = -0.023583+0.279452·D2H | 0.733 |
| 23 | Ixora pavetta Andr. | GV = 0.16948-1.85075·D+10.63682·D2 | 0.860 |
| 24 | Lepisanthes tetraphylla (Vahl) Radlk. | GV = 0.16948-1.85075·D+10.63682·D2 | * |
| 25 | Mitrephora heyneana (Hook. f. & Thomson) Thwaites | GV = 0.16948-1.85075·D+10.63682·D2 | 0.645 |
| 26 | Pleiospermium alatum (Wight & Arn.) Swingle | GV = 0.16948-1.85075·D+10.63682·D2 | 0.890 |
| 27 | Sapindus emarginatus Vahl | GV = 0.16948-1.85075·D+10.63682·D2 | * |
| 28 | Strychnos nux-vomica L. | GV = 0.16948-1.85075·D+10.63682·D2 | 0.750 |
| 29 | Strychnos potatorum L.f. | GV = 0.16948-1.85075·D+10.63682·D2 | 0.840 |
| 30 | Tamarindus indica L. | GV = 0.16948-1.85075·D+10.63682·D2 | 0.960 |
| 31 | Terminalia arjuna (Roxb. ex DC.) Wight & Arn. | V = -0.033-0.526·D+6.396·D2 | * |
| 32 | Vitex leucoxylon L.f. | V = 0.066+0.287 ·D2H | 0.771 |
Basal area
Basal area (BA) was calculated as the sum of cross-sectional area (m2) measured at breast height (1.3 m) of all trees in each plot, according to Hedl et al. ([18]).
AGB trees with DBH < 10 cm
As trees belonging to small diameter classes (diameter 3-9 cm) are generally ignored due to the lack of suitable equations, biomass estimation of trees with < 10 cm DBH was assessed by developing suitable regression equation relating the basal area and stem biomass in the plots ([11]). The detailed methodology is described below (see also Fig. 2).
Fig. 2 - Schematic diagram describing the methodology followed for estimating the aboveground biomass of trees with DBH < 10 cm.
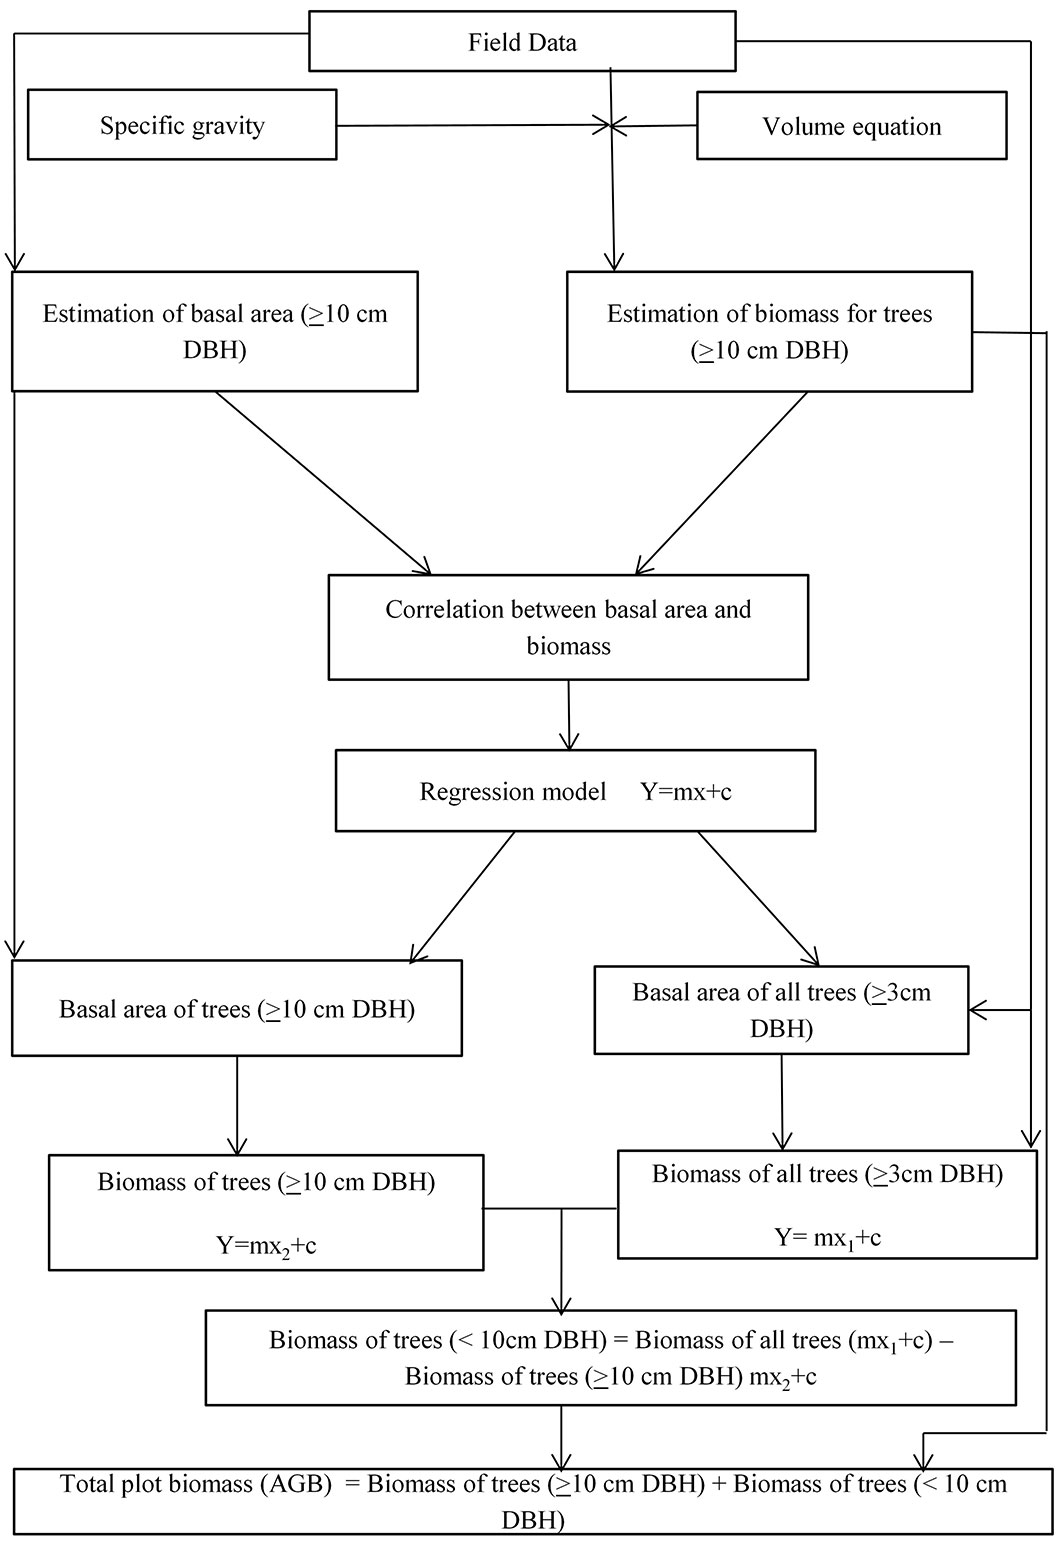
Firstly, the basal area (m2 0.1 ha-1) of trees with DBH ≥ 10 cm and the basal area of all trees with DBH ≥ 3 cm were calculated in each plot. Stem biomass of trees with DBH ≥ 10 cm was obtained by multiplying the volume by specific gravity and then correlated with the basal area of trees with DBH ≥ 10 cm. A linear regression model was used as follows (eqn. 1):
where Y is the biomass (t 0.1 ha-1), c is the intercept, m is the line slope, and x is the basal area of trees (m2 0.1 ha-1).
Linear regression coefficients (m, c) obtained from the above model were applied on the basal area of trees with DBH ≥ 10 cm and on the basal area of all trees (≥ 3 cm diameter) in the plot to obtain the biomass of the respective components. Within each plot, the difference in biomass between trees with DBH ≥ 3 cm and DBH ≥ 10 cm within a plot was obtained as follows (eqn. 2):
where Y is the biomass of trees with DBH < 10 cm, m and c are constants, x1 is the total basal area of all trees with DBH > 3cm, and x2 is the basal area of trees with DBH ≥ 10 cm.
The difference (biomass of trees with DBH < 10 cm) was then added to the total estimated biomass of trees with DBH ≥ 10 cm (volume × specific gravity) to obtain the total plot biomass (stem biomass) in t 0.1 ha-1, which was finally extrapolated into tonnes per hectare (t ha-1).
Estimation of total biomass and carbon density of trees in the plot
As canopy branches and leaves were not included in this study, the stem dry biomass was multiplied by a biomass expansion factor of 1.5 to obtain the total aboveground biomass of each tree. The biomass expansion factor adopted in this study is species-based, according to the different density classes of Indian forest types previously reported ([26]). The below ground biomass (BGB) was calculated from the obtained aboveground biomass considering a shoot/root ratio of 0.26 ([7]). This ratio is commonly used and did not differ much with respect to latitude, soil texture or tree type ([43]). The total biomass within each plot was then obtained by summing AGB and BGB. Since the carbon content varies from 45% to 50% of the total biomass in different ecosystems according to different studies, we cautiously considered the carbon content to be 47% of the dry woody biomass for regional-level carbon pool estimations ([41]). Biomass values were then multiplied by a factor of 0.47 to obtain the amount of carbon existing in dry wood biomass. Biomass and carbon obtained from each subplot were summed to obtain the site standing biomass and carbon (expressed in tonnes dry weight). The average value of the standing biomass and carbon of the eight subplots was thus considered as the total biomass and carbon density of the forest ecosystem, expressed in t ha-1.
Relationship between carbon and other dendrometric variables
Pearson’s correlation analysis was carried out using the software SPSS® ver. 12.0 to test the relationship between carbon density and other dendrometric variables like tree density (in terms of number of trees), basal area and tree diversity (in terms of number of species). To this purpose, both species- and plot-wise correlation approaches were adopted. As for the former, all the species occurring in different subplots were taken together and the relationships among variables examined, whereas in the case of plot-wise correlation, the relationships among variables was examined across the 8 subplots, regardless of the species.
Results and discussion
General characteristics of forest
A large heterogeneity of tree diameter and height was observed among the subplots, reflecting the growth differences among different tree species in each subplot (Tab. 2, Tab. 3). Indeed, tree growth is highly variable in the tropical forest ([14]), thus a detailed appraisal of species composition, environmental and genetic factors, ecological history, management practices (especially in the context of climate change), is required in order to comprehend growth variations of tree species in the forest. Further, previous studies suggested that climate change can affect the distribution of tree species in the forest ([50]) which in turn will change the regional patterns of forest biodiversity even at the plot level ([39]).
Tab. 2 - Estimated values (± standard error, SE) of biomass, carbon and other dendrometric variables in the 8 subplots analyzed. (n): Total number.
| Variable | Subplot | Average ± SE | |||||||
|---|---|---|---|---|---|---|---|---|---|
| 1 | 2 | 3 | 4 | 5 | 6 | 7 | 8 | ||
| Tree density (stems 0.1 ha-1) | 55 | 59 | 53 | 67 | 112 | 57 | 35 | 45 | 60.37 ± 8.11 (n = 483) |
| Tree density (stems ha-1) | 550 | 590 | 530 | 670 | 1120 | 570 | 350 | 450 | 603.75 ± 81.13 (n = 4830) |
| Average DBH (cm) | 14.69 | 8.67 | 10.39 | 8.85 | 5.84 | 20.25 | 8.55 | 7.38 | 10.57 ± 4.69 |
| Average height (m) | 5.01 | 3.41 | 4.68 | 3.9 | 2.81 | 5.94 | 3.64 | 3.68 | 4.13 ± 0.36 |
| Number of species (species 0.1 ha-1) | 8 | 10 | 12 | 8 | 10 | 19 | 10 | 8 | 10.625 ± 1.29 (n = 32) |
| Total tree basal area (m2 0.1 ha-1) | 1.4 | 0.79 | 0.79 | 0.49 | 0.34 | 3.4 | 0.33 | 0.27 | 0.98 ± 0.38 |
| Total tree basal area (m2 ha-1) | 14.05 | 7.88 | 7.88 | 4.93 | 3.43 | 34.96 | 3.27 | 2.73 | 9.89 ± 3.82 |
| Total AGB (t 0.1ha-1) | 10.53 | 3.32 | 3.30 | 2.90 | 1.22 | 15.98 | 1.39 | 2.05 | 5.08 ± 1.88 |
| Total AGB (t ha-1) | 105.3 | 33.2 | 33 | 29 | 12.2 | 159.8 | 13.9 | 20.5 | 50.86 ± 18.8 |
| Total AGBC (t-C ha-1) | 50.02 | 15.77 | 15.68 | 13.78 | 5.80 | 75.91 | 6.60 | 9.74 | 24.15 ± 8.91 |
| Total BGB (t 0.1 ha-1) | 2.74 | 0.86 | 0.85 | 0.75 | 0.31 | 4.155 | 0.36 | 0.53 | 1.31 ± 0.48 |
| Total tree biomass -AGB+BGB (t 0.1 ha-1) | 13.27 | 4.19 | 4.16 | 3.66 | 1.54 | 20.13 | 1.75 | 2.58 | 6.41 ± 2.3 |
| Total tree carbon (t-C 0.1 ha-1) | 6.30 | 1.99 | 1.97 | 1.73 | 0.73 | 9.56 | 0.83 | 1.22 | 3.04 ± 1.12 |
| Total tree biomass -AGB+BGB (t ha-1) | 132.78 | 41.9 | 41.63 | 36.62 | 15.4 | 201.38 | 17.52 | 25.83 | 64.13 ± 23.65 |
| Total tree carbon (t-C ha-1) | 63.07 | 19.9 | 19.77 | 17.39 | 7.32 | 95.66 | 8.32 | 12.27 | 30.46 ± 11.23 |
Tab. 3 - Species-wise (top 5 species with DBH > 10 cm) contribution to carbon storage recorded in the eight subplots, covering an overall area of 0.8 ha.
| No. | Species | Tree density (no. trees) |
Total tree basal area (m2) |
Total tree carbon (t) |
Average tree carbon (t) |
|---|---|---|---|---|---|
| 1 | Tamarindus indica L. | 8 | 1.36 | 3.76 (17%) | 0.47 |
| 2 | Hardwickia binata Roxb. | 2 | 0.67 | 3.10 (14%) | 1.55 |
| 3 | Terminalia arjuna (Roxb. ex DC.) Wight & Arn. | 1 | 0.97 | 2.35 (10%) | 2.35 |
| 4 | Pleiospermium alatum (Wight & Arn.) Swingle | 31 | 0.41 | 2.27 (10%) | 0.07 |
| 5 | Atalantia monophylla DC. | 23 | 0.29 | 1.44 (6%) | 0.06 |
Estimation of biomass, carbon and other dendrometric variables
Tree density (number of trees) ranged ranging from 35 to 112 trees for the 32 species recorded in this study. The average DBH of the subplots varied between 5.84 and 20.25 cm. Tree height ranged between 2.81 and 5.94 m, whereas the total basal area ranged between 0.27 and 3.4 m2 across subplots. The estimated AGB varied between 1.22 and 15.98 t 0.1 ha-1 and BGB varied between 0.31 and 4.15 t 0.1 ha-1. Combining AGB and BGB over all the plots and computing its weighted average, the total tree biomass (dry weight) of the site was found to be 64.13 ± 23.65 t ha-1. Since the carbon constitutes generally half of the biomass weight (dry weight), in this study the carbon density of the tropical dry forest was estimated to be 30.46 ± 11.23 t-C ha-1 (Tab. 2).
According to Murphy & Lugo ([34]), the aboveground carbon density in tropical dry forest varies between 14 and 123 t-C ha-1. Chaturvedi et al. ([10]) reported a carbon density ranging from 15.6 to 151 t-C ha-1 in tropical dry forests of India. Even though the above ground biomass carbon (AGBC) obtained in the present study is well within the limits of tropical dry forests, the results obtained are comparatively lower than the values reported in other tropical dry forest of India and elsewhere ([36]). This might be due to a larger number of short structured trees or younger stands (3-9 cm DBH, 10-69 DBH) compared to larger trees (>70 DBH cm) in the studied area. Moreover, the loss of water accumulated in the stem would result in a reductions in stem diameter of trees in the dry (deciduous) forest ([12]). Hence, the observed dendrobiometric variables (DBH, height, basal area and biomass) likely reflect the preponderance of short structured trees, mainly shaped by the climatic conditions of the area (Tab. 2).
The tropical dry forest is composed of a mosaic of different plant types showing varying adaptations to seasonal drought ([3]). Local differences in the extent and intensity of seasonal drought might have caused (to some extent) the observed spatial variation in the carbon content between plots. Moreover, the presence of a stream running near some of the study subplots could have locally reduced the water stress by keeping the soil moister and supplied trees with more nutrients, thus favoring tree growth as compared with the dry conditions occurring across the region. The occurrences in the examined plots of large species such as Terminalia arjuna (Roxb. ex DC.) Wight & Arn. and Vitex leucoxylon L.f which are generally found along stream banks, can support the above considerations. Furthermore, the intensity of human disturbance across the forest could be highly heterogeneous. Hence, the spatial heterogeneity of carbon density among the studied plots can be attributed to various biotic, abiotic and anthropogenic factors. Nonetheless, the carbon density values observed in this study are comparatively lower than those reported for other forest types in India (tropical moist deciduous forests, tropical semi-evergreen forests, tropical evergreen forests and tropical rainforests - [1], [45]).
Species-wise contribution carbon storage and its relationship with other dendrometric variables
In this work, we aimed to identify the leading carbon storing species in the area by considering trees with DBH > 10 cm. A substantial portion of carbon density (92%) in the forest system was contributed by diameter class ≥ 10 cm, with a tree density share of 33% when compared to the other class (DBH < 10 cm) of trees (see below). Among the 32 species recorded in the selected area, Tamarindus indica L. showed the maximum carbon storage capacity (17%) followed by Hardwickia binata Roxb. (14%), Terminalia arjuna (Roxb. ex DC.) Wight & Arn. (10%) and Pleiospermium alatum (Wight & Arn.) Swingle (10% - Tab. 3). These top four species stored almost half the carbon (50.90%) that is stored by all the dominant species identified in the area. It is worth noting that Tamarindus indica is not native to this region and commonly confined to areas adjacent to human settlements, though its wide use as for food and medicines could have contributed to its spread in the studied area. In addition, the favorable conditions provided by the stream might also have influenced its luxuriant growth. However, in the context of conservation, the relative significance of native and non-native species are to be studied with respect to their ecosystem functions.
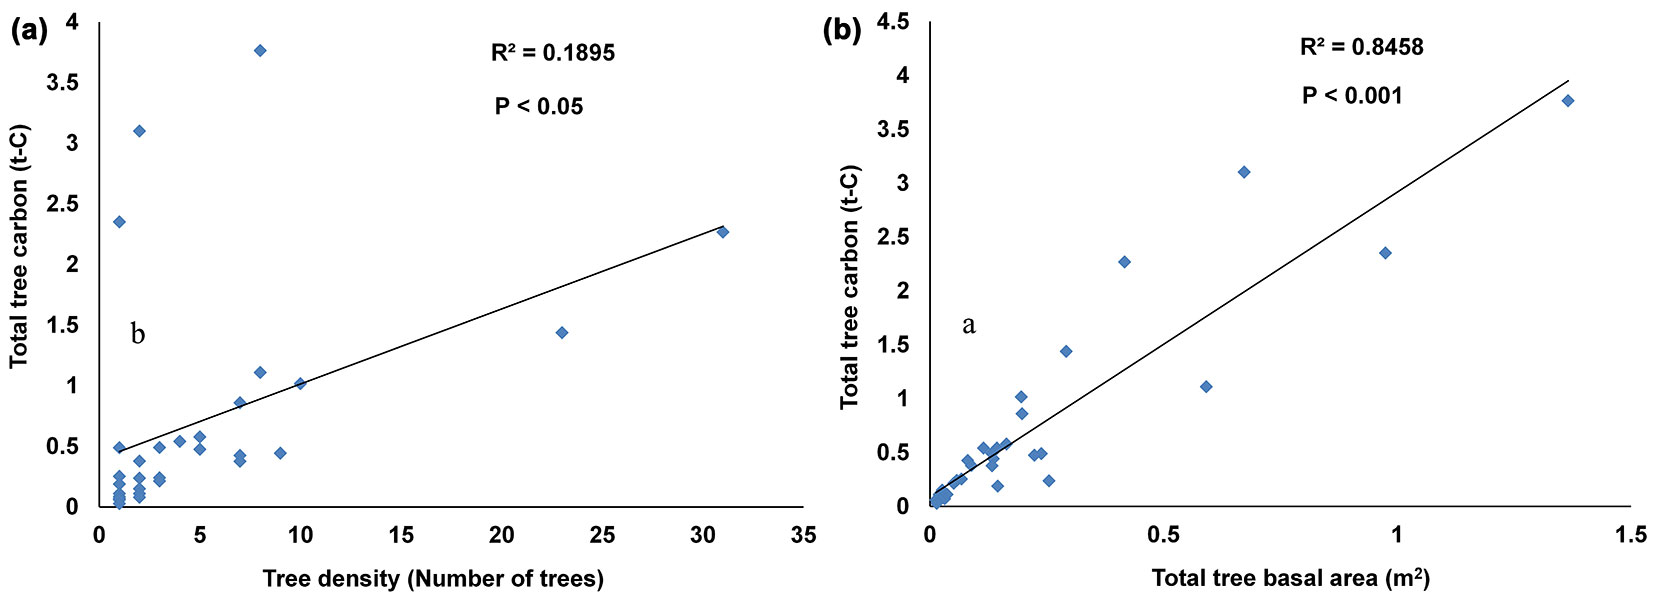
Tree size coupled with tree density provides an indication of the aboveground carbon storage, which is an important parameter of forest structure ([35]). The result indicated that species-wise tree carbon (DBH ≥ 10 cm) had a strong positive correlation with basal area (R2 = 0.84, p < 0.001). Such parameter may be conveniently used as an indicator for biomass and carbon, since it integrates the effect of both the number and size of trees ([6]). On the other hand, tree carbon showed a weak (though significant) positive relationship with tree density (R2 = 0.18, p < 0.05 - Fig. 3a, Fig. 3b). All the above findings could help selecting the most suitable species and species combinations for enhancing carbon sequestration in the studied area.
Fig. 3 - Species-wise (32 species with ≥ 10cm DBH) relationship between carbon and other dendrometric variables recorded from the eight subplots (0.8 ha). (a) Tree carbon and tree density; (b) tree carbon and basal area.
Plot-wise relationship between carbon and other dendrometric variables
In this study, we examined the relationship between carbon and other tree variables of the different studied plots using all the trees, regardless of their diameter (DBH < 10 cm and DBH ≥ 10 cm - Fig. 4a, Fig. 4b, Fig. 4c). In this case, tree density showed a non-significant negative relationship with carbon (R2 = 0.02, p = 0.731). This might be due to the occurrence of a large number of small trees (DBH 3-9 cm) in different plots, which altogether constitute 67% of trees and represent a negligible (8%) carbon share in the area (Fig. 5). Thus, the plot-wise correlation analysis revealed that forest plots with higher tree density are not rich in carbon. This finding is in agreement with the evidence that carbon in tree biomass increases with DBH, basal area and height, but not with tree density ([19]). Pragasan ([40]) observed a positive relationship between tree density and carbon in the case of plot-wise correlation, when trees with DBH > 10 cm were considered.
Fig. 4 - Plot-wise (0.1 ha area) relationship between carbon and other dendrometric variables. (a) Tree carbon and tree density; (b) tree carbon and tree diversity (number of tree species); (c) tree carbon and basal area.
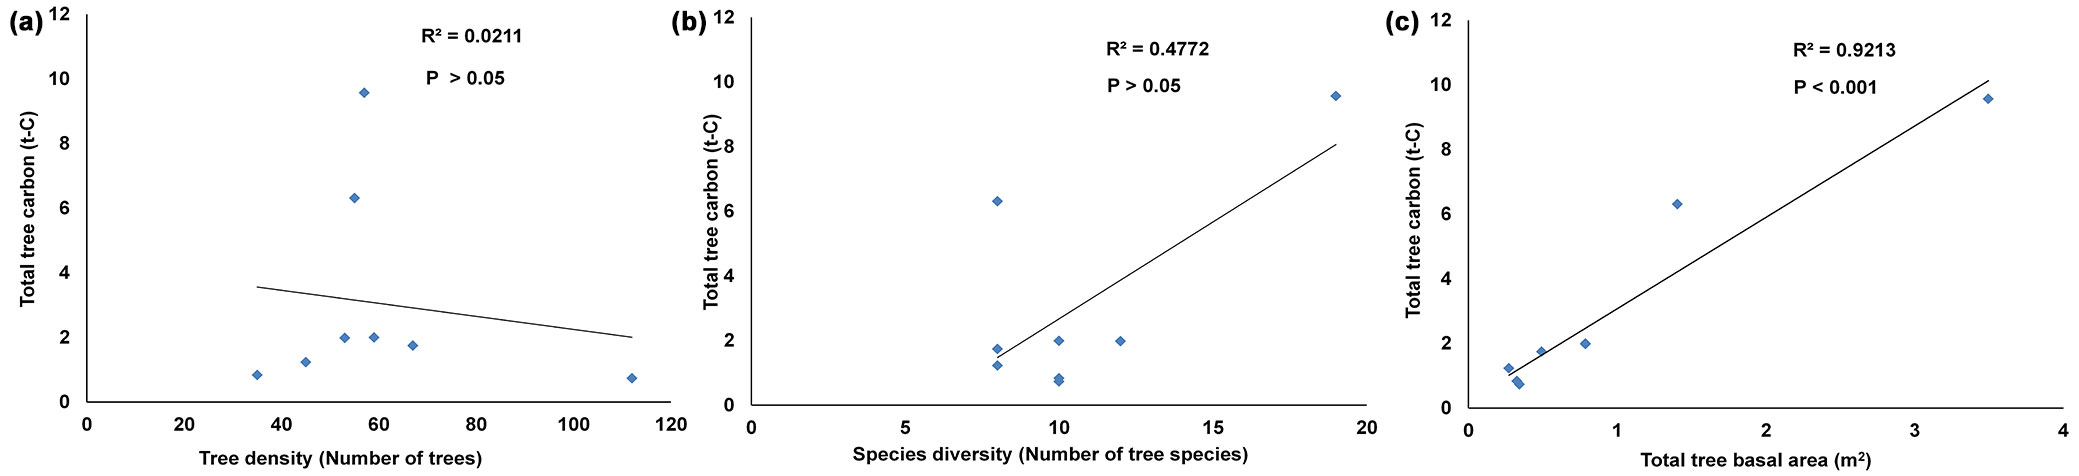
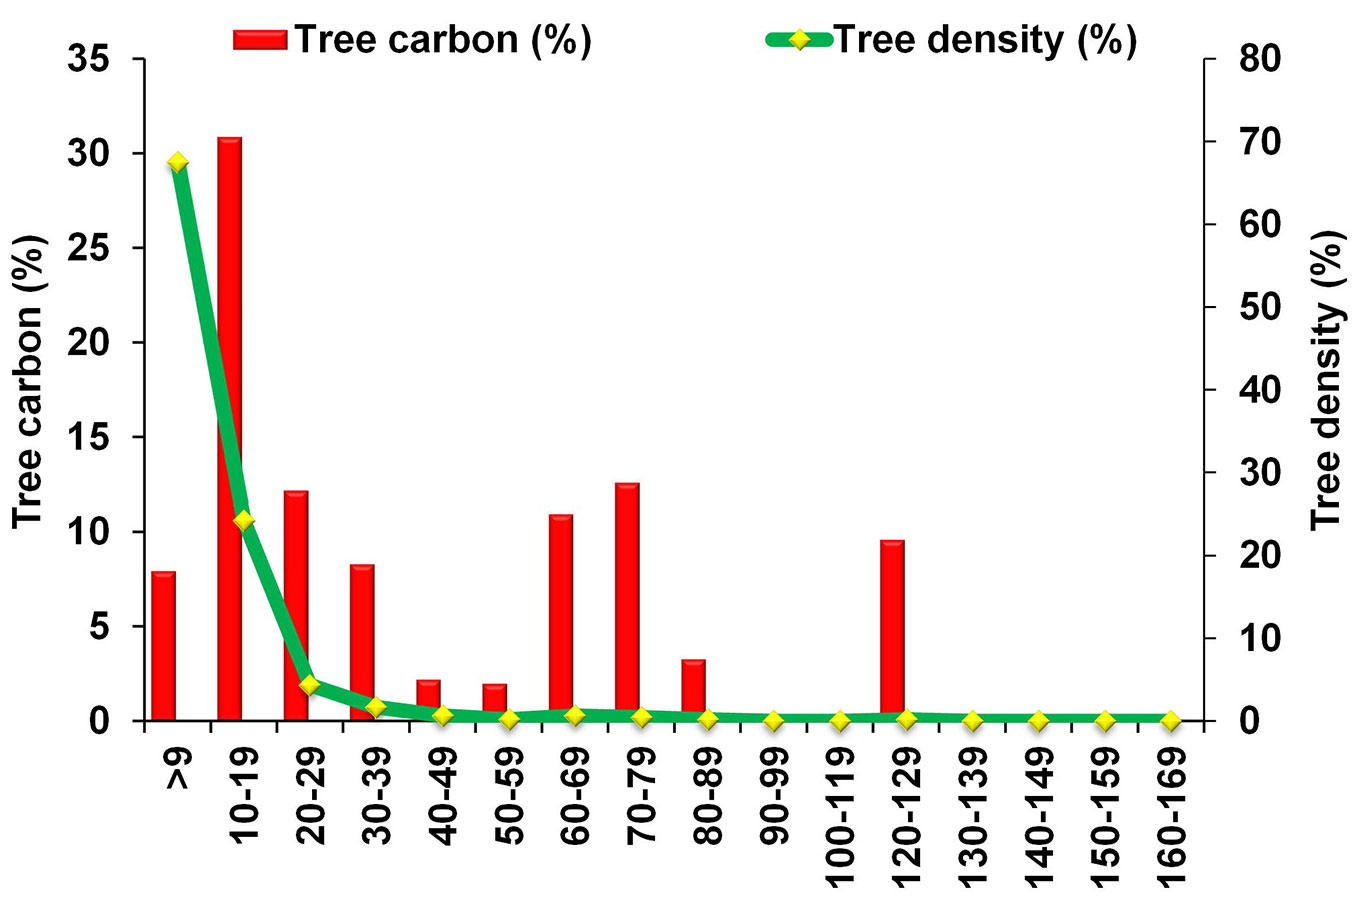
Fig. 5 - Distribution of tree density (%) and tree carbon (%) across different diametric classes.
Tree diversity (in terms of number of species) also showed a moderate positive relationship with carbon density, though not significant (R2 = 0.47, p = 0.058). These results are in agreement with the available literature ([2]). It may be inferred that promoting tree diversity may accelerate CO2 sequestration from the atmosphere to a certain extent and thus be relevant in a climate-change context. Although some experimental works carried out in different ecosystems showed that plant diversity often promotes stability and primary productivity and consequently carbon accumulation ([30]), the relationship between plant diversity and carbon density in tropical forests still remains unclear.
In this study, the strong positive relationship observed between carbon density and basal area (R2 = 0.92, p < 0.001) is in accordance with numerous previous studies in India ([29], [10]). Moreover, the kind of association established between carbon and basal area could also be used in predicting forest carbon in the region.
Overall, the results of the correlation analysis (both species- and plot-wise) indicate that basal area has a strong relationship with carbon storage, while contrasting results have been obtained with tree density and tree diversity. This is contrary to our first hypothesis that all the three variables could be considered as good indicators of biomass and carbon storage in the forest.
Resolving the relationship of dendrometric variables with carbon stock is central to predict their possible contribution to climate change mitigation. Without understanding the interactions between these factors, it is difficult to predict the effects of future change on carbon cycling or translate results between sites with different characteristics.
Diametric class distribution of tree density and carbon
The diameter distribution of trees can be used as an indicator of changes in population structure and species composition ([37]). Regarding the tree density, it has been reported that distribution curves that drop exponentially with increasing DBH (reverse J-shaped) are characteristic of species with continuous and sustainable regeneration ([25]). Such a trend has also been detected in forests of Great Andaman groups ([38]), Saddle peak of North Andaman Islands ([49]) and Thailand ([25]). Moreover, diameter distribution across diametric classes can provide relevant information on how well site resources are exploited by the growing forest. Such a distribution is ecologically more informative when accompanied with data on the spatial distribution of individuals ([28]). Despite the extreme climatic conditions occurring in the area and the above-mentioned threats, our findings suggest that the studied forest has a good regeneration, as revealed by the higher density of small diametric classes (DBH 3-9 cm) compared to large diametric classes (DBH ≥ 70 cm - Fig. 5).
The distribution of carbon contents across different diametric classes is considered the most important aspect when examining vegetation carbon storage of an area ([1]). We observed a positively skewed distribution of carbon in the dry forest, with small- (DBH 3-9 cm) and medium-sized trees (10-69 cm DBH) contributing by more than 50% to total biomass and carbon (Fig. 5). This highlights the role of young stands (small to medium sized trees) in the carbon accumulation of tropical dry forest of Chinnar, and substantiates our second hypothesis that younger trees deeply affect carbon storage in tropical dry forest ecosystems. Previous studies showed that large trees (DBH > 70 cm) can play a vital role in carbon storage in forest ecosystem ([1]), though small to medium trees have a prominent role in carbon storage of tropical dry forests ([4], [2]).
Climatic variables such as temperature and rainfall had a major role in shaping the structural characteristics and species composition of the studied forest, thereby promoting scrubby (thorny) and deciduous vegetation characterized by trees of stunted growth and low diametric class ([48]). Other factors like relative humidity, soil fertility and moisture, elevation, topography, and disturbance may also affect the growth and development of tree species in the tropical dry forest of Chinnar, as previously reported for other parts of the Western Ghats ([22], [42]).
Conclusions
The biomass and carbon density of trees in the tropical dry forest of Kerala in Southern Western Ghats was estimated to be 64.13 ± 23.65 t ha-1 and 30.46 ± 11.23 t-C ha-1, respectively, which are consistent with earlier studies. Based on our results, several species showing larger size with high carbon storage can be considered for afforestation/reforestation purposes to enrich the forest carbon density of the area.
Regarding our first hypothesis, we confirmed that basal area could be a useful proxy for biomass and carbon, while tree density and tree diversity gave inconclusive results. With respect to the second hypothesis, we found that smaller or moderate trees have greater carbon storage as compared to larger trees in the tropical dry forest.
Since our present findings are based on a limited field study dataset, further studies on shrubs, herbs, litter, deadwood, soil organic carbon and other biotic and abiotic factors are needed to substantiate the total carbon budget of the area. Further, replacing the general volume equations used in this study with more species-specific volume equations and the corresponding specific gravity for a vast majority of tree species in the dry forest, is required to improve the precision of estimates. Despite the above-mentioned limitations, considering the increasing importance of forest carbon sequestration and climate change mitigation, our findings and could help defining strategies for sustainable management and conservation of tropical dry forests, and also contributes to the national carbon inventory program of India.
Acknowledgements
We gratefully acknowledge the funding from the Indian Institute of Remote Sensing (IIRS), Dehradun, Indian Space Research Organisation (ISRO), Department of Space, Government of India. The authors acknowledge Directorate of Environment and Climate Change, Government of Kerala for the support extended for this work. We are grateful to members of School of Environmental Sciences for their assistance during data collection. The authors thank the Forest Department, Government of Kerala for the permission and assistance in data collection. We are indebted to Dr. Sarnam Singh for his invaluable contributions to the work. We express our gratitude to Dr. Susan Varghese, Prof. Jacob Eapen Kunnath, Dr. Appu Jacob John, and Prof. Vijo Thomas Kurian for proofreading and editing the manuscript. Finally, thanks to the anonymous reviewers for their criticism and their constructive comments that improved the quality of this manuscript.
References
Gscholar
Gscholar
Gscholar
Gscholar
Gscholar
Gscholar
CrossRef | Gscholar
Gscholar
Gscholar
Gscholar
Gscholar
Gscholar
Gscholar
Gscholar
Gscholar
Gscholar
Gscholar
CrossRef | Gscholar
Gscholar
Gscholar
Supplementary Material
Authors’ Info
Authors’ Affiliation
Joby Paul
Kasau Sreedharan
Toms Augustine
Kazhuthuttil K Jayasooryan
Mutharimettak Rameshan
Mahesh Mohan
Eswara V Ramasamy
School of Environmental Sciences, Mahatma Gandhi University, Kottayam 686 560 (India)
Viswanathan Shanthiprabha
Ambattu P Thomas
Advanced Centre of Environmental Studies and Sustainable Development (ACESSD), Mahatma Gandhi University, Kottayam 686 560 (India)
Corresponding author
Paper Info
Citation
Padmakumar B, Sreekanth NP, Shanthiprabha V, Paul J, Sreedharan K, Augustine T, Jayasooryan KK, Rameshan M, Mohan M, Ramasamy EV, Thomas AP (2018). Tree biomass and carbon density estimation in the tropical dry forest of Southern Western Ghats, India. iForest 11: 534-541. - doi: 10.3832/ifor2190-011
Academic Editor
Tamir Klein
Paper history
Received: Aug 04, 2016
Accepted: Jun 05, 2018
First online: Aug 01, 2018
Publication Date: Aug 31, 2018
Publication Time: 1.90 months
Copyright Information
© SISEF - The Italian Society of Silviculture and Forest Ecology 2018
Open Access
This article is distributed under the terms of the Creative Commons Attribution-Non Commercial 4.0 International (https://creativecommons.org/licenses/by-nc/4.0/), which permits unrestricted use, distribution, and reproduction in any medium, provided you give appropriate credit to the original author(s) and the source, provide a link to the Creative Commons license, and indicate if changes were made.

Web Metrics
Breakdown by View Type
Article Usage
Total Article Views: 59659
(from publication date up to now)
Breakdown by View Type
HTML Page Views: 46296
Abstract Page Views: 5827
PDF Downloads: 6328
Citation/Reference Downloads: 14
XML Downloads: 1194
Web Metrics
Days since publication: 2921
Overall contacts: 59659
Avg. contacts per week: 142.97
Article Citations
Article citations are based on data periodically collected from the Clarivate Web of Science web site
(last update: Jul 2026)
Total number of cites (since 2018): 33
Average cites per year: 3.67
Publication Metrics
by Dimensions ©
Articles citing this article
List of the papers citing this article based on CrossRef Cited-by.
Related Contents
iForest Similar Articles
Research Articles
Carbon stock in Kolli forests, Eastern Ghats (India) with emphasis on aboveground biomass, litter, woody debris and soils
vol. 4, pp. 61-65 (online: 05 April 2011)
Research Articles
Estimation of above-ground biomass and sequestered carbon of Taurus Cedar (Cedrus libani L.) in Antalya, Turkey
vol. 6, pp. 278-284 (online: 01 July 2013)
Review Papers
An overview of tree ecology and forest studies in the Northern Western Ghats of India
vol. 17, pp. 213-221 (online: 22 July 2024)
Research Articles
Effects of planting density on the distribution of biomass in a douglas-fir plantation in southern Italy
vol. 8, pp. 368-376 (online: 09 September 2014)
Research Articles
Allometric equations to estimate above-ground biomass of small-diameter mixed tree species in secondary tropical forests
vol. 13, pp. 165-174 (online: 02 May 2020)
Research Articles
Allometric models for estimating biomass, carbon and nutrient stock in the Sal zone of Bangladesh
vol. 12, pp. 69-75 (online: 24 January 2019)
Research Articles
Exploring machine learning modeling approaches for biomass and carbon dioxide weight estimation in Lebanon cedar trees
vol. 17, pp. 19-28 (online: 12 February 2024)
Research Articles
Estimation of above-ground biomass using machine learning approaches with InSAR and LiDAR data in tropical peat swamp forest of Brunei Darussalam
vol. 17, pp. 172-179 (online: 17 June 2024)
Research Articles
Above ground biomass estimation from UAV high resolution RGB images and LiDAR data in a pine forest in Southern Italy
vol. 15, pp. 451-457 (online: 03 November 2022)
Research Articles
Allometric equations to assess biomass, carbon and nitrogen content of black pine and red pine trees in southern Korea
vol. 10, pp. 483-490 (online: 12 April 2017)
iForest Database Search
Google Scholar Search
Citing Articles
Search By Author
- B Padmakumar
- NP Sreekanth
- V Shanthiprabha
- J Paul
- K Sreedharan
- T Augustine
- KK Jayasooryan
- M Rameshan
- M Mohan
- EV Ramasamy
- AP Thomas
Search By Keywords
PubMed Search
Search By Author
- B Padmakumar
- NP Sreekanth
- V Shanthiprabha
- J Paul
- K Sreedharan
- T Augustine
- KK Jayasooryan
- M Rameshan
- M Mohan
- EV Ramasamy
- AP Thomas
Search By Keyword


