

Assessing the restoration of a seasonally flooded riparian forest through soil carbon and nitrogen cycling indicators and soil microbial communities
iForest - Biogeosciences and Forestry, Volume 19, Issue 4, Pages 254-260 (2026)
doi: https://doi.org/10.3832/ifor4861-018
Published: Jul 21, 2026 - Copyright © 2026 SISEF
Research Articles
Abstract
The restoration of a six-year-old, seasonally flooded riparian forest planted with woody species native to the Brazilian Cerrado biome within a buffer zone system was evaluated based on soil carbon and nitrogen cycling parameters and soil microbial communities. Soil organic carbon, humic and fulvic acids, phospholipid fatty acid profiles of total bacteria and fungi, and selected functional microbial groups, such as aerobic/anaerobic and denitrifying communities, were used as indicators of soil quality and fertility. Restoration was progressing towards the soil conditions of a preserved riparian forest (PS) compared to a disturbed site (DS). However, a higher soil ammonium concentration was observed at the experimental site (ES) and DS than at PS, which was attributed to impaired nitrification due to periodic flooding. Principal component analysis confirmed that soil organic matter, cation exchange capacity, NO3-, and the denitrifying, anaerobic/aerobic, actinomycetes, and Gram-negative groups are suitable indicators for riparian site restoration. In contrast, soil NH4+ accumulation emerged as the main environmental impact hindering riparian forest recovery.
Keywords
Ammonium, Flooding, Humic Acids, Organic Carbon, Phospholipid Fatty Acid (PLFA)
Introduction
The Brazilian Cerrado biome (tropical savannah) has undergone intense deforestation over the last few decades, with a gradual replacement of its native vegetation by cropland and grazing areas, particularly in riparian zones ([6]). The riparian forests of the Velhas River, located in the São Francisco River basin within the Cerrado biome, have been degraded by anthropogenic, hydrologic, and geomorphological processes ([23]). The Sabará stream, a tributary of the Velhas River, is considered one of the most polluted rivers in this basin ([22]), and its riparian forest is subject to periodic flooding ([23]). Deforestation of the riparian forests along the Sabará stream floodplain, associated with periodic flooding, has led to erosion and destabilization of the stream margins, resulting in landscape degradation and stream siltation.
Riparian forests provide several ecosystem services related to erosion control, soil stabilization, and drainage, which are mediated by soil organic matter (SOM - [42]), including soil humic substances (HSs - e.g., humic and fulvic acids). These are the final decay products of lignin-rich plants. HSs, plant root systems, soil microbial communities, clays, ionic bridging, and polyvalent cations promote soil aggregation ([44]), which is primarily responsible for soil stabilization ([18]), improving soil fertility and reducing the risk of erosion ([29]). Land management and environmental impacts (e.g., deforestation, flooding, and fire) may disrupt soil aggregate stability by altering the soil microbial community, decomposition processes, HS formation, and soil carbon (C) accumulation ([27]). Therefore, some soil physicochemical properties, such as soil C, fulvic and humic acids, and soil aggregation, are considered soil health indicators ([42], [29]) and are reliable for riparian forest restoration ([24], [23], [40], [16]).
HSs may also play an important role in nitrogen (N) cycling, as they can retain and fix soil ammonium, the first product of organic N mineralization, due to its negative charge ([29]). However, flooding may cause alterations in N cycling, changing the soil oxygen availability ([35]) and the soil microbial community ([46]), especially those participating in the N cycle ([39], [37]), and consequently influencing key processes, such as nitrification and denitrification ([35]). Such biogeochemical processes are mediated by soil microorganisms whose activity depends on microbial community size (microbial biomass) and community composition, which may be modified by land use. Profiling of phospholipid fatty acids (PLFAs) in the microbial community structure has been widely used to assess changes in microbial communities in the soil, particularly those related to C and N availability in the soil ([16], [17]), and environmental stressors, such as flooding ([3], [46]). This method also enables the assessment of changes in some functional microbial groups, such as arbuscular mycorrhizal fungi and aerobic/anaerobic ([3]) and denitrifying ([13]) microbial communities.
Despite the known role of C and N biogeochemical cycles in the functioning of riparian zones, few studies have attempted to use these soil biogeochemical elements as indicators of riparian forest restoration ([7], [23], [40], [16]). In this study, we assessed the restoration progression of a six-year-old riparian forest planted with native species in the Velhas River basin, subject to periodic flooding, compared with a degraded site and a preserved riparian forest.
Material and methods
Study sites
The study sites (Fig. 1A, Fig. 1B) consisted of urban and peri-urban riparian sites, located on the right bank of the Sabará stream, a tributary of the Velhas River, in the São Francisco basin (Fig. 1A), in Sabará, Minas Gerais State, Brazil (19° 52′ 53.33″ S; 43° 47′ 38.76” W). The Sabará stream receives domestic waste from Sabará and from its tributary, Gaia stream, which is polluted by domestic and industrial waste from different cities (Fig. 1A, Fig. 1B). The Experimental Site (ES) is an urban riparian site that was previously used for grazing activity (Fig. 1C) and later subjected to restoration procedures (Fig. 1D). The predominant native vegetation in the region is tropical savannah (Brazilian Cerrado). The mean annual temperature is 22-23 °C, with dry winters and summer rainfall. The total annual rainfall ranged from 1200 to 1600 mm, and the margins of the Sabará stream are affected by annual floods ([31], [15]), increasing the flow rate from approximately 2810 (Fig. 1E) to 8000 m3 s-1 (Fig. 1F).
Fig. 1 - (A): Location of the Velhas River basin, highlighting Sabará and Gaia streams; (B): Location of experimental (ES), disturbed (DS) and preserved (PS) sites; (C): ES before revegetation; (D): ES, 4 years after restoration; (E): ES before flooding; (F): ES during a flooding event.
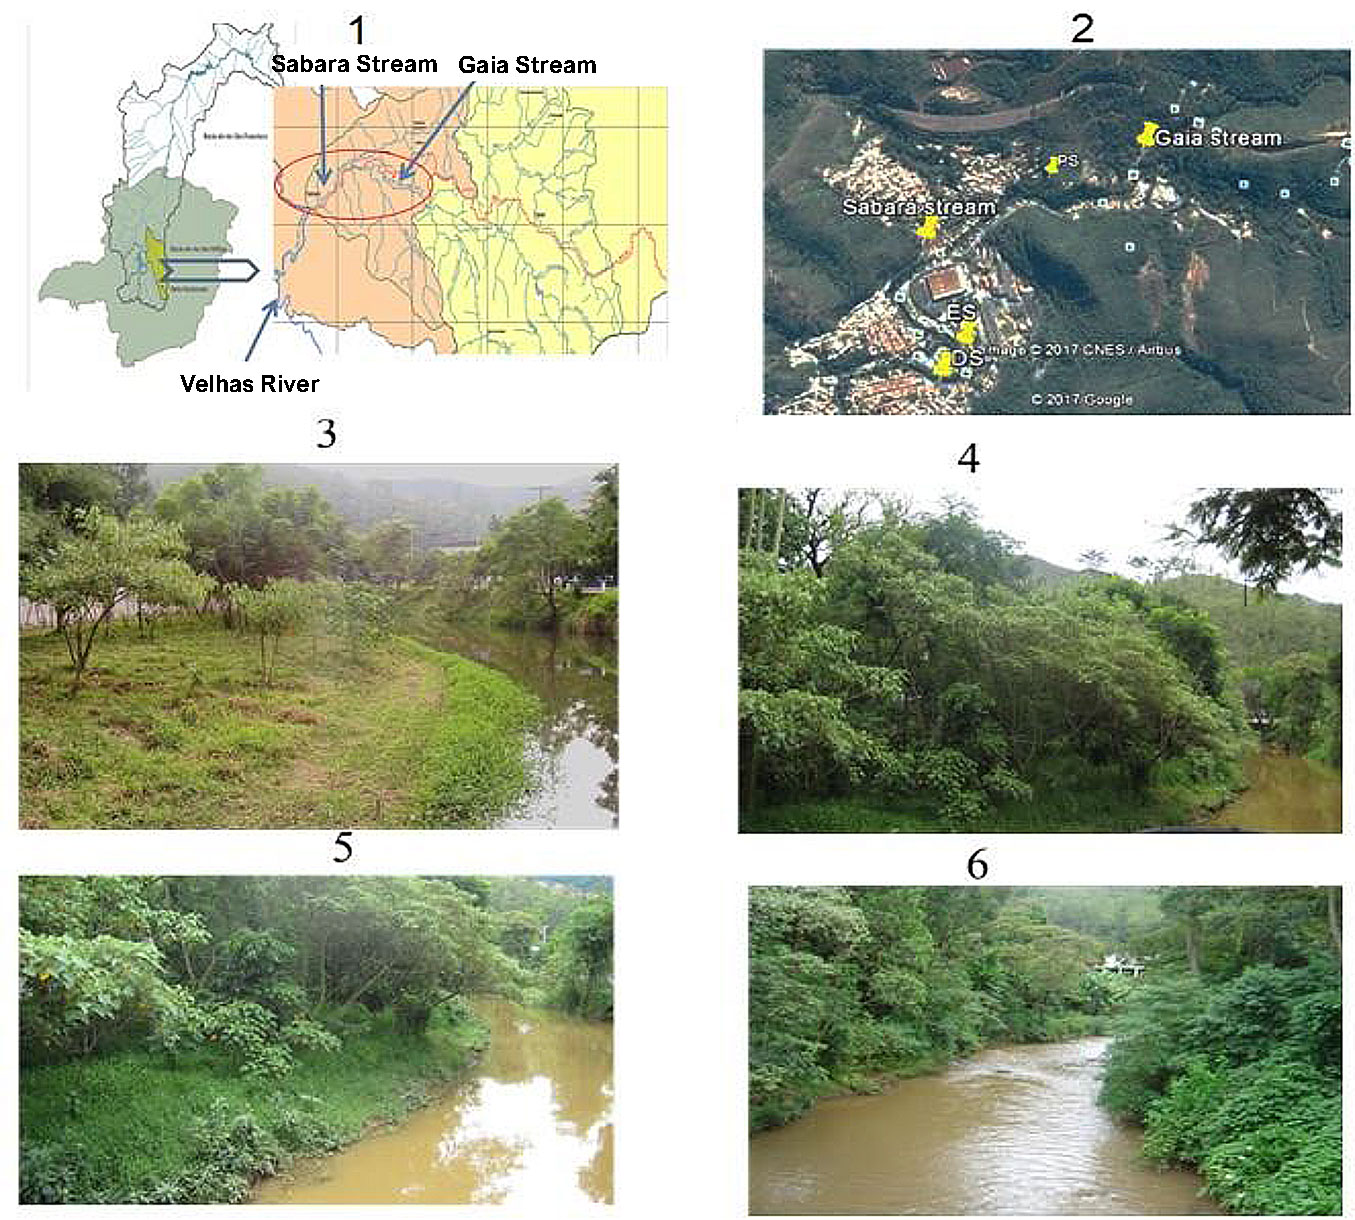
The studied sites were as follows: (i) experimental site (ES, 120 × 15 m), where the restoration procedures were adopted using native species (Fig. 1D, Fig. 1E) from the Cerrado biome; (ii) preserved site (PS), a fragment of a riparian forest (120 × 15 m) that was chosen as a positive reference for biological, physical and chemical integrity, located at a preserved park (19° 52′ 47″-19° 52′ 34″ S; 44° 07′ 44″-43° 47′ 30″ W - Fig. 1B), situated nearly 1000 m away from ES; (iii) disturbed site (DS, 120 m × 15 m), adjacent to ES with similar conditions to the ES prior to being converted to plantation (Fig. 1B), also formerly used for grazing. The dominant vegetation in DS (negative control) consisted of pioneer and invasive species (e.g., Brachiaria decumbens and Ricinus communis), with no woody vegetation.
Experimental design
The experimental site (120 × 15 m) was re-vegetated with species from the Brazilian Cerrado biome using the buffer zone system described by Kimura et al. ([23]) to restore the lost ecosystem functions of drainage, soil stability and soil fertility (Fig. 1D). In Zone I (5 m from the river), phreatophyte and flood-tolerant species (e.g., Morus nigra, Rapanea guianensis, Miconia sp., Eugenia uniflora, Psidium rufus, Inga edulis, Croton urucurana, Eritrina speciosa and Nectandra lanceolata [cf]) were planted. In Zone II (10 m from the margin), woody biomass-producing species (e.g., Croton floribundus, Anadenanthera peregrina, Centrolobium tomentosum, Machaerium villosum, Piptadenia gonoacantha, Luehea divaricate, and Samanea tubulosa) were planted to improve litter and organic matter formation. In Zone III (15 m from the margin), herbaceous, shrub, and woody species (e.g., Hymenea courbaril, Mimosa bimucronata, Tradescantia sp., and Piper umbellatum) were planted to ensure drainage and the control of surface and subsurface erosion (Fig. 1D).
Four-month-old seedlings grown under nursery conditions were planted in the field with a 3 × 3 m spacing. Fertilization was performed according to Somasegaran & Hoben ([43]).
Soil samples were collected at a depth of 0-20 cm along 3 transects (100 m each) crossing the area at 6 years after transplantation at each study site (ES, PS, and DS). A total of 27 mixed soil samples (3 soil samples/transect × 3 transects/site × 3 sites), which consisted of a composite sample formed by 5 subsamples collected within a 10-m radius (see Fig. S1 in Supplementary material), were used for all chemical and biological analyses. The study site (Fig. 1E) experienced annual floods over the six years following transplantation (Fig. 1F).
Soil chemical analysis
Soil samples were sieved with a 2-mm mesh and analyzed to determine their chemical properties ([10]). The experimental site was compared with the control sites for cation content, cation exchange capacity (CEC), base saturation, organic matter content, and soil pH, among other parameters. The soil samples were kept cool (4 °C) during sampling and transport and were maintained at 2 °C until processing. The total N level was determined in field samples using the Kjeldahl digestion technique, while ammonium and nitrate contents were determined using the steam distillation method ([4]), with 10 g of soil extracted with 2 mol L-1 KCl.
Fractionation of soil organic matter
The fractionation of sequestered C from SOM was performed as described by Dabin ([9]). Briefly, 15 g of sieved soil was processed to obtain different C fractions, representing humic and fulvic acids. This method is based on acid-base reactions that extract HSs, yielding an insoluble fraction (humic acid, HA) and a soluble fraction (fulvic acid, FA). The determination of organic C in the HA and FA fractions was performed as described by Dabin ([9]).
Microbial biomass and carbon determination (Cmic)
Soil samples were sieved through a 2-mm mesh screen and dried overnight at 105 °C to determine the moisture content. They were then used to evaluate the biomass (Cmic) following the fumigation method described by Vance et al. ([47]).
Phospholipid fatty acid (PLFA) profiles
PLFAs were extracted from lyophilized soil following the method described by Bligh & Dwyer ([2]). The total lipids were then fractionated into glyco-, neutral, and polar lipids, as outlined by Gehron & White ([14]). The fatty acid methyl esters were obtained from the elution of the phospholipid fraction using methanol, followed by mild alkaline methanolysis ([50]). The extracts were analyzed using gas chromatography with flame ionization detection (Hewlett-Packard model 5890 series 2 chromatograph). Fatty acid chemical structures were verified by chromatography/mass spectrometry (Hewlett-Packard model 5890 series 2 gas chromatograph and Hewlett-Packard model 5971 mass selective detector), and PLFAs were expressed as equivalent peak responses to the internal standard. Peak areas were converted to PLFA µg-1 dry soil (absolute abundance). Fatty acid nomenclature is in the form of A:B ωC, in which A indicates the total number of C atoms, B indicates the number of double bonds, and C indicates the position of the first double bond from the aliphatic (ω) end of the molecule. The suffixes “c” and “t” indicate cis and trans geometry. The prefixes “i”, “a” and “me” refer to iso, anteiso and mid-chain methyl branching, and “cy” refers to cyclopropyl rings ([11], [12]). Approximately 40 individual PLFAs were identified as the sum of signatures as described in Tab. S1 (Supplementary material).
Statistical analysis
The variables studied were compared among sites (PS, DS, and ES) using analysis of variance (ANOVA) for normally distributed variables and the Kruskal-Wallis test for non-normally distributed variables. Multiple comparisons of normal and non-normal variables were performed using Tukey and Nemenyi tests, respectively. Pearson correlations were computed for soil chemical and microbial data, and principal component analysis (PCA) was used to identify the most significant variables based on the variance explained. The analysis presented the variables in terms of the first two components, and the influence of each variable on the restoration process at each site was demonstrated using a scatter plot in MINITAB v. 1.5. The significance level was set at 5% (P ≤ 0.05) for all analyses.
Results and discussion
Soil carbon metabolism
The planting of native species in ES improved soil fertility after six years (Tab. 1). Soil fertility indicators, including cation exchange capacity (CEC) and sum of bases (SB), were comparable between ES and PS (Tab. 1). In contrast, soil pH and phosphorus (P) and potassium (K) concentrations were relatively higher in DS than in ES and PS. These differences may be attributed to the historical use of fertilization associated with grazing management. Additionally, flooding may have influenced soil pH and the availability of P and K, suggesting that the restored sites (ES and PS) exhibited greater resilience to these environmental conditions.
Tab. 1 - Soil chemical properties in different sites. Means followed by the same letter in a row are not significantly different after the Tukey test (p < 0.05). (SB): sum of bases; (CEC): cation exchange capacity; (BS): base saturation.
| Variables | Disturbed site (DS) |
Experimental site (ES) |
Preserved site (PS) |
|---|---|---|---|
| pH | 7.20 ± 0.06a | 7.33 ± 0.22a | 6.23 ± 0.15b |
| P (mg dm-3) | 51.33 ± 1.86a | 33.67 ± 2.03b | 44.67 ± 1.45a |
| K+ (mmolc dm-3) | 3.77 ± 0.09a | 2.20 ± 0.23b | 2.52 ± 0.06b |
| Ca2+ (mmolc dm-3) | 56.67 ± 0.33c | 154.67 ± 0.88a | 146.67 ± 1.2b |
| Mg2+ (mmolc dm-3) | 5.33 ± 0.33a | 8.33 ± 1.45a | 7.67 ± 0.67a |
| SB (mmolc dm-3) | 66.00 ± 0.00c | 165.33 ± 0.33a | 157.00 ± 1.0b |
| CEC (mmolc dm-3) | 75.67 ± 0.33c | 173.67 ± 0.88a | 166.00 ± 0.58b |
| BS (%) | 87.67 ± 0.33b | 95.33 ± 0.88a | 94.67 ± 0.33a |
The contribution of woody species to soil fertility can be estimated by the improvement in SOM and SOC (Tab. 2). The soil C metabolism variables, as expressed by SOC, humic acid, and fulvic acid, showed the following trend: PS > ES > DS (Tab. 2). ES showed an increase in soil C and HSs (Tab. 2) at 6 years after planting, as also observed by Podwika et al. ([32]) following afforestation. Given that SOM and HS are widely considered indicators of soil health and fertility ([29]), the quantitative increase in these parameters in ES at 6 years after planting highlights improved soil quality at this site. Although there was a significant increase in both humic and fulvic acids, fulvic acid levels were higher than those of humic acid (Tab. 2). HSs are the final product of the decomposition process of plant residues rich in lignin ([41]). Humic acids and humin have higher molecular weights and constitute a more condensed fraction of HSs, whereas fulvic acids have more oxidized substances of lower molecular weights ([19]). Therefore, the planting of native woody species in ES contributed to litter inputs, resulting in high-quality SOM in this still young, 6-year-old forest ([7]).
Tab. 2 - Comparison among the three sites (PS: Preserved site; ES: Experimental site; DS: Disturbed site) for nitrogen and carbon parameters. Pairwise comparisons between sites were based on one-way ANOVA (a) or Kruskal-Wallis (b) tests, followed by Tukey or Nemenyi post hoc adjustments, respectively (significance at p ≤ 0.05).
| Parameters | DS (mean ± SD) |
ES (mean ± SD) |
PS (mean ± SD) |
DS × PS (p-value) |
DS × ES (p-value) |
PS x ES (p-value) |
|---|---|---|---|---|---|---|
| C - Organic (g kg-1)(a) | 13.70 ± 0.9 | 18.92 ± 1.07 | 23.47 ± 2.1 | <0.0001 | <0.0001 | 0.0002 |
| C - Humic acid (g/kg-1)(a) | 0.98 ± 0.2 | 1.70 ± 0.2 | 2.37 ± 0.18 | <0.0001 | 0.0002 | 0.0003 |
| C - Fulvic acid (g/kg-1)(a) | 2.21 ± 0.3 | 3.22 ± 0.3 | 4.08 ± 0.23 | <0.0001 | <0.0001 | 0.0006 |
| C Mic. biomass (mg kg-1)(a) | 264.83 ± 17.0 | 544.67 ± 43.9 | 870.98 ± 37.3 | <0.0001 | <0.0001 | <0.0001 |
| Total N (g kg-1)(b) | 0.98 ± 0.07 | 1.23 ± 0.09 | 2.03 ± 0.1 | <0.0001 | 0.0003 | <0.0001 |
| N-NH4+ (g kg-1)(a) | 54.85 ± 2.0 | 55.55 ± 21.8 | 33.60 ± 7.5 | 0.0069 | 0.99 | 0.0053 |
| N-NO3- (g kg-1)(b) | 96.09 ± 6.2 | 129.89 ± 38.4 | 209.58 ± 32.9 | <0.0001 | 0.057 | <0.0001 |
One of the primary ecosystem services provided by HSs is their promotion of soil aggregation, consequently affecting soil stabilization and permeability ([5], [29]), particularly in riparian sites ([23], [40], [16], [1]). Thus, the increase in soil HSs in restored sites enhances the recovery of flood-regulating ecosystem services, such as soil stabilization and permeability ([23], [40], [1]), contributing to the soil’s physical structure ([29]) and a higher tolerance to the flooding impact.
Soil nitrogen metabolism
Flooding cycles typically affect N metabolism in the soil, causing accumulation of soil NH4+, stimulating NH3 volatilization, and increasing denitrification ([49]). The distribution of total soil N at the study sites followed the same pattern as SOC (PS > ES > DS - Tab. 2), as confirmed by Podwika et al. ([32]) following afforestation. However, the N ammonium content was higher at DS and ES compared to PS (PS < DS = ES - Tab. 2), and the nitrate content was higher at PS than at the other sites (PS > ES = DS).
Ammonium availability in the soil is favored in acidic soils and under anaerobic or low-redox conditions ([21]). Thus, due to the elevated redox potential found under aerobiosis, NH4+-N is oxidized to NO3-N. Flooding commonly induces a rapid decline in redox potential and subsequent accumulation of NH4+, impairing nitrification ([30]). Such a phenomenon appears to occur at ES and DS but not PS, suggesting better resilience in the latter ([28]). In addition, ammonium accumulation at DS and ES, located downstream of a pollution point source (Fig. 2A), may also be attributed to water pollution in the Sabará stream ([22]), suggesting land degradation.
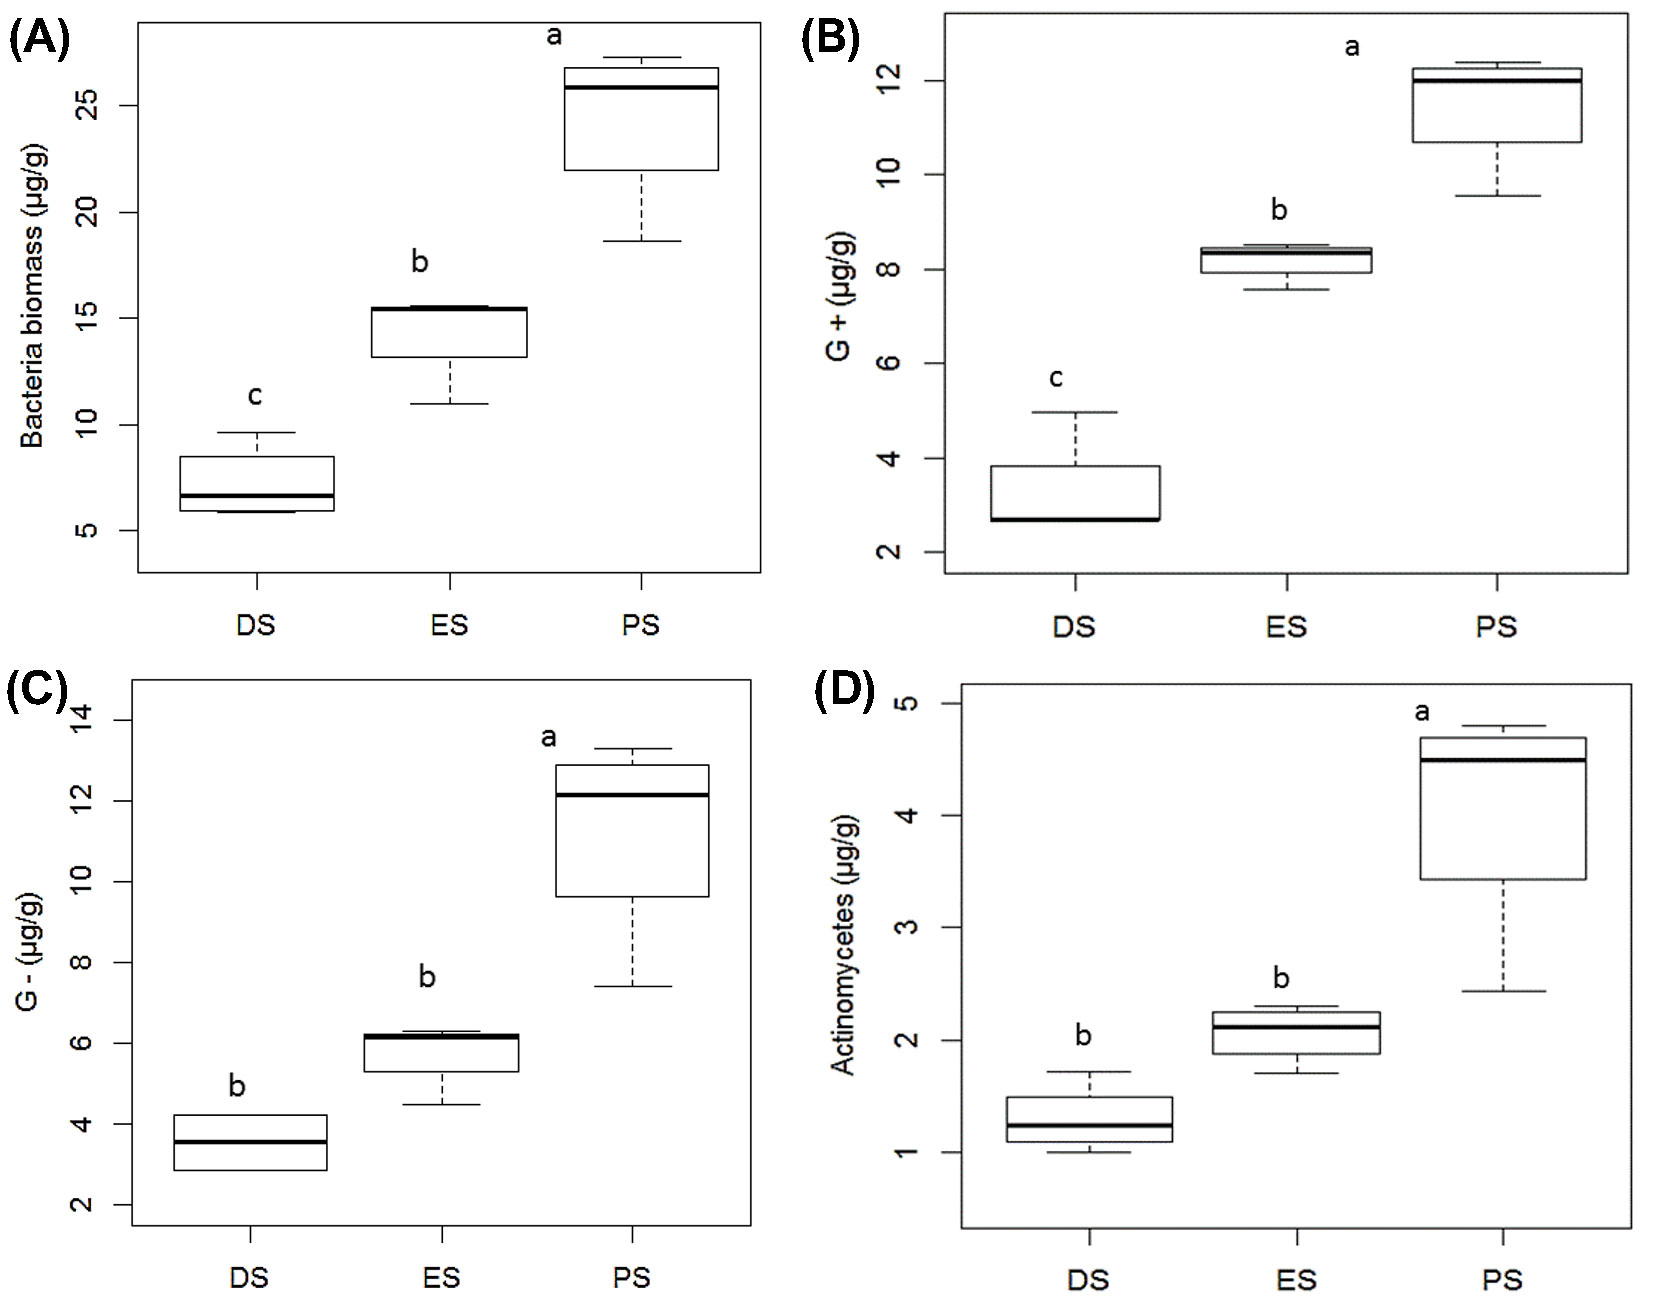
Fig. 2 - Comparisons of soil phospholipid fatty acid (PLFA) bacterial biomarkers (PLFA Bacteria biomass1, PLFA G+1, PLFA G-2, PLFA Actynomycetes2) among sites. Analysis of variance (ANOVA1 or Kruskal-Wallis2) was applied to compare mean differences among sites (significance at p ≤ 5%). (1) Tukey test; (2) Nemenyi test.
Soil microbial communities
Periodic flooding may also change aerobic-anaerobic conditions, thereby altering biochemical reactions ([46], [38], [28]). Such fluctuations in the water table in riparian zones, which drive cycles of anaerobic and aerobic conditions, exert selective pressure on soil microbial communities ([7]), thereby altering C availability ([35], [28]). The total soil microbial biomass followed the same pattern as SOC (PS > ES > DS - Tab. 2). Such an increase in total microbial biomass at the site under restoration may be attributed to the increase in SOM and SOC, which are known as reliable soil quality indicators at restored sites ([8], [25]), particularly in riparian zones ([7], [23], [40], [16]). However, the differences in total microbial biomass between ES and PS can be attributed to the early stage of the forest restoration process ([7]) and the effects of periodic flooding ([46], [34]).
Changes in soil microbial communities have been assessed by analyzing the ester-linked PLFA composition, which enables the detection of shifts in specific microbial communities under environmental stress ([11], [12]). The analysis of the PLFA profile of total bacterial biomass showed a pattern similar to that of total microbial biomass and total C, with PS > ES > DS (Fig. 2A), as predicted by Frostegard & Baath ([12]). Within the bacterial population, the Gram-positive bacteria (Fig. 2B) showed the same distribution pattern (PS > ES > DS), but for the Gram-negative bacteria (Fig. 2C), a larger population was observed at PS than at ES and DS (PS > ES = DS). The greater abundance of Gram-negative bacteria in PS was associated with soil C accumulation at older sites ([7]). The inhibition of this bacterial category in ES and DS may suggest selective pressure caused by flooding in this group, which is known to be more associated with aeration ([33]). However, Gram-positive bacteria can be favored under anaerobic conditions, as putative indicators of the impact of flooding ([3]), and the balanced Gram-negative and Gram-positive populations at PS may suggest better resilience of this site to flooding.
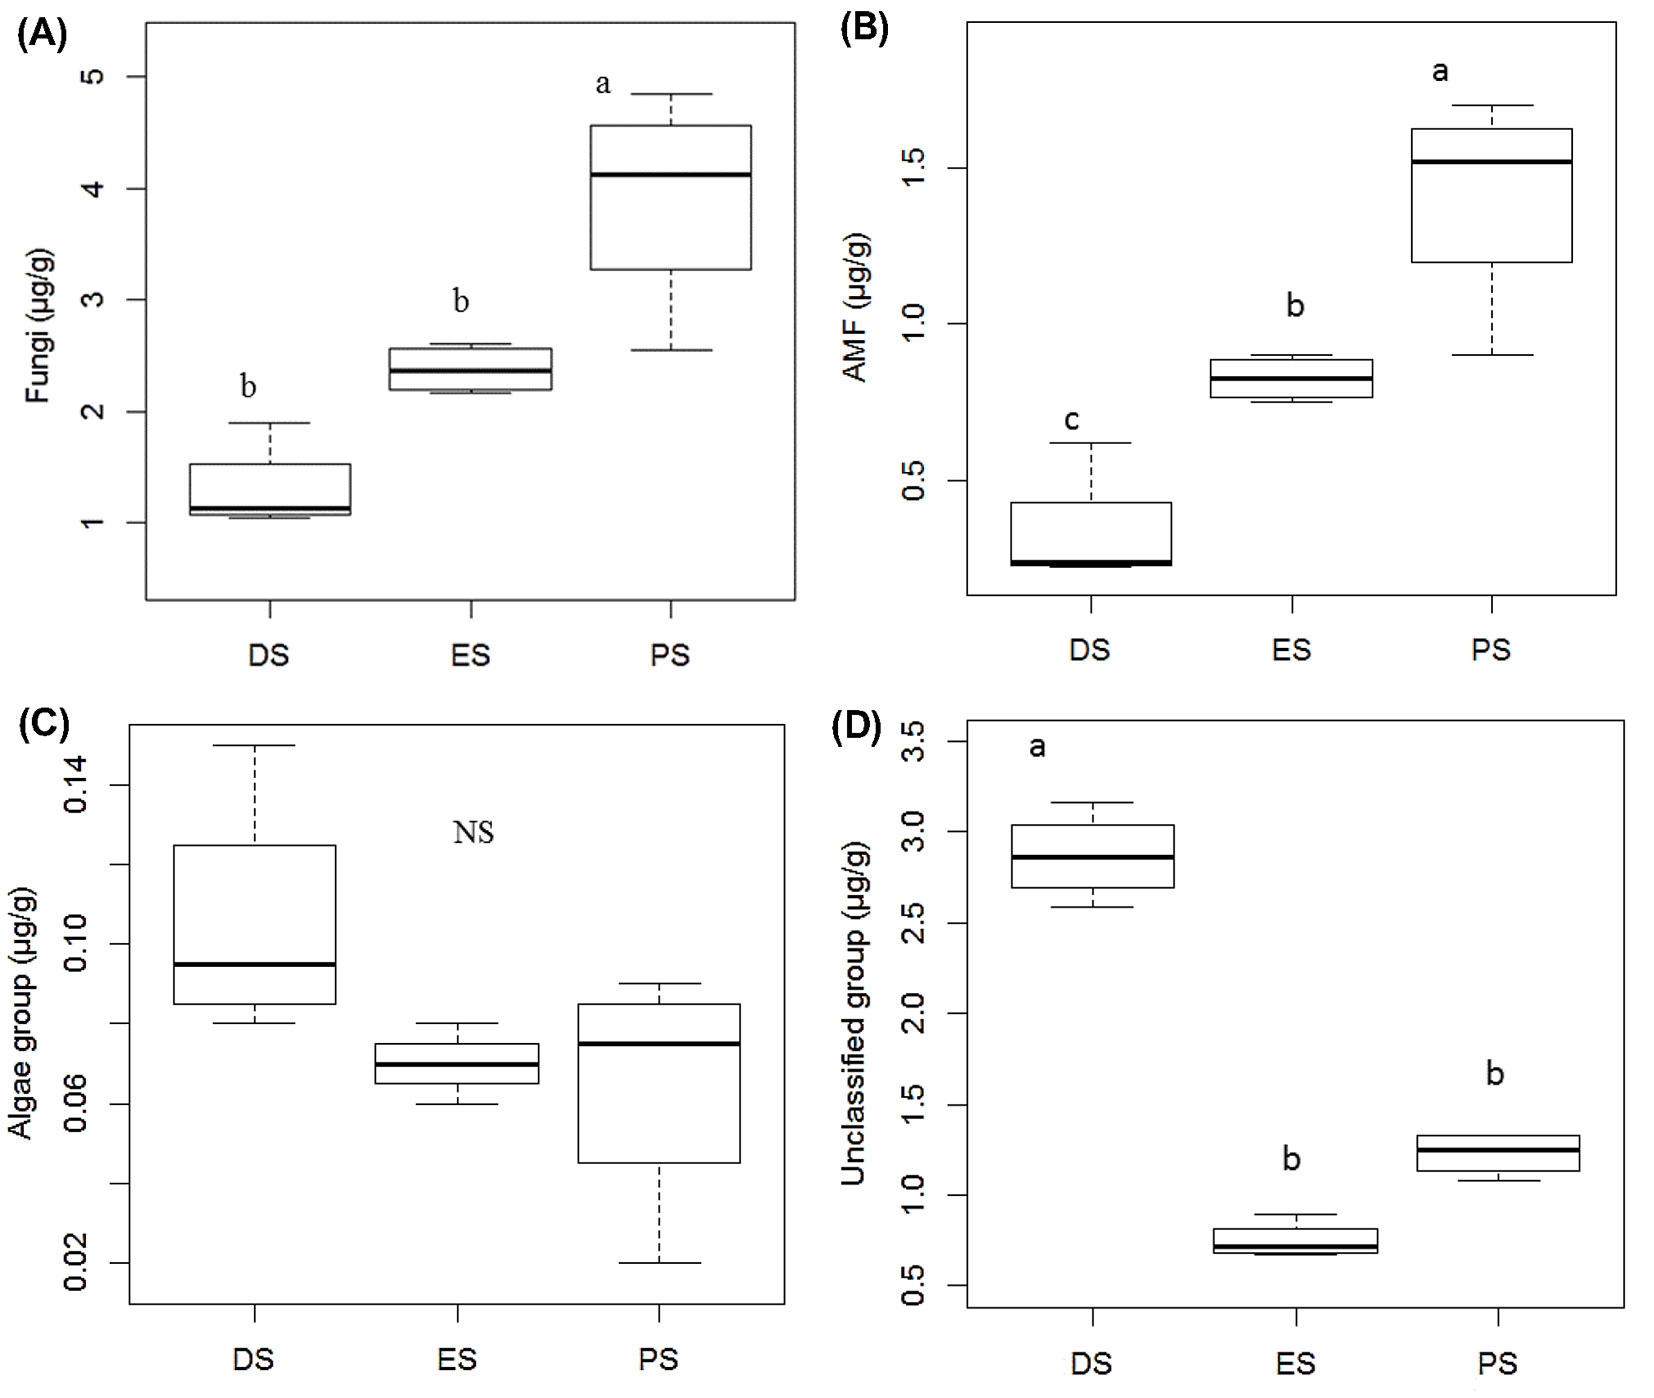
Actinomycetes (Fig. 2D) and the total fungi (Fig. 3A) followed the same pattern as Gram-negative bacteria (PS > ES = DS), which may reflect the greater sensitivity of these microbial communities to anaerobic flooding conditions ([3], [46]). Therefore, PLFAs of actinomycetal and fungal origins may be considered indicators of drier sites ([7]). However, the arbuscular mycorrhizal fungi (AMF - Fig. 3B) showed a pattern similar to that of the soil C profile (PS > ES > DS), likely because AMF play a functional role in soil aggregation and stabilization at restored riparian sites ([36], [24], [16]). In contrast to the PLFA algal group, which did not differ among sites (Fig. 3C), a large population of unclassified microbial community (Fig. 3D) was observed at DS compared with PS and ES (DS > PS > ES), possibly serving as a potential microbial indicator of land degradation in riparian areas.
Fig. 3 - Comparisons of soil phospholipid fatty acid (PLFA) microbial biomarkers (PLFA Fungi1, PLFA AMF1, PLFA Algae1, PLFA unclassified2) among sites. Analysis of variance (ANOVA1 or Kruskal-Wallis2) applied to compare mean differences among sites (significance at p ≤ 5%). (1) Tukey test; (2) Nemenyi test.
Functional microbial groups
The abundance of the aerobic PLFA functional group (Fig. 4A) followed the pattern observed for SOM (PS > ES > DS), and the anaerobic microbial population (Fig. 4B) was larger at PS than at ES and DS (PS > ES = DS). This suggests that the anaerobic group was not fully recovered in ES. The dominant anaerobic PLFA signature across all study sites was C16:0, which is characteristic of anaerobic bacteria ([48]). Fu et al. ([13]) considered PLFA C16:0 and C:150i signatures as biomarkers of anaerobic denitrifying microbial populations. Similarly, Hoefman et al. ([20]) found an abundant composition of both biomarkers in Methylomonas lenta isolated from a denitrification tank. Our results (Fig. 4C) showed that these microbial PLFA biomarkers (C:150i and C16:0) increased at PS and ES, but not at DS (PS > ES > DS). Although the entire anaerobic group had not recovered at ES compared to DS, the specific anaerobic denitrifying populations were enhanced in ES, suggesting that this physiological activity might be improved at the site under restoration, as a putative indicator of flooding.
Fig. 4 - Comparisons of soil phospholipid fatty acid (PLFA) microbial functional groups (PLFA aerobic1, PLFA anaerobic1, PLFA denitrifying1, PLFA stress ratio2) among sites. Analysis of variance (ANOVA1 or Kruskal-Wallis2) was applied to compare mean differences among sites (significance at p ≤ 5%). (1) Tukey test; (2) Nemenyi test.
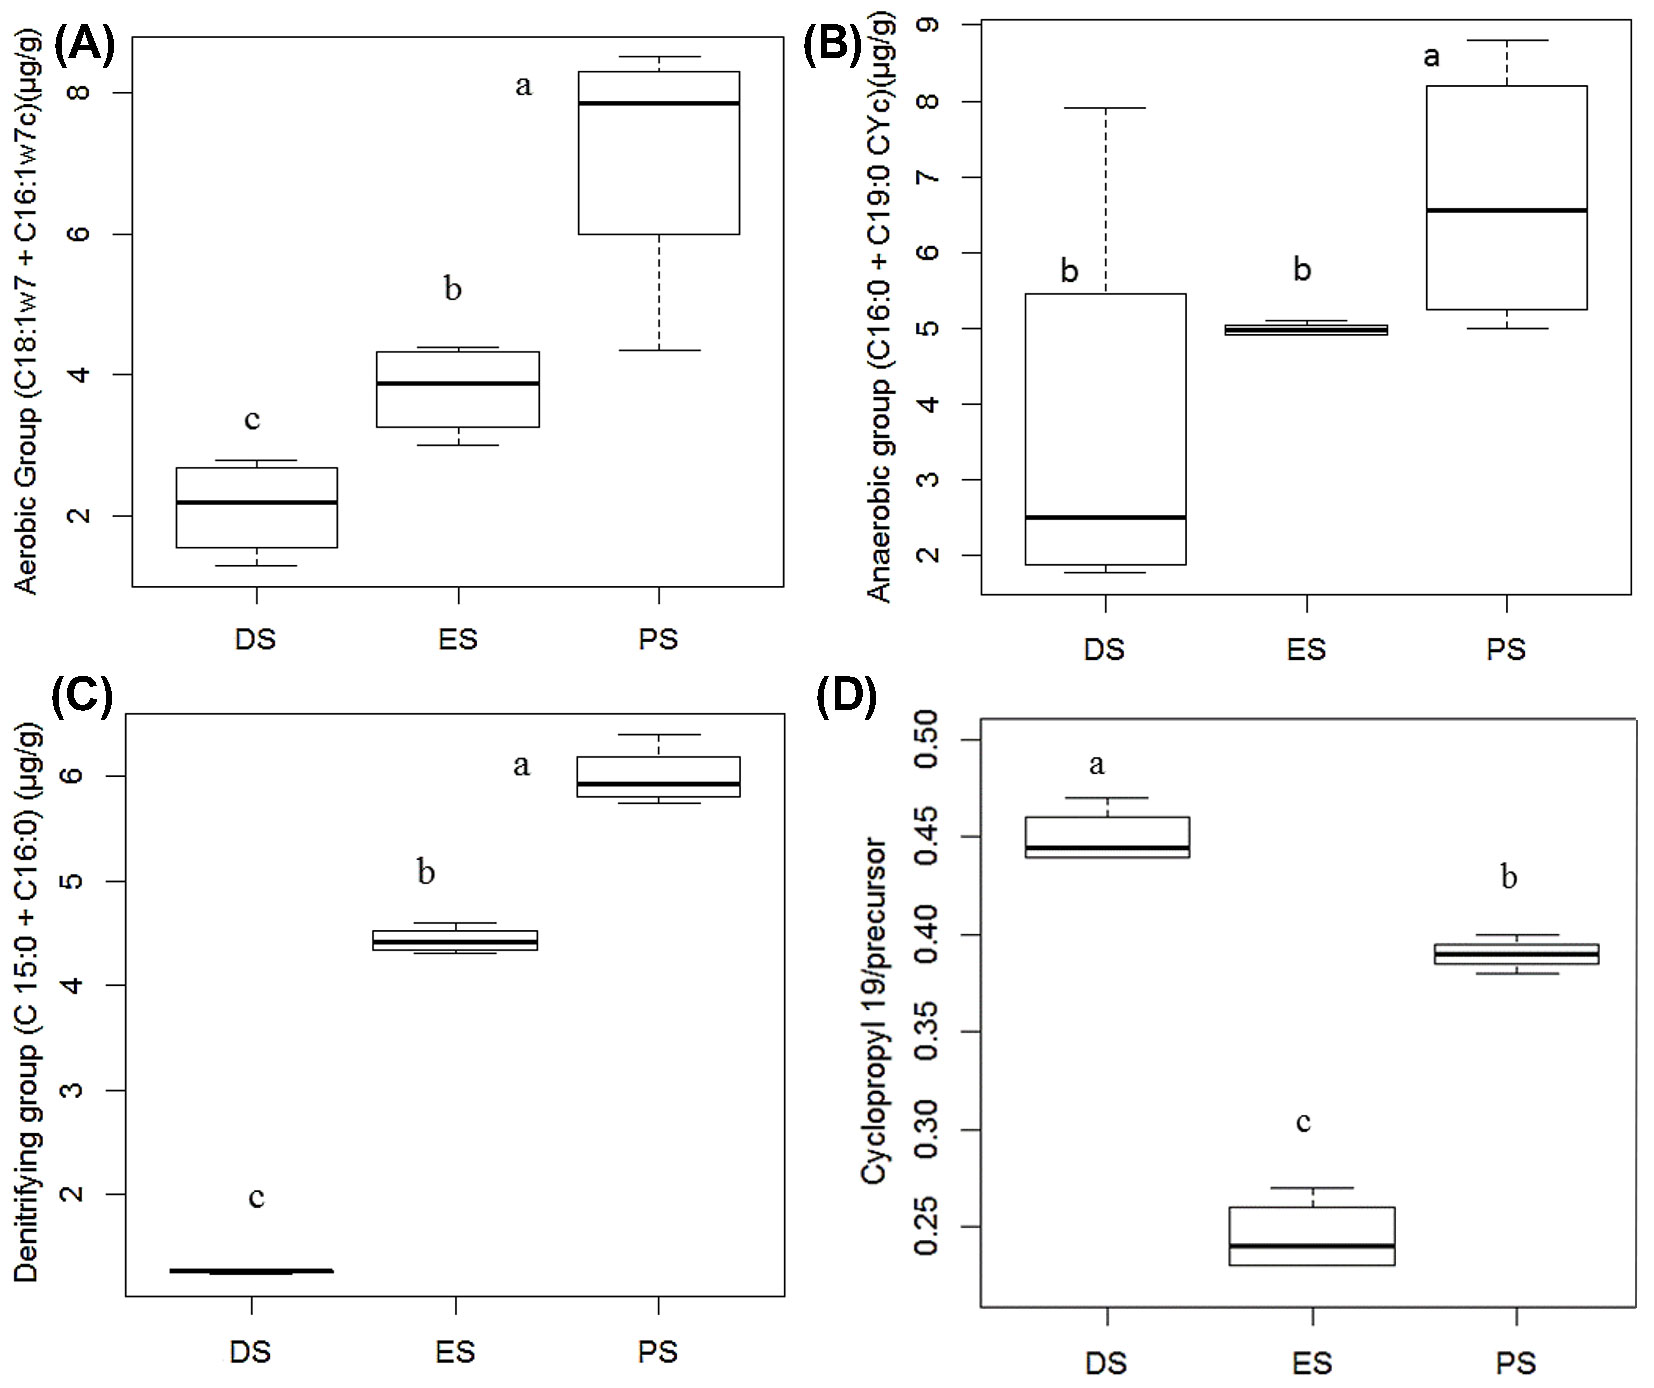
In addition, the Cyclopropyl 19/precursor stress ratio (Fig. 4D), as expressed by the PLFA cy19:00/ C18:1w7c signatures ([3]), differed among sites. The former PLFA marker corresponds to the anaerobic microbial population and the latter to the aerobic population ([45]). We observed the following pattern for this stress ratio (Cyclopropyl 19/precursor): DS > PS > ES. This may indicate strong anaerobic stress at DS (Fig. 4D). In addition, the abundance of cyclopropyl fatty acids has been associated with anaerobic stress ([3]) and with different environmental stressors, such as soil pH ([26]). The reason for such low specificity is that cyclopropyl fatty acids (cy17:0 and cy19:0) are produced by the trans-methylation of cis-monounsaturated fatty acids when cells enter a stationary phase, thereby altering cell membrane lipid composition ([26]). Similarly, Bossio & Scow ([3]) observed an increase in this ratio under flooding. Therefore, the increase of this bacterial stress index at DS may result from several simultaneous disturbances, such as anaerobiosis, high pH promoted by the flooding waters, and low soil fertility. In contrast, the lowest ratios at PS and ES suggest greater resilience of these sites to environmental impacts.
Correlation analysis
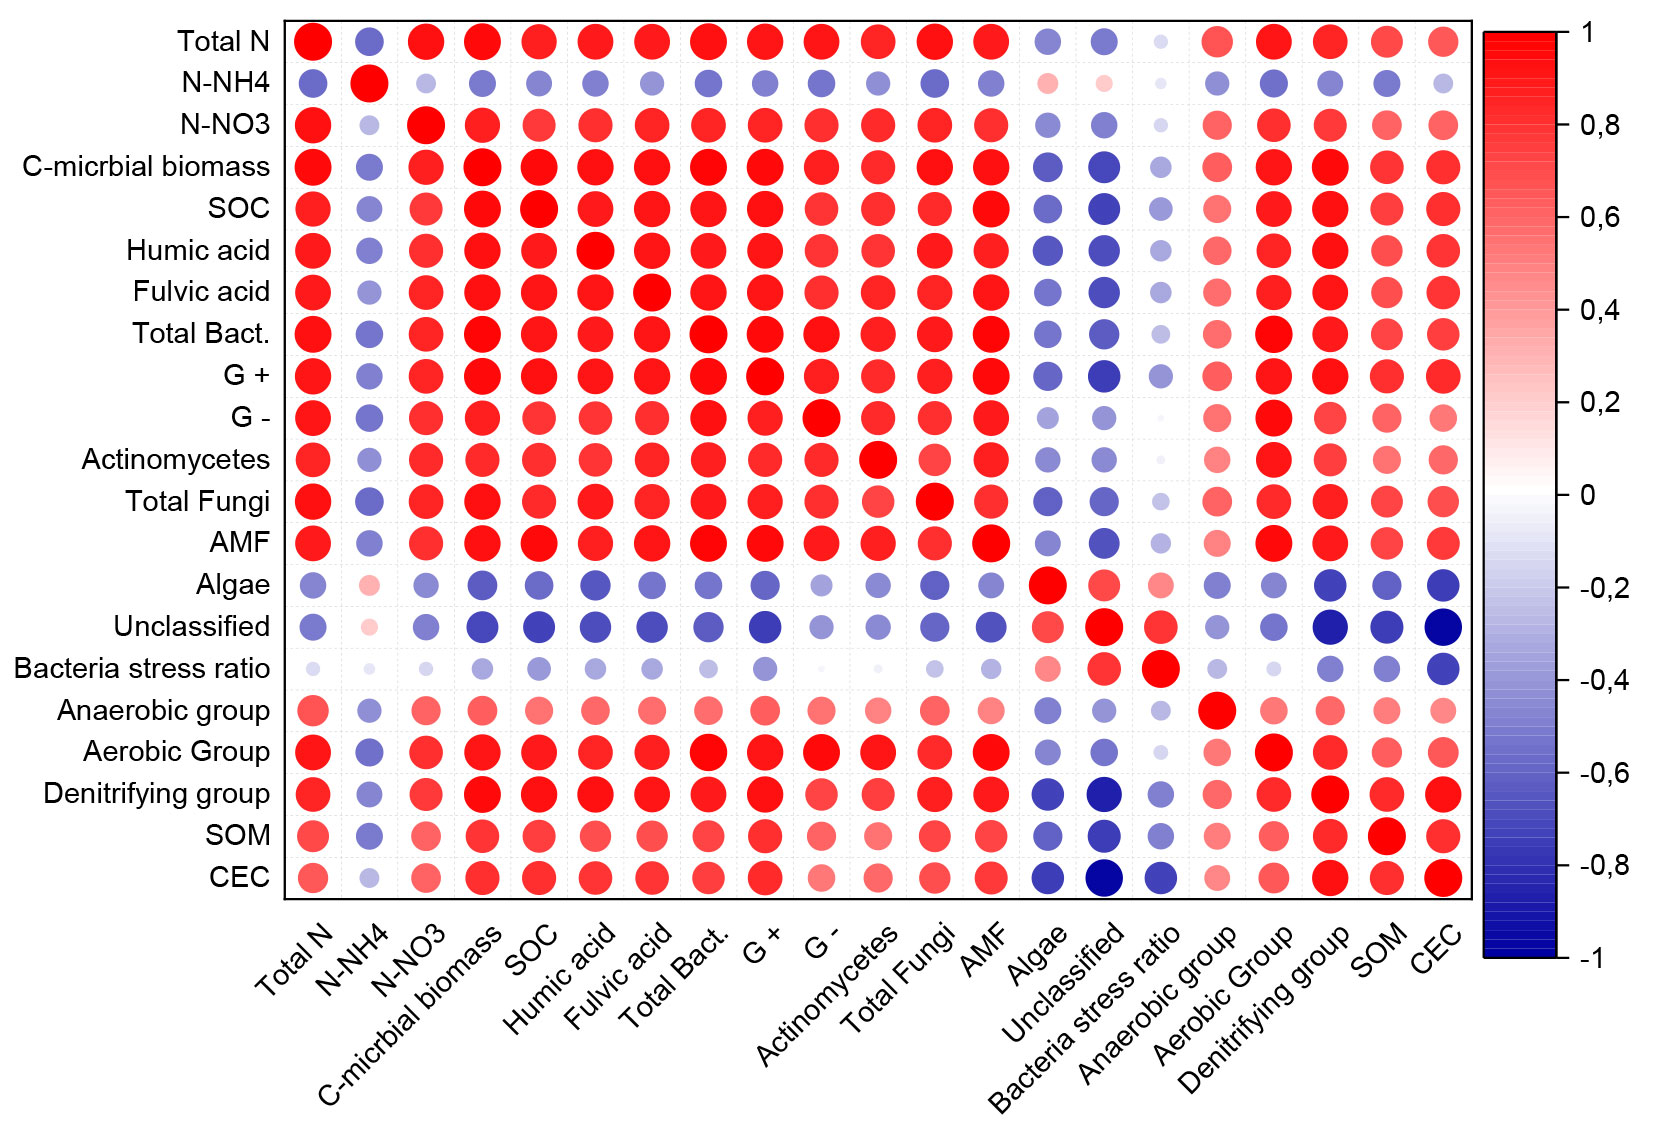
Pearson correlation analysis (Fig. 5) showed that all soil chemical parameters were correlated with the bacterial and fungal communities. However, the soil NH4+ content was not correlated with any soil parameter. Similarly, the algal and unclassified microbial groups were not correlated with the measured variables. These results support the conclusion that soil NH4+, algae, and the unclassified groups likely originated exogenously from polluted water.
Fig. 5 - Pearson’s correlation analysis of soil chemical and microbial parameters from the studied sites. (G+): Gram-positive bacteria; (G-): Gram-negative bacteria.
Principal component analysis (PCA)
PCA (Fig. 6) showed that the most significant variables explained 79.52% of the total variance, with principal component (PC) 1 accounting for 62.8% and PC2 for 16.72%. In PC1, the variables most contributing were N-NO3-, Gram-negative bacteria, aerobic, anaerobic, actinomycetes, and denitrifying groups, CEC, and SOM. In contrast, the PLFA unclassified group, the bacterial stress ratio, N-NH4+, and the algae group were more strongly associated with PC2.
Fig. 6 - Clustering of the studied sites (PS: preserved site: ES: experimental site; DS: disturbed site) by principal component analysis (PCA) based on the most significant variables: N-NH4+, N-NO3-, cation exchange capacity (CEC), soil organic matter (SOM), Gram-negative bacteria (G-), actinomycetes, algae, unclassified PLFA group, aerobic group, anaerobic group, denitrifying group, cyclopropyl/precursor (stress ratio).
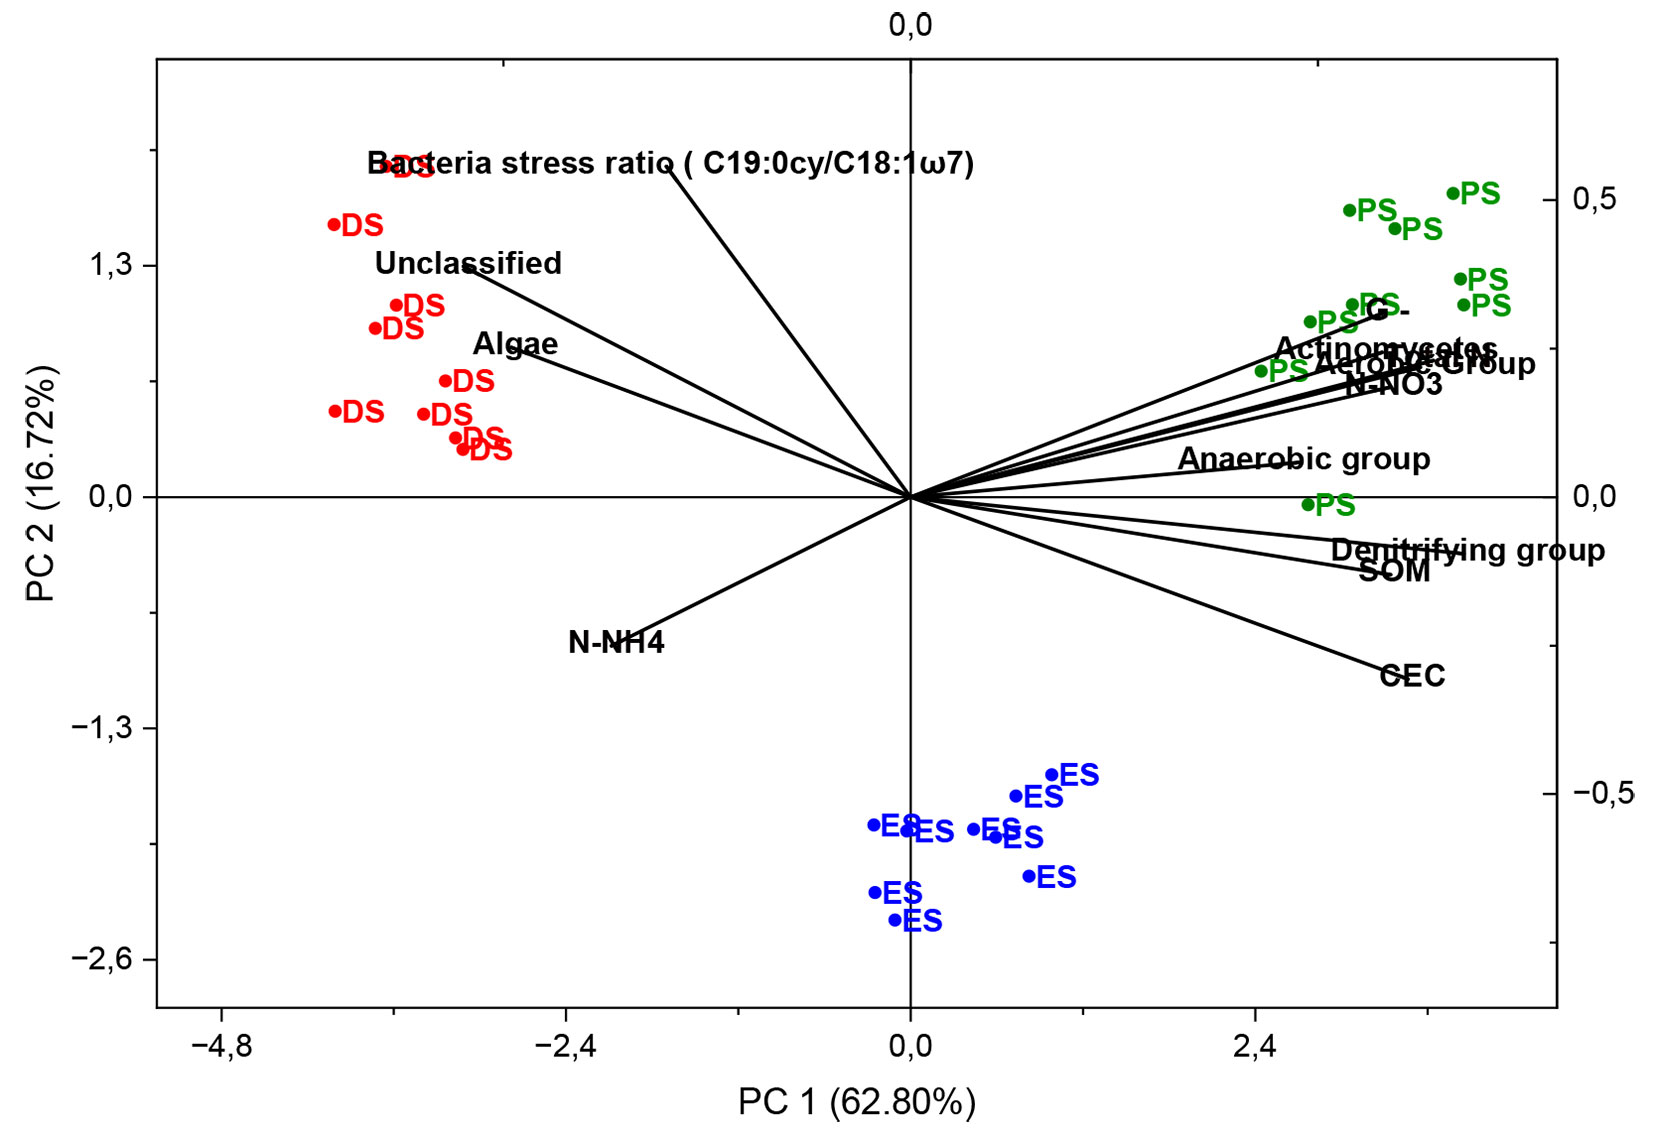
Site distribution in the PCA biplot (Fig. 6) showed that samples from DS (red) were separated by the PLFA unclassified group and the cyclopropyl 19/precursor ratio, highlighting the effects of anaerobic flooding at this site. PS (green) and ES (blue) were separated from DS along PC2 axis, primarily driven by N-NH4+. Conversely, ES (blue) and PS (green) samples were separated along PC1 axis. These results indicate that N-NH4+ accumulation at ES and DS is the primary environmental factor hindering soil recovery at ES.
Conclusion
Based on soil C and N cycling indicators and soil microbial communities, the 6-year-old forest planted with native species progressed toward the soil conditions of a preserved riparian site. The restoration procedure improved soil fertility, particularly with respect to SOM, SOC, CEC, humic and fulvic acids, and bacterial and fungal populations. Although SOM, CEC, NO3-, and certain functional microbial populations, such as denitrifying, anaerobic/aerobic, actinomycetes, and Gram-negative groups, were suitable indicators of riparian site restoration, soil NH4+ accumulation was the primary environmental indicator hindering riparian forest recovery. Overall, our study provides suitable indicators for assessing riparian forest restoration under flooding in tropical environments.
Acknowledgements
This work was supported by the Brazilian Ministry of Environment. The authors are grateful to CAPES and CNPq for scholarships and to Arcelor-Mittal (Belgo Company) and the Natural History Museum and Botanical Garden of the Federal University of Minas Gerais, Brazil, for logistical support.
References
Gscholar
Gscholar
Gscholar
Gscholar
CrossRef | Gscholar
Gscholar
CrossRef | Gscholar
Gscholar
Gscholar
Gscholar
Gscholar
Gscholar

Authors’ Info
Authors’ Affiliation
Maria Rita Scotti 0000-0002-8142-4627
Department of Botany, Institute of Biological Science, Federal University of Minas Gerais - UFMG (Brazil)
Corresponding author
Paper Info
Citation
Santos HV, Scotti MR (2026). Assessing the restoration of a seasonally flooded riparian forest through soil carbon and nitrogen cycling indicators and soil microbial communities. iForest 19: 254-260. - doi: 10.3832/ifor4861-018
Academic Editor
Rafael Da Silveira Bueno
Paper history
Received: Mar 29, 2025
Accepted: Dec 14, 2025
First online: Jul 21, 2026
Publication Date: Aug 31, 2026
Publication Time: 7.30 months
Copyright Information
© SISEF - The Italian Society of Silviculture and Forest Ecology 2026
Open Access
This article is distributed under the terms of the Creative Commons Attribution-Non Commercial 4.0 International (https://creativecommons.org/licenses/by-nc/4.0/), which permits unrestricted use, distribution, and reproduction in any medium, provided you give appropriate credit to the original author(s) and the source, provide a link to the Creative Commons license, and indicate if changes were made.

Web Metrics
Breakdown by View Type
Article Usage
Total Article Views: 1690
(from publication date up to now)
Breakdown by View Type
HTML Page Views: 519
Abstract Page Views: 600
PDF Downloads: 492
Citation/Reference Downloads: 0
XML Downloads: 79
Web Metrics
Days since publication: 96
Overall contacts: 1690
Avg. contacts per week: 123.23
Article Citations
Article citations are based on data periodically collected from the Clarivate Web of Science web site
(last update: Jul 2026)
(No citations were found up to date. Please come back later)
Publication Metrics
by Dimensions ©
Articles citing this article
List of the papers citing this article based on CrossRef Cited-by.
Related Contents
iForest Similar Articles
Research Articles
Impact of deforestation on the soil physical and chemical attributes, and humic fraction of organic matter in dry environments in Brazil
vol. 15, pp. 465-475 (online: 18 November 2022)
Research Articles
Seasonal dynamics of soil respiration and nitrification in three subtropical plantations in southern China
vol. 9, pp. 813-821 (online: 29 May 2016)
Research Articles
The effect of clear-cut age on soil organic carbon and nitrogen indices in Scots pine (Pinus sylvestris L.) stands
vol. 18, pp. 146-153 (online: 09 June 2025)
Research Articles
Effects of arbuscular mycorrhizal fungi on microbial activity and nutrient release are sensitive to acid deposition during litter decomposition in a subtropical Cinnamomum camphora forest
vol. 16, pp. 314-324 (online: 13 November 2023)
Research Articles
Soil stoichiometry modulates effects of shrub encroachment on soil carbon concentration and stock in a subalpine grassland
vol. 13, pp. 65-72 (online: 07 February 2020)
Research Articles
Estimating changes in soil organic carbon storage due to land use changes using a modified calculation method
vol. 8, pp. 45-52 (online: 17 June 2014)
Research Articles
Potential relationships of selected abiotic variables, chemical elements and stand characteristics with soil organic carbon in spruce and beech stands
vol. 14, pp. 320-328 (online: 09 July 2021)
Review Papers
Soil fungal communities across land use types
vol. 13, pp. 548-558 (online: 23 November 2020)
Research Articles
Dynamics of soil organic carbon (SOC) content in stands of Norway spruce (Picea abies) in central Europe
vol. 11, pp. 734-742 (online: 06 November 2018)
Research Articles
Fine root morphological traits and production in coniferous- and deciduous-tree forests with drained and naturally wet nutrient-rich organic soils in hemiboreal Latvia
vol. 16, pp. 165-173 (online: 08 June 2023)
iForest Database Search
Search By Author
Search By Keyword
Google Scholar Search
Citing Articles
Search By Author
Search By Keywords
PubMed Search
Search By Author
Search By Keyword