Potential relationships of selected abiotic variables, chemical elements and stand characteristics with soil organic carbon in spruce and beech stands
iForest - Biogeosciences and Forestry, Volume 14, Issue 4, Pages 320-328 (2021)
doi: https://doi.org/10.3832/ifor3654-014
Published: Jul 09, 2021 - Copyright © 2021 SISEF
Research Articles
Abstract
Increasing attention is given to carbon sequestration in forest soil with regard to climate change and the mitigation of its impacts; therefore, it is very important to know which parameters and variables could influence carbon sequestration and throw light on their relationships. The aim of this study is to assess the role of abiotic variables, chemical elements and stand parameters in soil carbon sequestration, and clarify which of these could affect soil organic carbon (SOC) content in the surface mineral horizon in Norway spruce and European beech stands in Czech Republic. We analyzed 81 monitoring plots within pure and mixed stands of spruce and beech with different degrees of forest naturalness. In each monitoring plot, SOC content, chemical elements (content of bound forms of oxides: tFe, tAl, tCa, tMg, tK, tMn, tP, tN) and related variables (BS, pH, C/N) were measured. The effect of these variables, including abiotic variables (elevation, temperature, precipitation, duration of growing season and soil group) on SOC content was tested, and differences between represented stands (natural vs. unnatural, pure vs. mixed, spruce vs. beech) were analyzed. The results showed that elevation has a positive relationship to SOC content. Of the studied chemical elements and related variables, only tN content was significantly related to SOC content. A positive relationship was also demonstrated between forest naturalness and SOC content. The highest SOC and tN contents were observed in pure natural Norway spruce stands, which likely play a very important role in SOC sequestration. In the context of the current issue of unnatural Norway spruce stands in the Czech Republic, a higher SOC content was found in mixed natural European beech stands than in either pure or mixed unnatural Norway spruce stands. Therefore, replacing the unnatural Norway spruce stands in the study area with mixed natural European beech stands could represent a viable alternative to current forest management in terms of soil carbon sequestration, especially in the context of global climate change and spruce dieback.
Keywords
Soil Organic Carbon (SOC), Carbon Sequestration, Forest Soil, Norway Spruce, European Beech, Chemical Elements
Introduction
The role of forest ecosystems in the global carbon cycle, and subsequently in carbon sequestration, is clear and fairly well documented ([24], [16], [30]). The attention of most authors focuses on the potential for carbon sequestration in soils beneath various tree species ([46]). Coniferous and deciduous forest stands (mainly spruce and beech) are usually compared. Many studies reported that conifers in general, and especially Norway spruce, contain higher SOC stock in the mineral horizon than other tree species ([46], [2], [27], [26]).
Norway spruce (Picea abies [L.] H. Karst.) and European beech (Fagus sylvatica L.) are the most common tree species in the Czech Republic. Norway spruce is the dominant tree species with a share of 50%, but in natural tree species composition its share should not exceed 11% ([13], [17]). European beech is the dominant broadleaf tree species; its current share is around 8%, but historically it was about 40% and that should also be its natural share in forests ([17], [42]).
The present proportion of Norway spruce is significantly higher than its original natural range, not only in the Czech Republic but throughout Central Europe. Klimo et al. ([28]) stated that its present distribution originates from the reforestation of extensive clear-cut areas carried out in the late 18th and early 19th centuries in the zone of fir/beech and beech plant communities as well as in the oak/beech and oak zones. The spruce monoculture distribution is also similar in other Central European countries. In connection with silviculture of economically advantageous tree species, it became common for Norway spruce stands (the so-called secondary spruce forests) to be grown intensively (cultivated) also on unsuitable and primarily unnatural sites ([1], [31]). Growing spruce forests on unnatural sites meant forcing out and removing the site-natural tree species, often the beech, but also other tree species.
Currently, forest managers in the Czech Republic are struggling with the problem of spruce monocultures grown on unnatural habitats in the context of global climate change and the associated dieback of spruce. According to regional scenarios for the predicted impact of climate change for the Czech Republic in 2030 ([11]), it is possible to assume that the most affected stands will be Norway spruce stands in the elevation range of 400-600 m a.s.l. In this range, it is expected that spruce forests will almost completely disappear. The occurrence of Norway spruce will be limited to higher elevations above 600 m a.s.l. (mountain forests), i.e., locations where this species is naturally occurring and dominant ([11], [12], [22]). Therefore, it is necessary to find a suitable stand composition of natural tree species which could replace these unnatural stands, ensuring at the same time a comparable carbon sequestration.
The main aim of this study was to assess the relationship or potential influence of abiotic variables (elevation, temperature, precipitation, duration of growing season and soil group), chemical elements (content of bound forms of oxides of Fe, Al, Ca, Mg, K, Mn, P and N) and related variables (base saturation, pH, and C/N ratio) on SOC content in the surface mineral horizon in stands of Norway spruce and European beech. Due to the current problem of unnatural spruce stands in the Czech Republic, our objectives were to assess whether forest naturalness can influence SOC content, and whether SOC content varies according to tree species and mixture, with the final goal to attempt to find a suitable stand composition which could replace the unnatural Norway spruce stands in the Czech Republic, especially in the context of global climate change, so as to fulfill at least a comparable carbon sequestration function.
Material and methods
Description of study area
In this study, the database of forest typology (at the Forest Management Institute - FMI) was used. This data was acquired from monitoring plots, which were determined by the FMI.
The research included 81 monitoring plots established between 1960 to 2004 from the database of forest typology. The geographic location of each monitoring plot is defined. The database contains information on soil conditions of the site, including content of individual chemical elements and species composition of forest stands. The size of selected circular monitoring plots varied in the range of 400-500 m2.
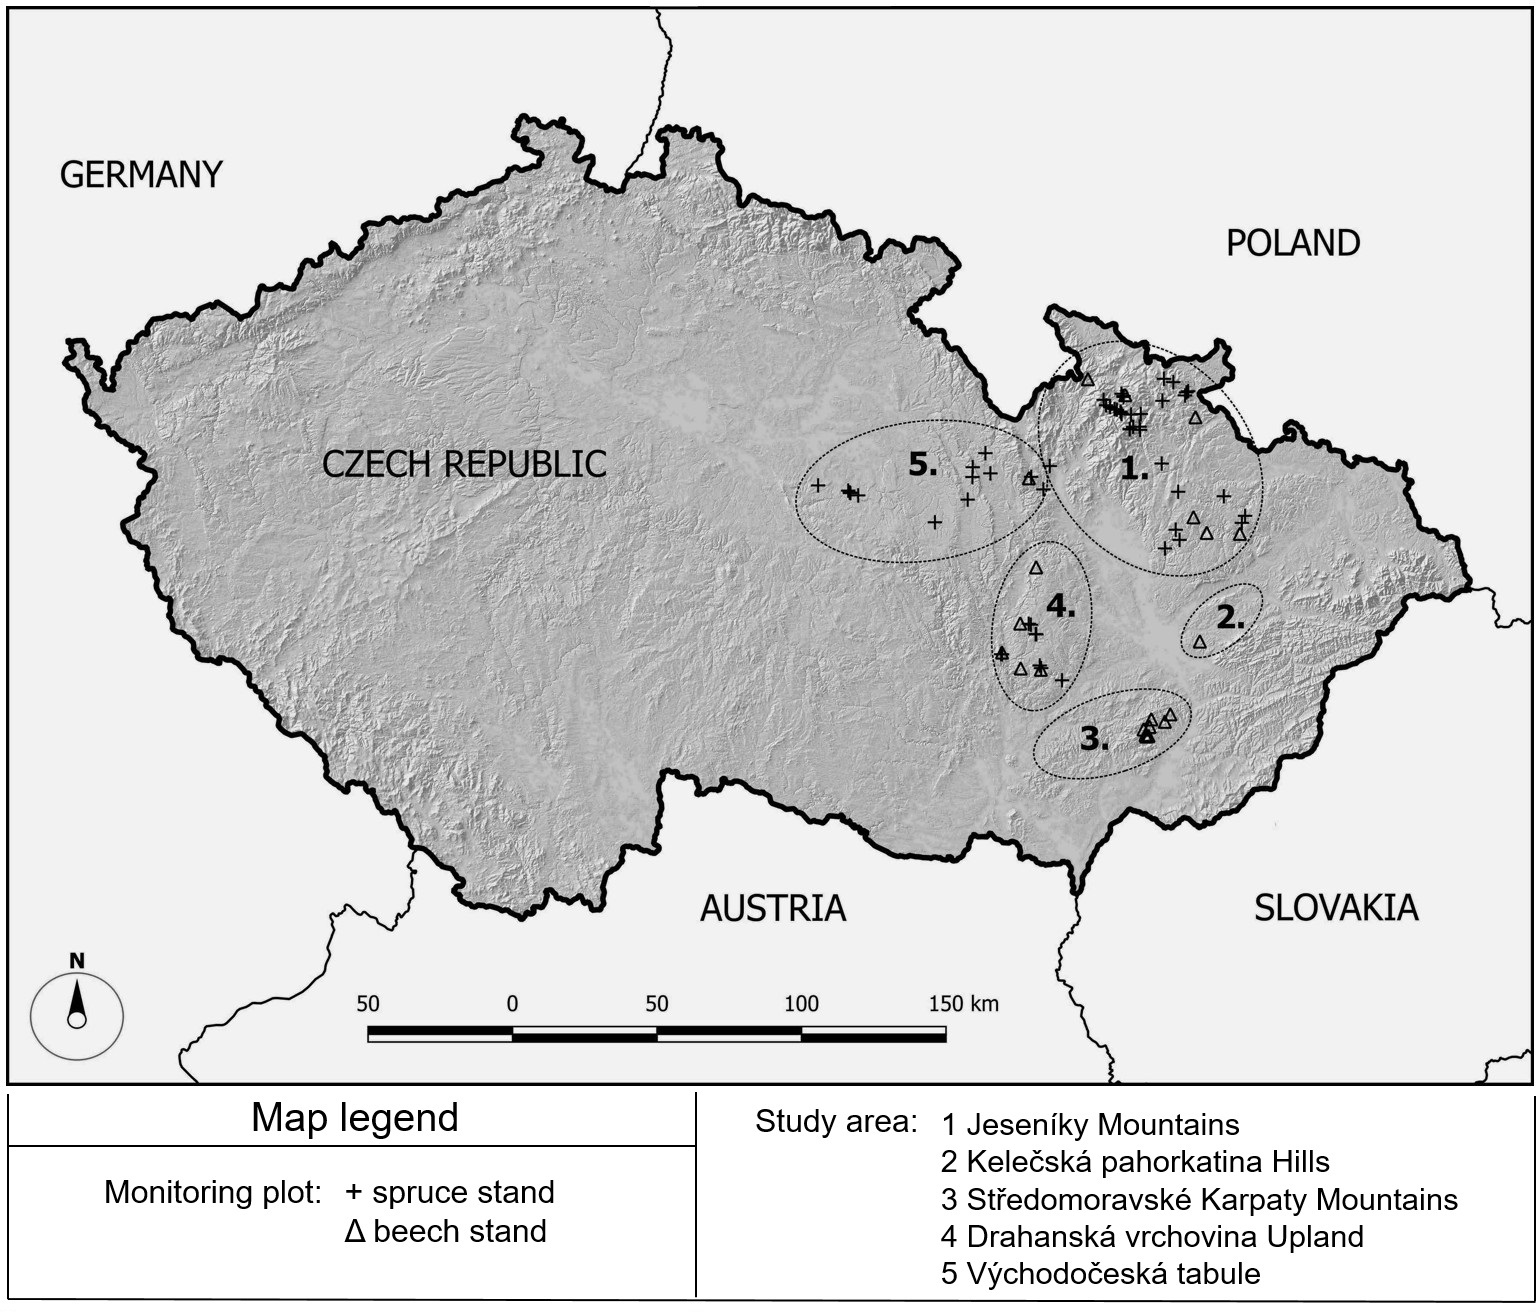
The monitoring plots were mainly established in the eastern part of the Czech Republic, in the Jeseníky Mountains, the Drahanská vrchovina Upland, the Stredomoravské Karpaty Mountains, the Kelečská pahorkatina Hills and partly in the Východočeská tabule (Fig. 1). The selected set of plots occurs within an elevation range of 320-1318 m a.s.l. with an average annual air temperature of 2.1-8.1 °C and an average annual precipitation between 621 and 1106 mm.
Fig. 1 - Location of the study area and monitoring plots.
Soil conditions at the monitoring plots largely vary; according to the World Reference Base ([48]), they represent the soil groups of Cambisols, Podzols, Stagnosols, Luvisols and Leptosols. The dominant soil group in the selected set is Cambisols.
Soil samples were taken from the surface mineral soil horizon (the A horizon) in each soil pit. The thickness of surface mineral soil horizons ranged from 1 to 35 cm (with an arithmetic mean of 8 cm). An organic horizon with thickness ranging 3-15 cm (mean = 7 cm) was always present above the A horizon.
Stand description
The dataset of 81 monitoring plots included stands with 91-100% representation (share) of Norway spruce and European beech; these stands were marked as pure stands. In addition, stands with 50-90% major (dominant) representation of spruce and beech were also present; these stands were marked as mixed stands. In these mixed stands, with dominance of spruce or beech, other species are present such as Silver fir (Abies alba Mill.), European larch (Larix decidua Mill.), Scots pine (Pinus sylvestris L.), Pedunculate oak (Quercus robur L.), Sessile oak (Quercus petraea Matt. Liebl.) and some other broadleaf species, either admixed or interspersed.
All the studied stands are located within an elevation range of 320-1318 m a.s.l. Norway spruce stands in the study area occur in the range of 325-1318 m a.s.l., but natural occurrence is in the range of 520-1318 m a.s.l. The occurrence of spruce below 520 m a.s.l. is considered unnatural in terms of site. Norway spruce occurs naturally on modal sites (without affecting the soil skeleton, flowing water and water in soil profile) from 520 to 730 m a.s.l. in an admixture of up to 20% along with beech, silver fir, and possibly other tree species. A natural mixture of spruce with beech and silver fir becomes prevalent in the range of 700-890 m a.s.l. Norway spruce begins to be naturally dominant in stands in the range 1010-1180 m a.s.l., culminating at 1170-1230 m. a.s.l. where the species becomes dominant in natural forest communities and is in optimal ecological conditions. Spruce growth is very limited by climatic conditions around 1318 m a.s.l. (flag forms of growth, dwarf solitaires, vegetative spread). The occurrence of European beech in stands of the study area was in the range of 320 to 880 m a.s.l., which is also its natural occurrence. It begins to prevail in the range of 450-560 m a.s.l., but occurs in admixture of up to 20% along with Sessile oak and European hornbeam. European beech is the naturally dominant tree species and occurs in optimal conditions (also in production optimum) in the range of 560-736 m a.s.l. Besides beech, Silver fir and Norway spruce also begin to occur naturally at an elevation of around 700 m a.s.l., and these tree species form a mixture from 700 to 900 m a.s.l. At higher elevations, the European beech recedes from the mixture into the understory, and the Norway spruce begins to dominate.
In the study area, there is no representation of unnatural stands of European beech. On the other hand, there is a heavy presence of unnatural stands of Norway spruce, especially unnatural pure stands, due to the massive establishment of monocultures. Therefore, there is probably no representation of natural mixed Norway spruce stands.
The age of the tree layer in the monitoring plots was in the range of 21 to 190 years. Stands included in this study are forests with applied forest management practices, which are conducted for economic purpose. All monitoring plots had been covered by forests for several generations; this is guaranteed by forest legislation, so there was no other way of using these plots in the past. The rotation period for Norway spruce is determined by law in the Czech Republic and is in the range of 130 years to physical age (physical rotation, physical age of Norway spruce fluctuates around 350 years) at higher elevation, thus in natural sites for this tree species. At other (lower) elevation levels the rotation period is in the range of 100 to 130 years, on modal sites the rotation period fluctuates around 110 years. The rotation period for European beech is in the range of 120 to 140 years; this range applies also on modal sites.
Definition and determination of degree of naturalness (forest naturalness)
Forest naturalness can be evaluated and expressed by various methods. Since we used the database of forest typology, the degree of naturalness was determined according to the Forest Management Institute method.
The naturalness of forest stands is expressed by the species composition of the stand. Natural species composition was reconstructed as the composition of natural forest communities. A natural forest is a forest with its original tree species, whose composition and proportion has been somewhat altered by man, but only to the extent that the forest self-regulating abilities have not been disrupted. The degree of naturalness is derived from the comparison of the actual species composition of each part of a stand with its natural potential composition ([32]), which is derived from typological units. Macku ([32]) states that the forest sites type is the basic unit for evaluation of the degree of naturalness. Forest sites type is a part of a forest which includes all original geobiocenosis with homogenous ecological or growth conditions and explicit amplitude of potential autochthonous and allochthonous tree species production. The forest type is characterized by a dominant species combination of phytocenosis, soil properties, habitat and potential yield class of the tree species. Forests types complex is a higher unit of system hierarchy (Typological System of the Forest Management Institute).
The degree of naturalness is a categorical variable taking values in the range of 0-6. The following degrees of naturalness are distinguished: 0 - unsuitable (introduced tree species); 1 - very low (mostly unsuitable composition); 2 - low (rather unsuitable composition); 3 - medial (culture forest - appropriate composition); 4 - high (mostly natural composition); 5 - very high (near natural composition); 6 - exceptional (natural composition). The adoption of such classification requires a sufficient number of samples (stands) per class to support statistical analysis. Therefore, the above classes were pooled in two groups: (i) natural vegetation (stands), with a degree of naturalness of 4-6; (ii) unnatural vegetation (stands), with a degree of naturalness of 1-3. This simplified classification was used in all further analyses.
Soil sampling, determination of soil organic carbon (SOC) and chemical elements
Soil samples were taken at each of the 81 monitoring plots during the growing season. Each soil sample was taken only once from a single soil pit (one soil pit in each monitoring plot) established in the central part of the monitoring plot. Each monitoring plot was established by the FMI as a representative site. Soil samples were taken from the A horizon by a FMI specialist with relevant experience of pedology, according to appropriate and current internal methodology at the time.
Soil samples were analysed in the laboratory at FMI in Brandýs nad Labem to determine the content of soil organic carbon (SOC) as well as the content of bound forms of oxides of selected chemical elements (iron: tFe; aluminium: tAl; calcium: tCa; magnesium: tMg; potassium: tK; manganese: tMn; phosphorus: tP; nitrogen: tN). Related variables, such as basic saturation (BS), pH (pH/H2O), and the ratio of carbon to nitrogen (C/N) were also determined. All soil samples were homogenized before the analysis.
For determination of SOC, the chromo-sulfuric compound oxidation method was used, which was accompanied by titration of hydroquinone (wet method - [36]). For a better comparison[n/a]with related studies, SOC values were converted from units of % to units of t ha-1 for the surface mineral horizon, according to methodology proposed by Macku ([34]). The thickness of horizons in cm, bulk density (g cm-3), and content of soil organic carbon SOC (%) were then entered into the recalculation (of SOC in % to SOC in t ha-1). Values of bulk density (g cm-3) were determined as bulk density reduced (dried at 105 °C to constant weight - gravimetric method). These values were part of the methodology by Macku in Marek et al. ([34]), because for various combinations of forest vegetation zones and ecological series, specific bulk density for SOC in the surface mineral horizon is determined.
The determination of content of bound forms of oxides of selected chemical elements (tFe, tAl, tCa, tMg, tK, tMn, tP) and other soil parameters (BS, pH, C/N) was performed according to FMI methodology at the FMI pedological laboratory in Brandýs nad Labem ([20]). The content of the above elements was determined after leachate in 20% HCl (see Tab. S1 in Supplementary material for details) and marked as “content of bound forms of oxides”, according to FMI methodology and standard methods.
Statistical analysis
Statistical analysis was conducted using the software STATISTICA® v. 12 (StatSoft, Inc., Tulsa, OK, USA). Descriptive statistics for the analyzed variables are reported in Tab. S2 (Supplementary material). First, the dataset of 81 soil samples was analyzed. The relationships and dependencies between soil variables (SOC content; soil content of tFe, tAl, tCa, tMg, tK, tMn, tP, tN; BS, pH and C/N ratio) and a set of abiotic variables associated with the elevation gradient (average annual air temperature, average annual precipitation, duration of growing season, i.e., sum of days with temperature above 10 °C) were analyzed by means of Spearman’s correlation coefficients (α = 0.05). For a better understanding of correlation structure among quantitative variables, PCA (Principal Component Analysis) was performed and the first two principal components were visualized in biplot (Fig. S1 in Supplementary material).
Based on the outputs from PCA and correlation analysis, the dataset of 81 monitoring plots was first divided into 2 groups, according to the degree of naturalness of stands: natural stands (35 plots) and unnatural stands (46 plots), following the methodology described above. These two groups were further subdivided into 5 partial datasets, according to the percentage representation of the dominant tree species in the stands and their degree of naturalness: (i) pure SP-na: natural stands with 91-100% of Norway spruce (n=11); (ii) pure SP-un: unnatural stands with 91-100% of Norway spruce (n=30); (iii) pure BE-na: natural stands with 91-100% of European beech (n=13); (iv) mixed SP-un: unnatural stands with 50-90% of Norway spruce (n=16); (v) mixed BE-na: natural stands with 50-90% of European beech (n=11). Correlation analysis among the studied variables was performed independently for each of these partial datasets and a correlation matrix was obtained for each subset.
Spearman’s or Pearson’s correlation coefficients were used, according to the data normality condition. To verify normality, the Shapiro-Wilk test was used. Non-normal distribution of datasets of pure stands has been demonstrated. For this reason, non-parametric methods and tests were preferred. On the other hand, normal distribution of datasets has been demonstrated in mixed stands. Levene’s test was used to determine homogeneity of variance. To determine the outlier (extreme) values, the non-parametric Dean-Dixon test and the parametric Grubbs’ test were used. Based on the results of the above tests, the Kruskal-Wallis test was conducted to determine the significance of differences between individual groups of variables in the datasets. The Kruskal-Wallis test was used in combination with the Mann-Whitney U test in the case of non-normal distribution of data, while in the case of normal distribution of data the t-test was used. All tests were performed at 5% level of significance.
Description of the dataset made use of common descriptive statistics (median, arithmetic mean, variance, frequency and values of minimum/maximum, interquartile range). For the interpretation of outputs and graphic representation of results, median values were primarily used as they are less sensitive to outliers or extreme values than arithmetic mean values.
Results
The results showed a significant correlation between content of SOC and the following abiotic variables: elevation (R = 0.58; p < 0.01), average annual air temperature (R = -0.58; p < 0.01), average annual precipitation (R = 0.52; p < 0.01), and duration of growing season (R = -0.58; p < 0.01). Because average annual air temperature, average annual precipitation and duration of growing season are all very closely related to elevation, only this latter variable has been included in further analyses. Indeed, the content in SOC increases with increasing elevation. In addition to SOC, the tN also correlates positively with elevation (R = 0.53; p < 0.01).
In addition to correlations with abiotic variables, a significant positive correlation of SOC with tN (R = 0.61; p < 0.01) was detected. The other chemical elements did not show any significant correlation with SOC content, except for phosphorus (tP) which was positively correlated with SOC (R = 0.32; p < 0.05). A detailed analysis of the relationships among SOC, tN and tP content and elevation showed mutual positive correlations (e.g., tP-tN: R = 0.41, p < 0.05; tP-elevation: R = 0.47, p < 0.05 - see also Fig. S2 in Supplementary material). Additionally, a positive correlation between SOC content and the degree of naturalness of stands was found.
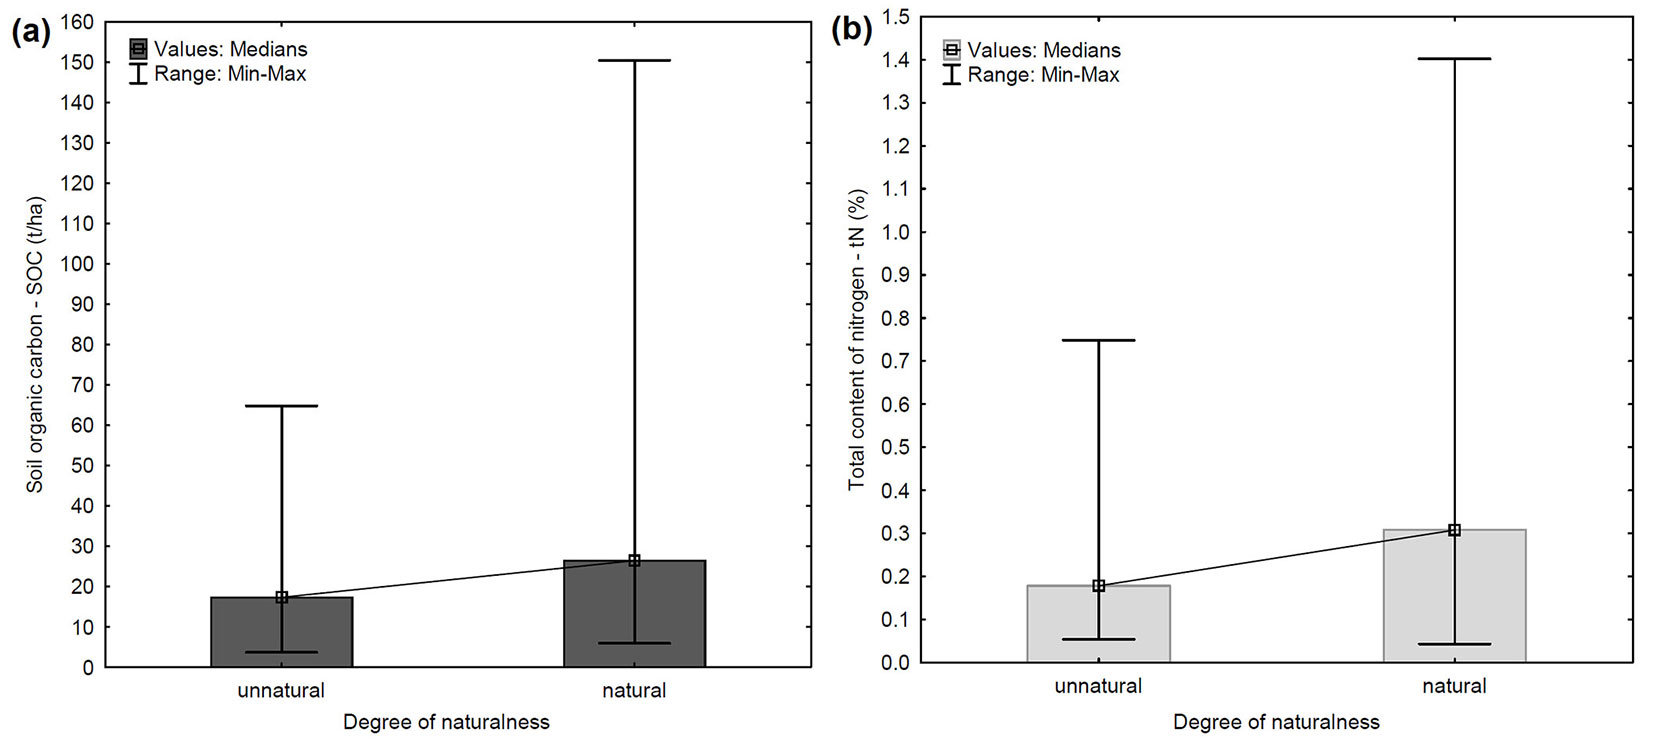
The SOC content noticeably increases with increasing degree of naturalness of the analyzed stands (R = 0.22; p < 0.05) using the dataset of 81 monitoring plots. Therefore, the content of SOC in the mineral soil horizon was compared between natural stands and unnatural stands (35 and 42 plots, respectively - Fig. 2a). A significantly higher content of SOC was detected in natural stands, ranging from 5.93 to 150.48 t ha-1, with a median of 26.46 t ha-1, whilst in unnatural stands SOC content varied in the range 3.68-64.83 t ha-1, with a median of 17.36 t ha-1. Content of tN was also significantly (p < 0.01) higher in natural stands, with a median value 0.31% (Fig. 2b).
Fig. 2 - Comparison of SOC content (a) and tN content (b) in the mineral soil horizon between natural and unnatural stands at the 81 monitoring plots.
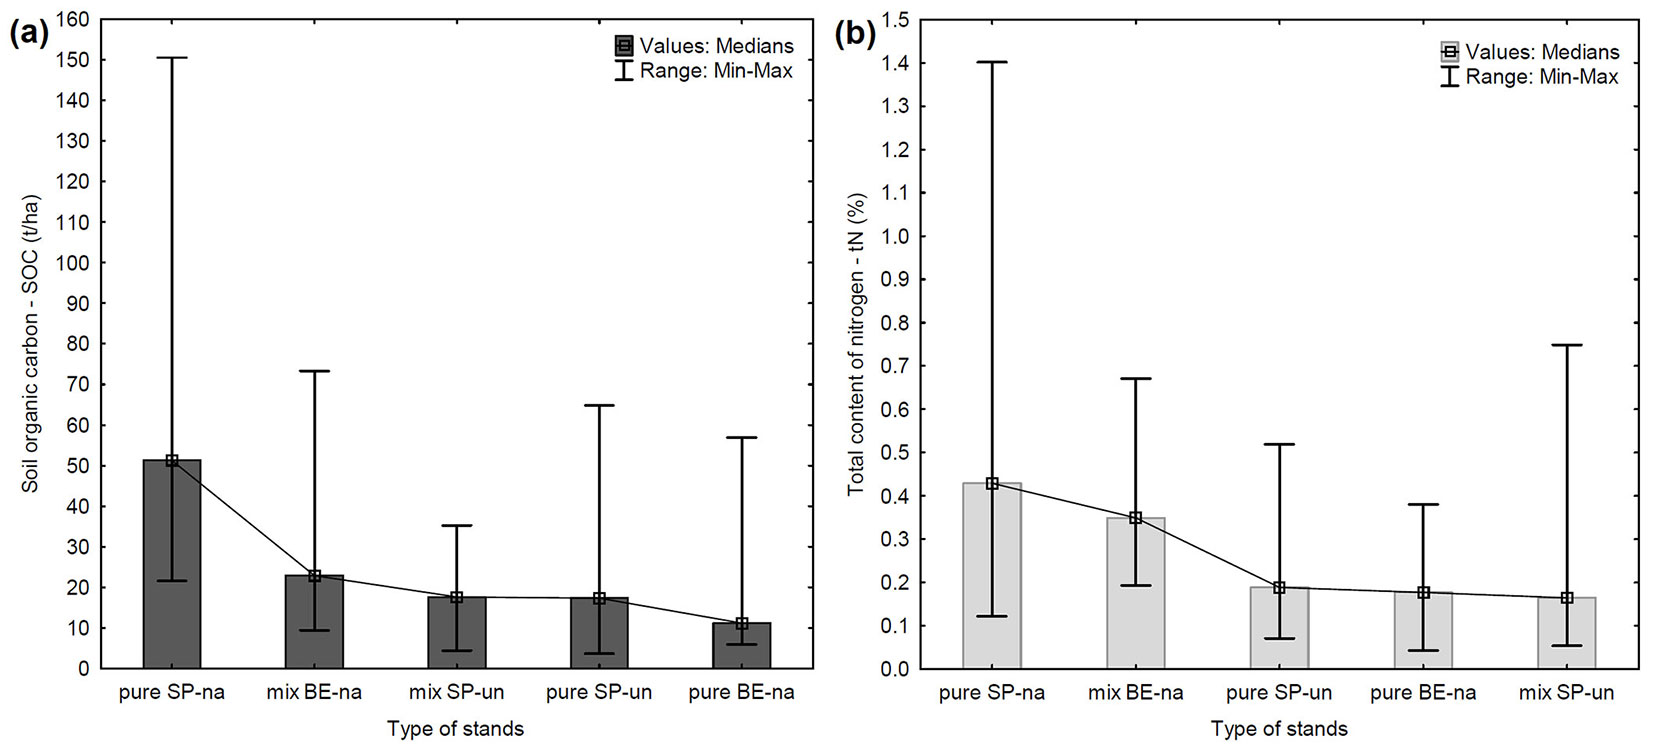
For more detailed results, differences between 5 groups of stands (according to the percentage representation of the dominant tree species and degree of naturalness of the stand) were found. The absolute highest content of SOC was found in pure SP-na (pure natural Norway spruce stands, 91-100% share) with a median of 51.27 t ha-1 and a remarkable variance due to the presence of several outlier values (Fig. 3a). The second highest content of SOC was observed in mix BE-na (natural mixed European beech stands, 50-90%). On the other hand, the lowest content of SOC was also found in pure stands, but in pure BE-na (natural European beech stands, 91-100%), with a median of 11.19 t ha-1. Significant differences (p < 0.01) in SOC content between the 5 groups are reported in Tab. 1. Significant differences (p < 0.01) in SOC content were found between the groups of pure natural Norway spruce stands and pure natural European beech stands and between pure natural and pure unnatural Norway spruce stands (Tab. 2). The same comparison was made in mixed stands (Tab. 3), finding a significantly higher SOC content (median value: 22.90 t ha-1; p < 0.05) in mixed BE-na (mixed natural European beech stands, 50-90 %).
Fig. 3 - Comparison of SOC (a) and tN content (b) in mineral soil horizon in 5 groups of stands according to the representation of the dominant tree species. (pure SP-na): pure natural stands with 91-100% representation of Norway spruce; (mix BE-na): mixed natural stands with 50-90% representation of European beech; (mix SP-un): mixed unnatural stands with 50-90% representation of spruce; (pure SP-un): pure unnatural stands with 91-100% representation of spruce; (pure BE-na): pure natural stands with 91-100% representation of beech.
Tab. 1 - Significant differences (p-values) in SOC and tN content between the 5 groups of stands after Kruskal-Wallis tests. (pure SP-na): pure natural stands with 91-100% representation of Norway spruce; (mix BE-na): mixed natural stands with 50-90% representation of European beech; (mix SP-un): mixed unnatural stands with 50-90% representation of Norway spruce; (pure SP-un): pure unnatural stands with 91-100% representation of Norway spruce; (pure BE-na): pure natural stands with 91-100% representation of European beech; (ns): non-significant.
| Variable | Group | pure SP-na | pure SP-un | pure BE-na | mixed SP-un | mixed BE-na |
|---|---|---|---|---|---|---|
| Soil organic carbon (SOC, t ha-1 - p < 0.01) |
pure SP-na | - | 0.000307 | 0.000299 | 0.000285 | ns |
| pure SP-un | 0.000307 | - | ns | ns | ns | |
| pure BE-na | 0.000299 | ns | - | ns | ns | |
| mixed SP-un | 0.000285 | ns | ns | - | ns | |
| mixed BE-na | ns | ns | ns | ns | - | |
| Total nitrogen content (tN, % - p < 0.05) |
pure SP-na | - | 0.008479 | ns | 0.005001 | ns |
| pure SP-un | 0.008479 | - | ns | ns | 0.024039 | |
| pure BE-na | ns | ns | - | ns | ns | |
| mixed SP-un | 0.005001 | ns | ns | - | 0.013301 | |
| mixed BE-na | ns | 0.024039 | ns | 0.013301 | - |
Tab. 2 - Significant differences (p-values) in SOC and tN content between the groups of pure stands according to Kruskal-Wallis tests. (pure SP-na): pure natural stands with 91-100% representation of Norway spruce; (pure SP-un): pure unnatural stands with 91-100% representation of Norway spruce; (pure BE-na): pure natural stands with 91-100% representation of European beech.
| Variable | Group | pure SP-na | pure SP-un | pure BE-na |
|---|---|---|---|---|
| Soil organic carbon (SOC, t ha-1 - p < 0.01) |
pure SP-na | - | 0.000202 | 0.000182 |
| pure SP-un | 0.000202 | - | - | |
| pure BE-na | 0.000182 | - | - | |
| Total nitrogen content (tN, % - p < 0.05) |
pure SP-na | - | 0.002051 | 0.019608 |
| pure SP-un | 0.002051 | - | - | |
| pure BE-na | 0.019608 | - | - |
Tab. 3 - Significant differences (p-values) in SOC and tN content between groups of mixed stands according to t-tests for independent samples. (mix BE-na): mixed natural stands with 50-90% representation of European beech; (mix SP-un): mixed unnatural stands with 50-90% representation of Norway spruce.
| Variable | Group | mixed SP-un | mixed BE-na |
|---|---|---|---|
| Soil organic carbon (SOC, t ha-1 - p < 0.01) |
mixed SP-un | - | 0.020808 |
| mixed BE-na | 0.020808 | - | |
| Total nitrogen content (tN, % - p < 0.05) |
mixed SP-un | - | 0.020632 |
| mixed BE-na | 0.020632 | - |
We also found a significant positive correlation of SOC with tN in all pure stands (91-100%), with SOC content increasing with increasing tN content. The correlation coefficient (R) bewteen these variables was 0.73 in pure SP-na (pure natural Norway spruce stands, 91-100% representation), 0.59 in pure SP-un (pure unnatural Norway spruce stands, 91-100%) and 0.71 in pure BE-na stands (pure natural European beech stands, 91-100%). All the above correlations were significant at p < 0.05. The highest content of tN, with a median of 0.43%, was detected in pure SP-na (pure natural Norway spruce stands, 91-100% - Fig. 3b). The content of tN observed in pure unnatural Norway spruce stands was similar to that recorded for pure natural European beech stands (0.19% vs. 0.18%, respectively). Significant differences in tN content between the 5 groups are displayed in Tab. 1, and between groups of pure stands in Tab. 2. The trend of tN content is very similar to the trend of SOC content according to type of stand (Fig. 3a, Fig. 3b). Other chemical elements and related variables did not show any significant correlation with SOC content in all pure stands.
In mixed stands (50-90% representation of the dominant species), a positive correlation between SOC and tN was found only in the case of natural beech stands (mixed BE-na: r = 0.63, p < 0.05), where the median value of tN was 0.35%. For mixed unnatural spruce stands (mixed SP-un), the correlation was not significant. The difference in tN content between groups of mixed stands was significant (p < 0.05), as well as the difference in SOC content (Tab. 3). In addition, a positive correlation between SOC content and tP (r = 0.69, p < 0.05) was found only in natural mixed beech stands (mixed BE-na).
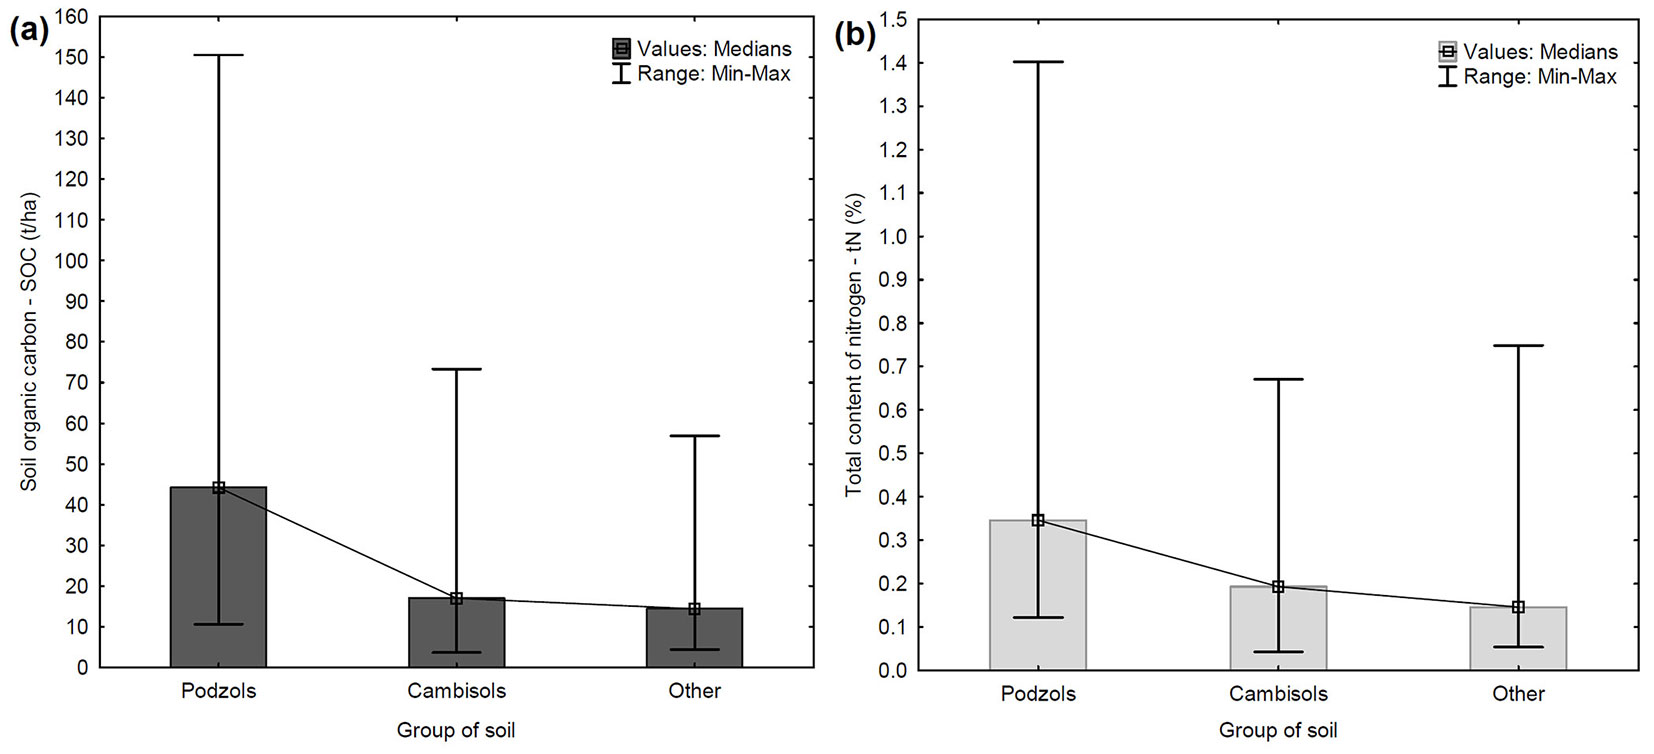
No further correlations or potential relationships of SOC were found with the other chemical elements under analysis. However, due to the presence of several outlier values, a connection between SOC and group of soil was revealed. In the dataset of 81 samples, the highest SOC content was observed in the Podzols group, with a median of 44.20 t ha-1 (Fig. 4a). Podzols also showed the highest variance in SOC content. The lowest SOC content was detected in the group “Other” (which includes Stagnosols, Leptosols, and Luvisols), where the median value was only 14.40 t ha-1. Significant differences in SOC content were observed between Podzols and Cambisols and between Podzols and the Other group (Tab. 4). The content of tN was also compared among these groups of soil. The highest tN content was recorded in the Podzols group (median of 0.35% - Fig. 4b), while the lowest was detected in the Other group (median value of 0.15%). As observed for SOC, significant differences in tN content were found between the same groups of soil (Tab. 4). The trend of tN content is similar to the trend of SOC content for soil groups.
Fig. 4 - Comparison of SOC (a) and tN content (b) in mineral soil horizon between the different soil groups. (Other): includes Stagnosols, Leptosols, and Luvisols.
Tab. 4 - Significant differences (p-values) in SOC and tN content between soil groups according to Kruskal-Wallis tests. (ns): non-significant.
| Variable | Group | Podzols | Cambisols | Other |
|---|---|---|---|---|
| Soil organic carbon (SOC, t ha-1 - p < 0.01) |
Podzols | - | 0.000419 | 0.002872 |
| Cambisols | 0.000419 | - | ns | |
| Other | 0.002872 | ns | - | |
| Total nitrogen content (tN, % - p < 0.05) |
Podzols | - | 0.001920 | 0.001656 |
| Cambisols | 0.001920 | - | ns | |
| Other | 0.001656 | ns | - |
Log-linear models
A more complex assessment of factors influencing the SOC content is based on a linear model where log (SOC) was considered as a dependent variable. The (natural) logarithm was used to avoid problems caused by skewness of the distribution of SOC. Four different stand types were compared: the pure stands (91-100% representation) of Norway spruce and of European beech and the mixed stands (50-90%) of spruce and of beech. It is worth noting that the factor given by the dominant tree species (Norway spruce/European beech) coincides with the categorised factor of naturalness (unnatural/natural) in this case. The fifth group included in the original data set (i.e., the pure natural stands of Norway spruce) was excluded from this analysis because it differed significantly for several aspects from the remaining four groups (higher elevation and other abiotic factors, prevailing Podzols soil group). The remaining four groups did not differ significantly either in elevation or in soils, and, therefore, they were eligible for comparison.
The model revealed a significantly higher SOC content in the mixed European beech stands (p = 0.02). Their content of SOC was higher by 24% when compared with the three remaining groups. There were no significant differences between the remaining groups. The model also includes the factor of elevation. It was estimated that SOC content increases by 8.6% with a 100 m increase in elevation (p = 0.0006). For mixed European beech stands, the SOC content can be described as follows (eqn. 1):
while for the remaining stands (eqn. 2):
The effect of soil group was not significant.An analogous model can be fitted for tN, resulting in a higher tN content for the European beech stands (p < 0.0001). It is twice as high (100% higher) when compared with the tN concentration in the remaining three groups, whose differences were not significant. The content of tN increases by 21.3% with a 100 m increase in elevation (p < 0.0001). For mixed European beech stands, the tN content can be described as follows (eqn. 3):
and for the remaining stands (eqn. 4):
The effect of soil group was not significant.
Discussion
Our results confirmed that elevation gradient, as a common factor underlying many abiotic variables, influences the content of SOC and tN in forest stands. With increasing elevation both SOC and tN contents increase. This trend has been previously reported by a number of studies ([14], [44], [6], [5], [21], [47]; for tN, [10]). However, several studies also showed the opposite trend ([40], [3]). According to several authors, high SOC and tN stocks have been found in mountain forests (at higher elevation) from tropical, to subtropical, to temperate regions ([9], [14], [49]). Higher SOC and tN content at higher elevations can be explained by the lower temperature and higher precipitation, which reduce the decomposition rate, as well as by the higher proportion of fine-root biomass and the high root:shoot ratio of trees, which maximize the nutrient uptake when nutrient availability is limited as a result of lower decomposition ([41], [14]).
In this study, we also found that tN content is associated with SOC content. Scientific literature has long discussed the effect of nitrogen deposition on carbon content (SOC storage) in forest soil, but the results are uncertain, although the prevailing opinion in scientific discussion is of a positive relationship between them ([15], [45], [38]). Our results showed that tN content is higher in stands with high SOC content, and a positive correlation between them has been demonstrated. Based on this finding, it is possible to hypothesize the positive effect of tN on SOC content and carbon sequestration. According to meta-analysis by Janssens et al. ([25]), it can be assumed that nitrogen deposition impedes organic matter decomposition, thus favoring carbon sequestration, in temperate forest soils where nitrogen does not limit microbial growth. However, the role of nitrogen deposition in increasing net primary production (NPP), and the subsequent carbon sequestration in European forests, is still a subject of debate with contrasting scientific opinions ([33], [19]).
The relationship between other chemical elements (content of bound forms of oxides of Fe, Al, Ca, Mg, K and Mn) or related variables (BS, pH, C/N) and SOC content were also considered in this study. None of these variables (except phosphorous) affected the SOC content in the studied stands (see Fig. S1 in Supplementary material). The mutual positive correlation of SOC, tN, and tP with elevation in our dataset of 81 monitoring plots allows to speculate the potential synergistic positive effect of these variables on carbon sequestration. However, in order to confirm this hypothesis, it will be necessary to repeat similar analyses on larger datasets.
We observed a significant relationship between SOC content and the degree of naturalness in the studied stands. Moreover, a higher content of SOC and tN was recorded in the soil of natural stands (Fig. 2a, Fig. 2b). The relationship between forest naturalness and SOC content is not sufficiently elucidated. Forest naturalness, its assessment and use as a criterion for forest management, is discussed in many publications ([8], [35], [50]), but no studies focused on the influence of forest naturalness on the ability to store soil organic carbon. To throw light on this topic, we divided the 81 monitoring plots into 5 groups, according to forest naturalness and predominant tree species. However, there was an unequal number of samples in each group due to the limited number of plots analyzed. Indeed, only a small number of natural pure Norway spruce stands are present in the studied area, due to limited extension of mountain forests. On the other hand, the study area has a significant representation of unnatural Norway spruce stands. It should also be noted that samples from unnatural pure European beech stands, natural mixed Norway spruce stands and unnatural mixed European beech stands were not present in the dataset from the study area.
Our results support the evidence that more SOC is stored under coniferous trees than broadleaf trees ([27], [5], [39]). Higher SOC and tN content were found in natural pure Norway spruce stands than in natural pure European beech stands. Oulehle et al. ([38]) also proved a higher content of nitrogen under spruce stands than beech stands. The higher content of SOC and tN directly relates to differences in elevation and the associated occurrence of a group of soils on which the stands naturally grow in the study area. Indeed, the natural pure Norway spruce stands occur from 1010 to 1318 m a.s.l. (with a median of 1180 m a.s.l.) where the dominant group of soils is Podzols; whereas the natural pure European beech stands occur from 425 to 810 m a.s.l. (with a median of 480 m a.s.l.) where the dominant group of soils is Cambisols. Natural pure Norway spruce stands play a very important and irreplaceable role in sequestration of SOC. Of all the observed stands, they showed the highest SOC content and also the highest tN content (Fig. 3a, Fig. 3b).
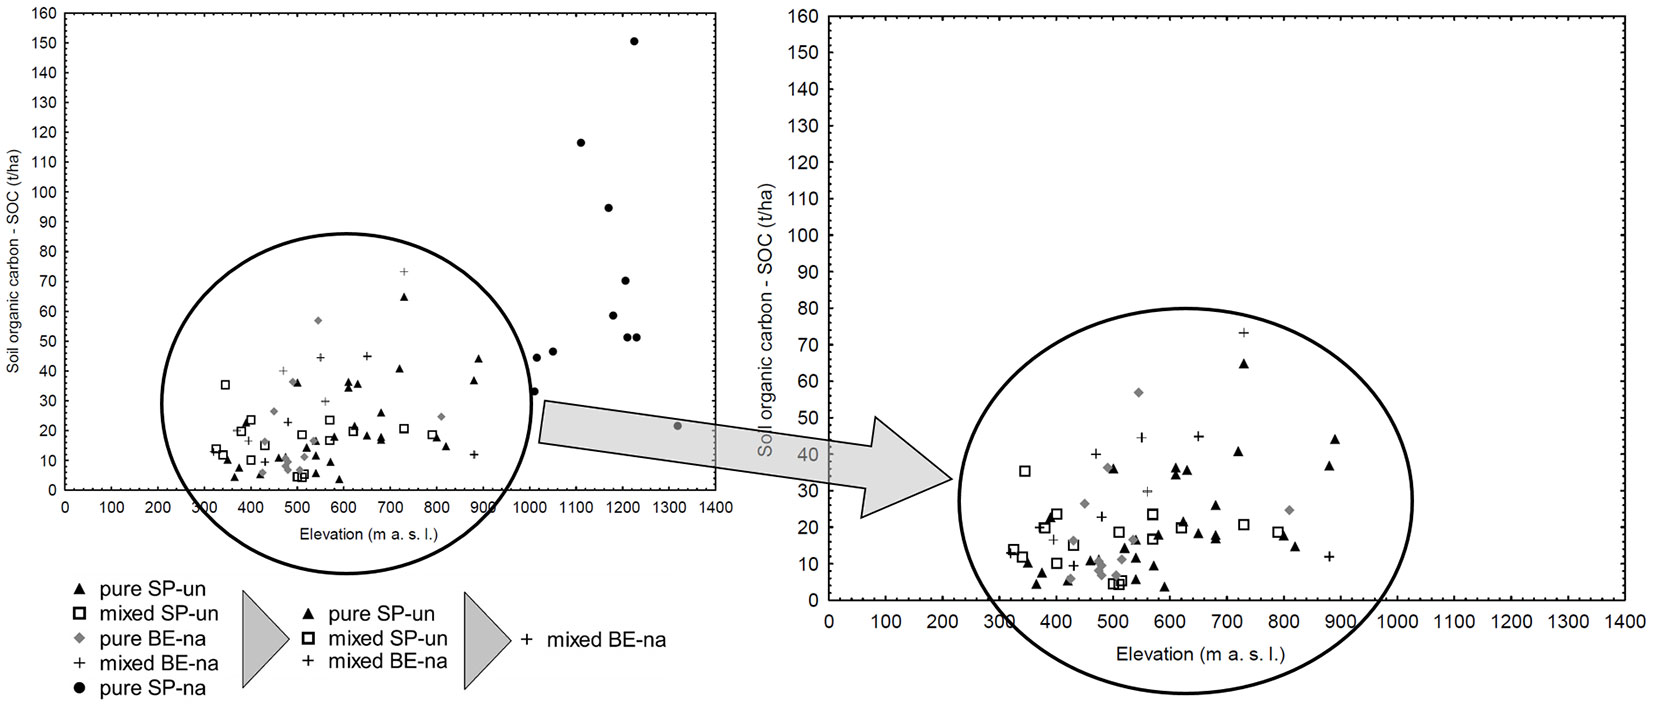
In this study, the SOC (and tN) content was higher in natural mixed European beech stands, compared with unnatural mixed Norway spruce stands or unnatural pure Norway spruce stands (Fig. 3a, Fig. 3b). These stands occur at comparable elevations (natural mixed European beech: 320-880 m a.s.l.; unnatural mixed Norway spruce: 325-790 m a.s.l.; unnatural pure Norway spruce: 350-890 m a.s.l.) where the common dominant soil group is Cambisols (see also Fig. S3 in Supplementary material). These stands differ in their forest naturalness, so it can be assumed that forest naturalness is, for these stands, an important parameter in relation to SOC sequestration. Moreover, we found that natural mixed European beech stands had a higher SOC content than unnatural mixed and pure Norway spruce stands. Similar results were also reported by Kern et al. ([27]) and Dawud et al. ([18]). Based on the above evidence, it would be advisable to consider establishing natural mixed European beech stands in the considered elevation belt, thus replacing existing unnatural Norway spruce stands (Fig. 5). In the context of increasing problems of dieback of Norway spruce stands grown on unnatural sites in the Czech Republic, and of global climate change ([28], [29], [37]), it is appropriate to consider the function of sequestration of carbon in the restoration and conversion of these stands. According to Andivia Muñoz et al. ([2]) an admixture of individual European beech and Norway spruce trees may lead to a transfer of SOC from the forest floor to the better protected mineral soil layer, which might be beneficial for long-term SOC sequestration.
Fig. 5 - Dual chart of the 81 individual stands divided in 5 groups according to elevation and SOC content. In the right panel (detail), the black circle highlights the range of elevation and SOC content where unnatural spruce stands could be replaced by mixed natural beech stands (see text). Stands belonging to the same group, according to dominant tree species and degree of naturalness, are indicated by the same symbol. (pure SP-na): pure natural stands with 91-100% representation of Norway spruce; (mix BE-na): mixed natural stands with 50-90% representation of European beech; (mix SP-un): mixed unnatural stands with 50-90% representation of Norway spruce; (pure SP-un): pure unnatural stands with 91-100% representation of Norway spruce; (pure BE-na): pure natural stands with 91-100% representation of European beech.
In this study, attention has also been paid to the relationship between SOC and tN content and soil group and elevation ([4], [5]). Among all the soil groups, the highest content of SOC and tN was observed in the Leptosols, though this results was based on two samples only. Therefore, further research with a higher number of samples for this soil type (soil group) are needed. Due to the uneven and low number of samples in some soil groups, the soil groups were divided into 3 groups (Podzols, Cambisols and Other). The highest SOC and tN content was demonstrated in the Podzols soil group (Fig. 4a, Fig. 4b), which included all extreme values (outliers) of SOC. After finding that Podzols contain significantly higher content of SOC in upper soil horizons, these samples were intentionally kept in the dataset. Strand et al. ([43]) stated that Podzolic soils have a larger fraction of profile C in mineral soil (about 60%) compared with other mineral soils (Regosolic: 36%; Gleysolic: 41%), and that tN content is similar. Bojko & Kabala ([5]) also found the highest content of SOC in the Podzols group and also demonstrated a trend in SOC content Luvisols<Cambisols<Podzols which is very similar to our results (Fig. 4a). In the context of Czech forests, certain soil types (soil groups) predominantly occur at certain elevations (for example Podzols prevail at high altitude - Fig. S3 in Supplementary material). These evidence supports the hypothesis that natural pure Norway spruce stands growing in natural sites and conditions can indeed fulfill the indispensable function of SOC sequestration.
Conclusion
Our results show that elevation has a positive relationship with SOC and tN content in the surface mineral horizon of Norway spruce and European beech stands. Of the studied chemical elements and related variables, only a close positive relationship between SOC and tN content was observed. A positive relationship of forest naturalness and SOC content was also demonstrated, with a higher SOC content in natural stands compared with unnatural stands.
The comparison of soil samples between tree species (spruce vs. beech) and stand types (pure vs. mixed) revealed the highest SOC content in pure natural Norway spruce stands. We conclude that these stands can perform a very important and irreplaceable function in the sequestration of SOC. The second highest SOC content was found in mixed natural European beech stands, which was higher than that observed for mixed unnatural Norway spruce stands and pure unnatural Norway spruce stands. Therefore, regarding carbon sequestion in the soil, mixed European beech stands could be considered suitable for the replacement of Norway spruce stands growing at unnatural sites, especially in the context of global climate change and current spruce dieback.
Changing forest management to near-natural forms and respecting models of potential natural vegetation seems to be a suitable way of fulfilling the carbon sequestration function, especially under the anticipated climate change. Further research should be done on larger datasets aimed at finding other suitable stand types (including other tree species and admixtures) which can effectively and successfully perform the carbon sequestration functions (“carbon service”).
Acknowledgements
This work was supported by the Technology Agency of the Czech Republic (project No. SS02030018). The authors wish to thank four anonymous reviewers for their valuable and insightful comments which significantly improved the original manuscript. The authors and the Palacký University thank the Forest Management Institute for providing data.
References
Online | Gscholar
Gscholar
Online | Gscholar
Gscholar
CrossRef | Gscholar
Gscholar
Gscholar
Gscholar
CrossRef | Gscholar
Gscholar
Gscholar
CrossRef | Gscholar
Authors’ Info
Authors’ Affiliation
Petra Hanáková Bečvárová
Borivoj Šarapatka 0000-0002-5070-1628
Department of Ecology and Environmental Sciences, Faculty of Science, Palacký University Olomouc, Šlechtitelu 241/27, 783 71 Olomouc - Holice (Czech Republic)
Department of Mathematical Analysis and Applications of Mathematics, Faculty of Science, Palacký University Olomouc 17, listopadu 12, 771 46 Olomouc (Czech Republic)
Forest Management Institute, Brandýs nad Labem, Branch Brno, Vrázova 1, 61600 Brno - Zabovresky (Czech Republic)
Corresponding author
Paper Info
Citation
Horváth M, Bečvárová PH, Šarapatka B, Vencálek O, Zouhar V (2021). Potential relationships of selected abiotic variables, chemical elements and stand characteristics with soil organic carbon in spruce and beech stands. iForest 14: 320-328. - doi: 10.3832/ifor3654-014
Academic Editor
Marco Borghetti
Paper history
Received: Sep 17, 2020
Accepted: May 11, 2021
First online: Jul 09, 2021
Publication Date: Aug 31, 2021
Publication Time: 1.97 months
Copyright Information
© SISEF - The Italian Society of Silviculture and Forest Ecology 2021
Open Access
This article is distributed under the terms of the Creative Commons Attribution-Non Commercial 4.0 International (https://creativecommons.org/licenses/by-nc/4.0/), which permits unrestricted use, distribution, and reproduction in any medium, provided you give appropriate credit to the original author(s) and the source, provide a link to the Creative Commons license, and indicate if changes were made.

Web Metrics
Breakdown by View Type
Article Usage
Total Article Views: 35050
(from publication date up to now)
Breakdown by View Type
HTML Page Views: 28870
Abstract Page Views: 3117
PDF Downloads: 2348
Citation/Reference Downloads: 3
XML Downloads: 712
Web Metrics
Days since publication: 1814
Overall contacts: 35050
Avg. contacts per week: 135.25
Article Citations
Article citations are based on data periodically collected from the Clarivate Web of Science web site
(last update: Mar 2025)
Total number of cites (since 2021): 3
Average cites per year: 0.60
Publication Metrics
by Dimensions ©
Articles citing this article
List of the papers citing this article based on CrossRef Cited-by.
Related Contents
iForest Similar Articles
Research Articles
Dynamics of soil organic carbon (SOC) content in stands of Norway spruce (Picea abies) in central Europe
vol. 11, pp. 734-742 (online: 06 November 2018)
Research Articles
Soil stoichiometry modulates effects of shrub encroachment on soil carbon concentration and stock in a subalpine grassland
vol. 13, pp. 65-72 (online: 07 February 2020)
Research Articles
The effect of clear-cut age on soil organic carbon and nitrogen indices in Scots pine (Pinus sylvestris L.) stands
vol. 18, pp. 146-153 (online: 09 June 2025)
Research Articles
Estimating changes in soil organic carbon storage due to land use changes using a modified calculation method
vol. 8, pp. 45-52 (online: 17 June 2014)
Research Articles
Impact of deforestation on the soil physical and chemical attributes, and humic fraction of organic matter in dry environments in Brazil
vol. 15, pp. 465-475 (online: 18 November 2022)
Research Articles
Effects of tree species, stand age and land-use change on soil carbon and nitrogen stock rates in northwestern Turkey
vol. 9, pp. 165-170 (online: 18 June 2015)
Research Articles
Soil CO2 efflux in uneven-aged and even-aged Norway spruce stands in southern Finland
vol. 11, pp. 705-712 (online: 06 November 2018)
Research Articles
The effect of soil conditions on submountain site suitability for Norway spruce (Picea abies Karst.) in Central Europe
vol. 16, pp. 210-217 (online: 31 July 2023)
Research Articles
Soil C:N stoichiometry controls carbon sink partitioning between above-ground tree biomass and soil organic matter in high fertility forests
vol. 8, pp. 195-206 (online: 26 August 2014)
Research Articles
Impacts of Norway spruce (Picea abies L., H. Karst.) stands on soil in continental Croatia
vol. 12, pp. 511-517 (online: 02 December 2019)
iForest Database Search
Search By Author
Search By Keyword
Google Scholar Search
Citing Articles
Search By Author
Search By Keywords
PubMed Search
Search By Author
Search By Keyword


