Two Populus deltoides W.Bartram ex Marshall clones cope differentially with sodium salinity stress
iForest - Biogeosciences and Forestry, Volume 18, Issue 5, Pages 259-266 (2025)
doi: https://doi.org/10.3832/ifor4783-018
Published: Oct 10, 2025 - Copyright © 2025 SISEF
Research Articles
Abstract
Salt stress poses a challenge to tree species in regions where salinity occurs intermittently. Poplars (Populus spp.) are key species for forestry, yet their responses to salt stress remain underexplored, particularly within the intra-specific variability of Populus deltoides W.Bartram ex Marshall. This study investigates the sodium accumulation strategies of two P. deltoides clones, ’Australiano 129/60’ (A129) and ’Hovyú INTA’ (HOV), to understand their contrasting responses to low salinity levels that affect growth and development. A field trial was conducted in monoclonal and mixed clonal plantations established in 2017. Soil and water table salinity were monitored, and sodium concentrations were measured in the roots, branches, and leaves. Growth traits, including height and diameter, were analyzed in relation to sodium distribution in plant tissues. Results revealed that both clones absorbed sodium at similar rates in their roots; however, their sodium transport mechanisms diverged in the aboveground tissues. A129 avoided sodium accumulation in leaves, likely through mechanisms of exclusion at the xylem level, minimizing ion toxicity and preserving leaf functionality. In contrast, HOV accumulated higher sodium levels in leaves, correlating with visible damage, reduced growth, and a negative impact on diameter increment. The findings demonstrate that even under low salinity conditions, the intra-specific variability of P. deltoides plays a crucial role in determining growth outcomes. A129’s ability to limit sodium accumulation in leaves offers an adaptive advantage, although it does not classify this clone as highly salt-tolerant. This study provides valuable insights into the sodium dynamics of poplar clones, contributing to the selection of suitable genotypes for forestry practices in regions with moderate salinity challenges. Future research should address the role of other ions, such as chloride, and further characterize the exclusion mechanisms employed by A129 to enhance understanding of salinity responses in P. deltoides.
Keywords
Populus deltoides, Salinity Stress, Sodium Concentration, Intra-specific Variability
Introduction
Salt stress is one of the major abiotic stresses in primary production ([42]). Salinity is a problem in arid and semiarid areas as well as in wetlands worldwide ([21]). On a global scale, it is estimated that approximately 1 billion hectares of land are affected by salinity and sodicity, representing a significant proportion of the world’s cropland ([11]). The identification of tolerant genotypes is a key strategy for coping with salt stress and developing sustainable forest production. Nevertheless, the strategies that confer salinity tolerance can vary among species and varieties ([35]). Several strategies observed in some trees were ion exclusion by the roots ([25]), compartmentalization of ions at the tissue or cell level ([36]), production of compatible solutes, synthesis of specific proteins and metabolites, and induction of transcriptional factors ([30]), among others.
Poplars (Populus spp.) are among the most widely planted tree species globally ([56]). There is a great genetic variability - both intra- and interspecific - that makes it possible to find sensitive, tolerant, and resistant poplars to different abiotic stresses ([13]). Regarding salt stress, Populus euphratica Olivier is recognized as a salt-tolerant species ([18]), whereas Populus deltoides W.Bartram ex Marshall is generally described as sensitive ([34]). However, due to the significant intraspecific variability, P. deltoides clones are likely to exhibit variable salinity tolerance ([47], [28]). In the Delta del Río Paraná, Argentina, salinity is primarily due to chloride (Cl-) salts ([12]), an anion typically associated with the cation sodium (Na+). NaCl affects plant development and growth because Na+ can compete with K+ and alter the homeostasis in the cytosol ([14]). Salinity symptoms in poplars are similar to those produced by water deficit conditions, as dissolved salts in the soil decrease the osmotic potential of the solution and hinder water uptake. When salt uptake cannot be prevented, the excess leads to membrane disorganization and toxicity at the cellular level ([20], [58]). This toxicity causes typical damage, including necrosis of marginal leaf cells, and is characterized by a burnt edge ([4]). For that reason, the exclusion and compartmentalization of sodium are crucial strategies associated with salt stress tolerance ([10]). Those mechanisms prevent Na+ from affecting metabolic activity in leaves, allowing for the maintenance of cell functionality. The exclusion of Na+ from the transpiration flow was studied in P. euphratica ([8], [14]), Populus alba L. ([24]), and other woody and herbaceous species ([53], [29], [19], [52]). However, that phenomenon was poorly addressed in P. deltoides. Therefore, this study aims to identify the sodium accumulation strategies of two P. deltoides commercial clones that have substantial differences in salt-stress symptoms.
Materials and methods
Experimental setup
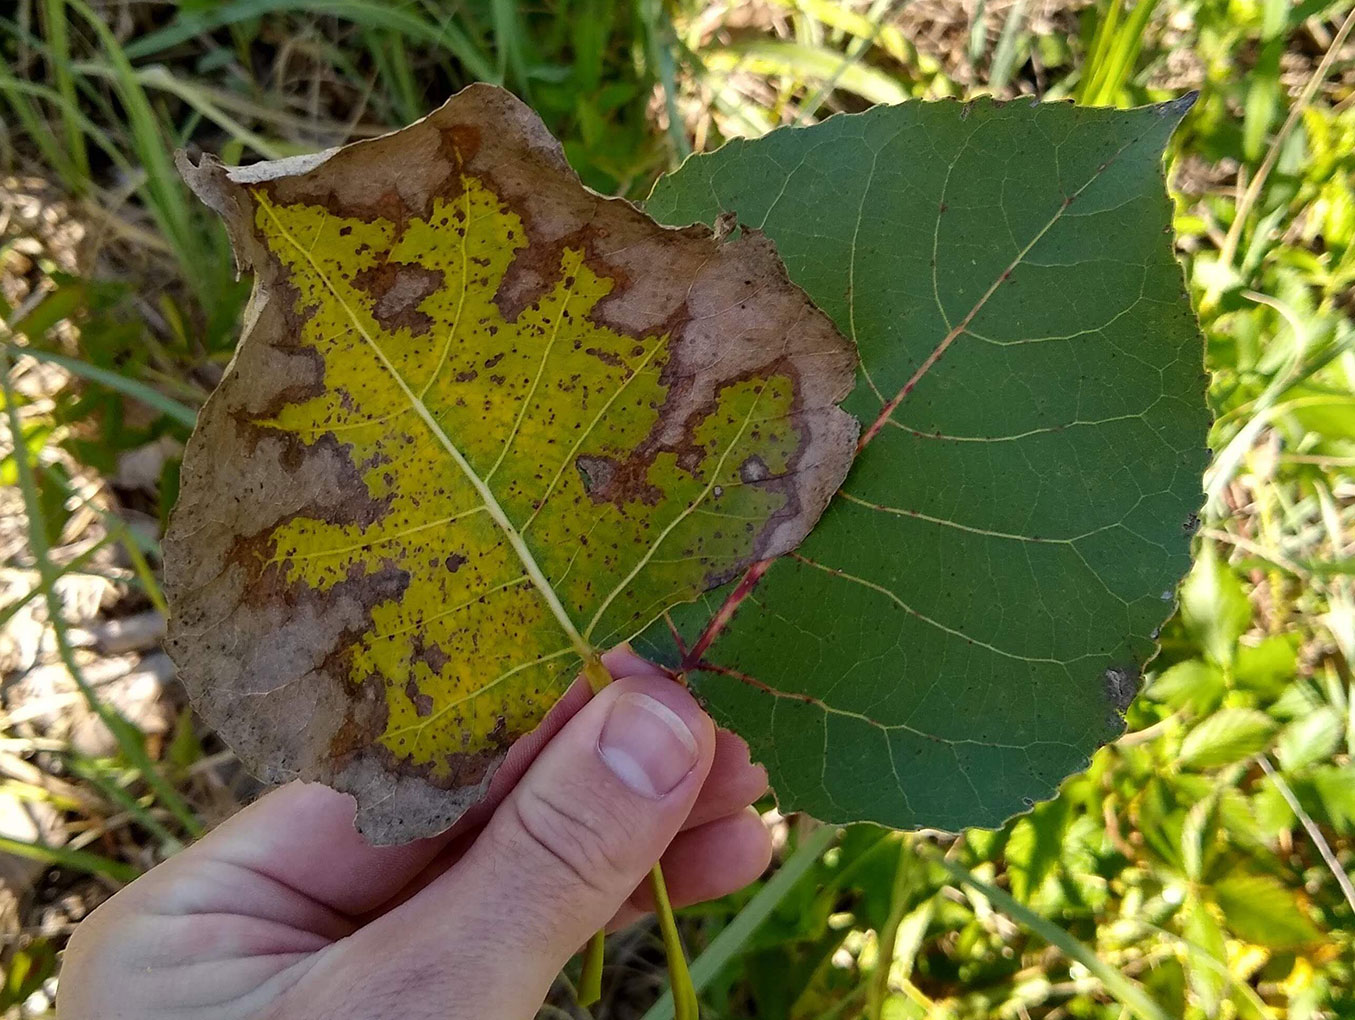
The study was carried out at the facilities of Estación Experimental Agropecuaria Delta del Paraná (INTA), in Campana, Buenos Aires province, Argentina (34° 10′ 34″ S, 58° 51′ 48″ W). Mean annual rainfall is 1019 mm, evenly distributed throughout the year, and the mean annual temperature is 16.5 °C. A silvicultural experiment was established in 2017 to evaluate the development of poplar’s monoclonal and mixed clonal plantations. The experiment consisted of nine plots: three monoclonal plots of P. deltoides ’Australiano 129/60’ (A129) (plot identification: A129a, A129b, and A129c), three monoclonal plots of P. deltoides ’Hovyú INTA’ (HOV) (plot identification: HOVa, HOVb, and HOVc), and three mixed clonal plots where both clones were planted intercalated as a chessboard (plot identification: MIXa, MIXb, and MIXc). Each plot consisted of a square arrangement of 9 × 9 plants with a spacing of 4 × 4 meters (625 trees ha-1). During the third year, symptoms on tree leaves that could be associated with salt stress began, e.g., burned leaf margins and defoliation during the summer ([5]). Furthermore, it was observed that in mixed clonal plots, leaves of A129 were less affected than those of HOV (Fig. 1). That observation led us to investigate the differences in sodium (Na+) absorption and transport between A129 and HOV.
Fig. 1 - Salt-damaged and undamaged leaves of P. deltoides in a mixed clonal stand. The leaf with burned margins is from P. deltoides clone ’Hovyú INTA’, while the undamaged one corresponds to P. deltoides clone ’Australiano 129/60’.
Site characterization
In each plot, a composite soil sample was carried out by combining six subsamples (three along each diagonal transect) of surface soil collected using an 18 cm-deep auger. The resulting nine composite samples were air-dried and used to determine texture and chemical composition at the Laboratorio de Calidad de Alimentos, Suelo y Agua (INTA, Pergamino, Buenos Aires). The analyses included the following variables and methods: soil pH (spH) and electrical conductivity (sEC, dS m-1) were determined on a 1:2.5 soil:deionized water suspension ([43], [51]); total organic carbon (C, g kg-1) was determined using the wet combustion method ([38]); Kjeldahl nitrogen (N, g kg-1) was determined by acid digestion ([6]); extractable phosphorus (eP, mg kg-1) by the Olsen method ([41]); total phosphorus (tP, mg kg-1) by acid digestion and ascorbic acid colorimetry ([49]); exchangeable calcium (Ca, cmol kg-1) and exchangeable magnesium (Mg, cmol kg-1) by complexometric titration ([44]); exchangeable potassium (K, cmol kg-1) and exchangeable sodium (Na, cmol kg-1) by flame photometry ([44]); and cation exchange capacity (CEC, cmol kg-1) by ammonium saturation ([44]).
An observation well was installed in the center of each plot to monitor the water table level and to obtain water samples. Plastic pipes with a 63 mm diameter and a length of 4 m were used for this purpose. The pipes were perforated along the walls and wrapped with a geotextile membrane (Sika Geotextil U-14, Argentina). The geotextile membrane allows water to pass through while preventing the entry of soil particles. The tubes were installed using a manual auger to a 3 m bottom depth in September 2020. The water table level was measured approximately every 30 days. Additionally, water samples were collected at 7 different moments between 2020 and 2021. A 1000 cm3 bailer (Geotech Environment Equipment Inc., United States) was used to obtain water samples. Each water sample was collected in an airtight container and immediately transported to the laboratory for measuring water electrical conductivity (wEC, dS m-1). The wEC was measured using a conductivity meter (Thermo Russell RL060C, United States). Mean and maximum wEC values obtained during the 2020-2021 growing season were calculated (wECmean and wECmax, respectively).
During the installation of the water table observation wells, a soil sample was collected at every 50 cm depth up to a depth of 3 m. Soil samples were air-dried and used to determine soil electrical conductivity (sEC, dS m-1) in a 1:2.5 soil: deionized water suspension ([43]) at the Laboratorio de Calidad de Alimentos, Suelo y Agua (INTA, Pergamino, Buenos Aires). Each soil sample was identified according to the depth from which it was obtained: 0 m (sEC0), 0.5 m (sEC0.5), 1 m (sEC1), 1.5 m (sEC1.5), 2 m (sEC2), 2.5 m (sEC2.5), and 3 m (sEC3). Mean and maximum sEC values across the soil profile were then calculated (sECmean and sECmax, respectively).
Surface soil electrical conductivity estimation
In addition to the general soil characterization, another surface soil sampling was taken to obtain an estimated value of soil electrical conductivity (one for each plant). We prepared a new composite soil sample by combining four subsamples at each plot’s vertices. The electrical conductivity of each composite soil sample was determined using a conductivity meter (Thermo Russell RL060C, USA) in a soil: water suspension with a 1:2.5 ratio ([43]). An average of 2 replicates per sample was recorded. From the values at each vertex, the electrical conductivity gradient between plants was estimated by interpolation across and along each plot’s width and length. In this way, estimated electrical conductivity (eEC, dS m-1) data were estimated for the surface soil at 4-meter intervals (one for each plant). Thus, we obtained 81 eEC values per plot (9 × 9 plants). The mean estimated electrical conductivity (eECmean) was calculated for each plot.
Plant material selection
In 2021, five plants of each clone were selected in both monoclonal and mixed clonal plots (30 plants of A129 and 30 plants of HOV). The chosen plants had at least 6 alive plants out of the 8 neighboring plants and exhibited good form, with a main stem without bifurcations and leaves without visible damage from pests or diseases. We sampled 60 plants: 15 plants in HOV monoclonal plots (five plants per plot), 15 plants in A129 monoclonal plots (five plants per plot), and 15 plants of each clone in mixed plots (five plants of each clone per plot). In these plants, growth and cation concentrations were measured, as described in the following sections.
Growth
Height (H, m) and diameter at breast height (DBH, cm) of the plants were measured in the 2021 winter (before the growing season began) and in the 2022 autumn (after the growth stopped). DBH was measured using a diameter tape (Lufkin Executive W606PM, USA) at a height of 1.3 m above ground. H was measured with a hypsometer and a transponder T3 (Vertex III, Haglöf Inc., Sweden). The increments in H (H2021-2022, m) and DBH (DBH2021-2022) from 2021 winter to 2022 autumn were calculated for each plant.
Na+ and other cation concentrations in roots, branches, and leaves
The concentration of sodium ([Na+]), ammonium ([NH4+]), potassium ([K+]), magnesium ([Mg2+]), and calcium ([Ca2+]) was determined in the roots, branches, and leaves of every plant. Samples from all three compartments were collected simultaneously in November 2021. Roots were collected from two sectors on both sides of each plant, positioned 50 cm from the main stem and not deeper than 30 cm into the soil. Alive, functionally active roots with a 1 cm maximum thickness were included. The roots were washed thoroughly with distilled water to remove all remaining soil. Branch samples were collected from two main branches of each plant, one from the lower half and another from the upper half of the canopy. Leaves were harvested from the same sampled branches. All samples were dried at 60 °C until they reached a constant weight. Composite samples were made from the dry matter of each compartment (one per plant). Each composite sample was finely ground. The concentration of each cation was determined using high-performance liquid chromatography (HPLC) by the Instituto de Fisiología y Recursos Genéticos Vegetales (IFRGV, CIAP-INTA, Córdoba, Argentina), as described by Cataldi et al. ([7]) and Munns et al. ([37]). For the statistical analyses, the sum of [NH4+], [K+], [Mg2+], and [Ca2+] was defined as “cation concentration” ([cations], µmol g-1). [Na+] was expressed both in µmol g-1 (micromoles of the cation per gram of dry matter) and mg g-1 (milligrams of sodium per gram of dry matter).
Statistical analyses
The Pearson’s coefficient (r) was used to analyze the correlation between water table electrical conductivities (wECa and wECmax) and soil electrical conductivities (sEC0, sEC0.5, sEC1, sEC1.5, sEC2, sEC2.5, sEC3, sECa, and sECmax), as well as between sEC0 and eEC.
Mixed linear models (p ≤ 0.05) were employed in [Na+] and [cations] analyses, with clone (A129 and HOV) as a fixed effect and plot as a random effect.
Linear regression analyses were performed between the [Na+] in biomass compartments and eEC. One linear regression was performed for each compartment (roots, branches, and leaves) and each clone. Linear regression analyses among the [Na+] of roots, branches, and leaves for each clone were also made. Finally, linear regression analyses were done between the [Na+] in leaves and the increments in H and DBH (H2021-2022 and DBH2021-2022); and between the [cations] in leaves and the increments in H and DBH (H2021-2022 and DBH2021-2022). Those regressions with a p-value ≤ 0.05 were considered statistically significant. In case the regressions were significant for both clones, the slopes of each regression were compared using the dummy variable methodology ([2]) to determine if the slopes were statistically different.
Results
Soil and water table analyses
A positive correlation was observed between the surface soil electrical conductivity (sEC0) and the mean water table electrical conductivity (wECmean) registered in 2020-2021. The wECmean also correlated positively with the 2.5 m depth soil electrical conductivity (sEC2.5). In addition, the maximum electrical conductivity in the water table (wECmax) was found to positively correlate with sEC2.5 and sECmean (Tab. 1). Moreover, it was observed that the sEC0 of each plot had a strong positive correlation with the mean estimated soil electrical conductivity obtained by interpolation (eECmean - r = 0.87, p = 0.002). Soil texture and chemical analyses of each plot are shown in Tab. S1 (Supplementary material).
Tab. 1 - Pearson’s correlation coefficient (r) between water table electrical conductivity (wECmean and wECmax) and soil electrical conductivity from 0 to 3 m depth (sEC0, sEC0.5, sEC1, sEC1.5, sEC2, sEC2.5, and sEC3). Mean and maximum sEC (sECmean and sECmax) were included, too. (*): p ≤0.05; (**): p <0.01.
| r | wECmean | wECmax |
|---|---|---|
| sEC0 | 0.71* | 0.63 |
| sEC0.5 | 0.02 | -0.06 |
| sEC1 | 0.53 | 0.61 |
| sEC1.5 | 0.57 | 0.56 |
| sEC2 | 0.62 | 0.61 |
| sEC2.5 | 0.82** | 0.83** |
| sEC3 | 0.63 | 0.73* |
| sECmean | 0.83** | 0.84** |
| sECmax | 0.39 | 0.35 |
The soil electrical conductivity range was similar for both clones. The eEC varied between 0.37 and 1.35 dS m-1 for A129 plants, and between 0.37 and 1.25 dS m-1 for HOV plants.
Na+ and cation concentrations
The two clones did not show significant differences in the [cations] in roots, branches, or leaves. The sum of NH4+, K+, Mg2+, and Ca2+ in each compartment was similar in both genotypes. The [cations] in roots ranged from 70 to 275 µmol g-1 in A129 and from 67 to 237 µmol g-1 in HOV (F = 0.01, p = 0.92). The [cations] in branches and leaves were also similar in both clonesranging from 49 to 212 µmol g-1 in A129 and from 78 to 176 µmol g-1 in HOV (F = 0.02, p = 0.89). The leaves were the compartment with higher [cations] in both clones, which ranged from 432 to 853 µmol g-1 in A129, and from 393 to 972 µmol g-1 in HOV (F = 0.76, p = 0.39 - Fig. 2).
Fig. 2 - Box plots of sodium concentration ([Na+], µmol g-1) in (a) leaves, (b) branches and (c) roots; and box plots of the sum of the cations NH4+, K+, Mg2+, and Ca2+ ([cations], µmol g-1) in (d) leaves, (e) branches and (f) roots. The blue box plots represent P. deltoides ’Australiano 129/60’ (A129), while the green box plots represent P. deltoides ’Hovyú INTA’(HOV). To highlight the concentration differences among compartments for each clone, the same scale is maintained on the y-axis for both [Na+] and [cations]. Compartments with significant differences between clones (p ≤ 0.05) are marked with a red asterisk.
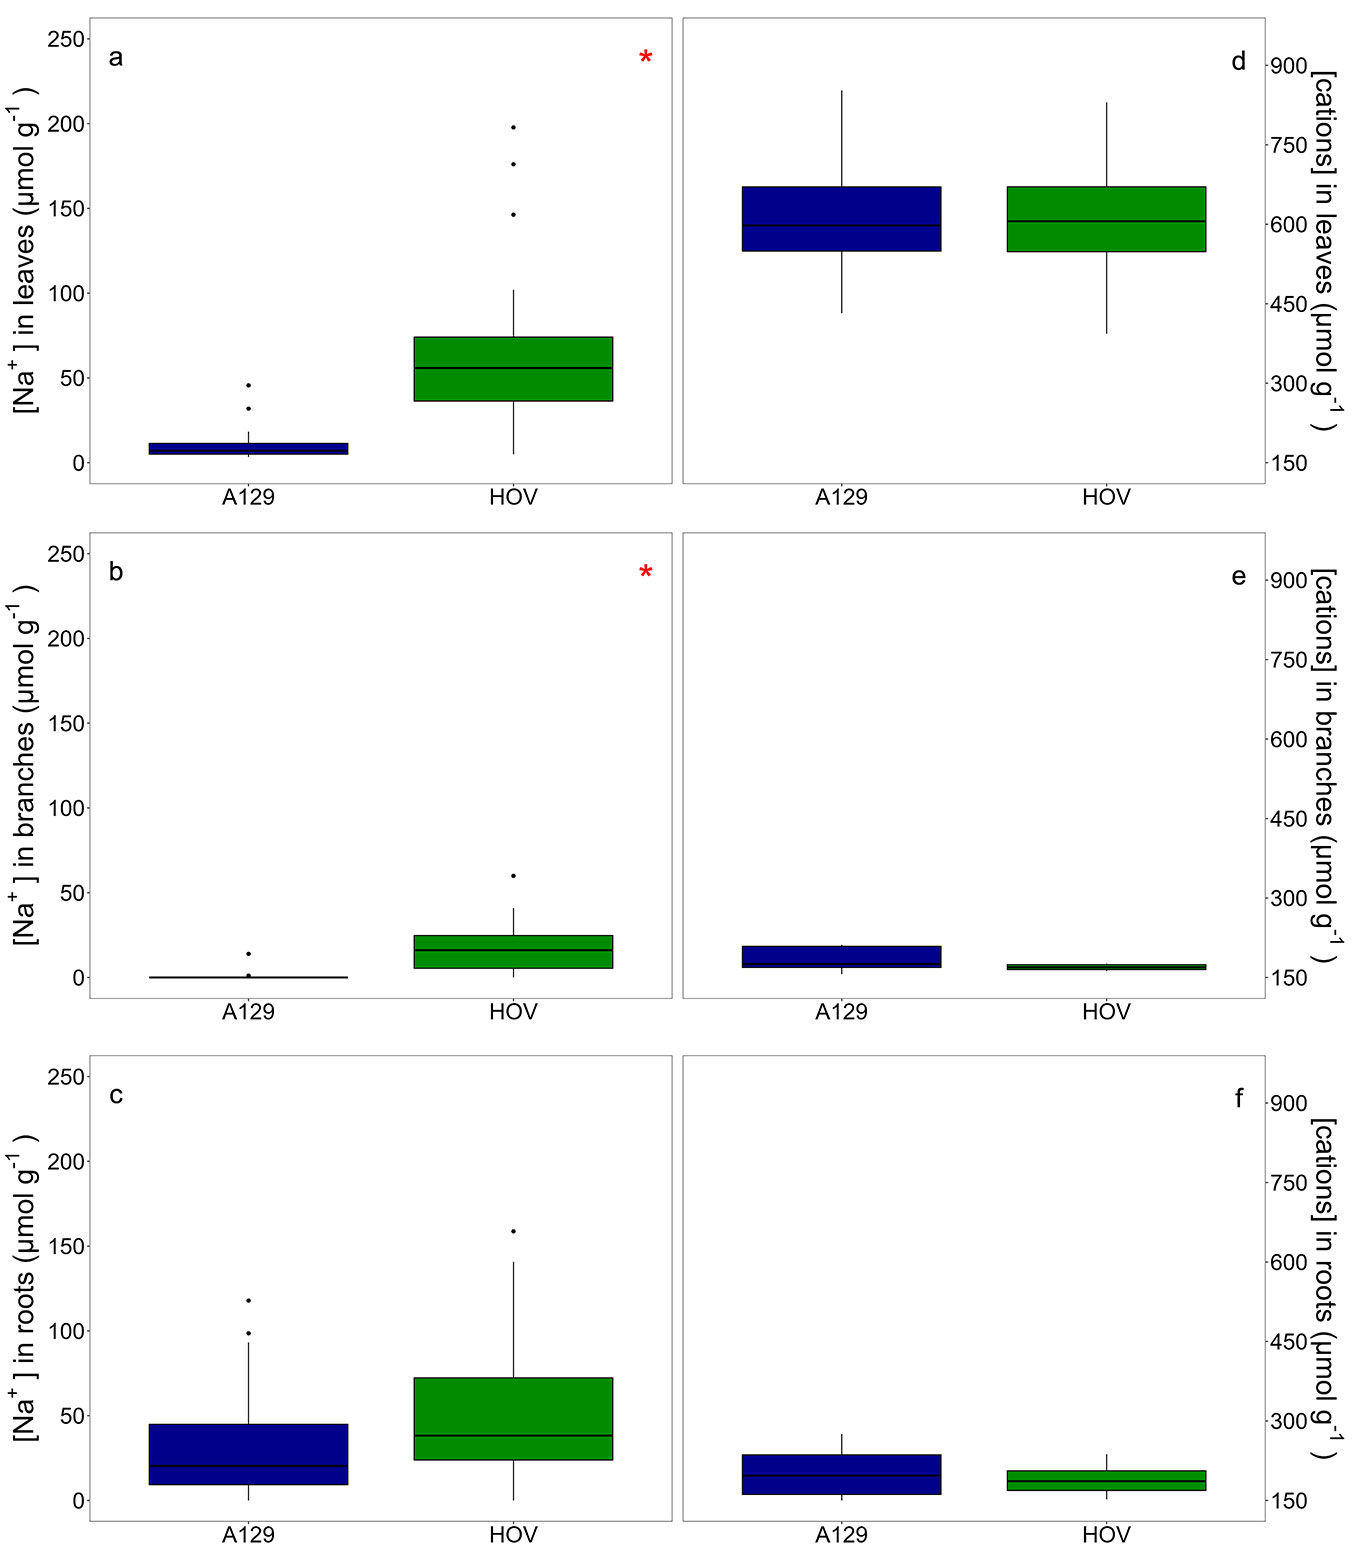
The [Na+] in roots was similar in A129 and HOV plants. Although HOV had a 60% higher [Na+] in roots than A129, the differences were not statistically significant (F = 1.05, p = 0.31). The range of [Na+] in roots was from 0.01 to 159 µmol g-1 for HOV and 0.01 to 118 µmol g-1 for A129 (Fig. 2). It is important to note that when only plants from mixed plots were analyzed, the trend remains the same (mixed clonal plots: F = 0.79, p = 0.38).
Differences between A129 and HOV were recorded in [Na+] for branches and leaves. Firstly, it was observed that while A129 had [Na+] in branches practically imperceptible for the measurement method, HOV had [Na+] in branches higher than 50 µmol g-1 ([Na+] in branches (µmol g-1): A129 = 0.6; HOV = 17.4; F = 27.92, p ≤0.001 - Fig. 2). Secondly, it was detected a large difference between A129 and HOV in [Na+] in leaves. The values of [Na+] in leaves ranged from 3 to 46 µmol g-1 in A129 and from 5 to 292 µmol g-1 in HOV ([Na+] in leaves (µmol g-1): A129 = 10.0; HOV = 72.0; F = 22.98, p <0.0001 - Fig. 2). These differences between clones in [Na+] in branches and leaves remain similar when only plants from mixed clonal plots were analyzed (mixed clonal plots, [Na+] in branches (µmol g-1): A129 = 1.05; HOV = 15.0; F = 13.57, p = 0.001; [Na+] in leaves (µmol g-1): A129 = 12.7; HOV = 69.0; F = 10.31, p = 0.004).
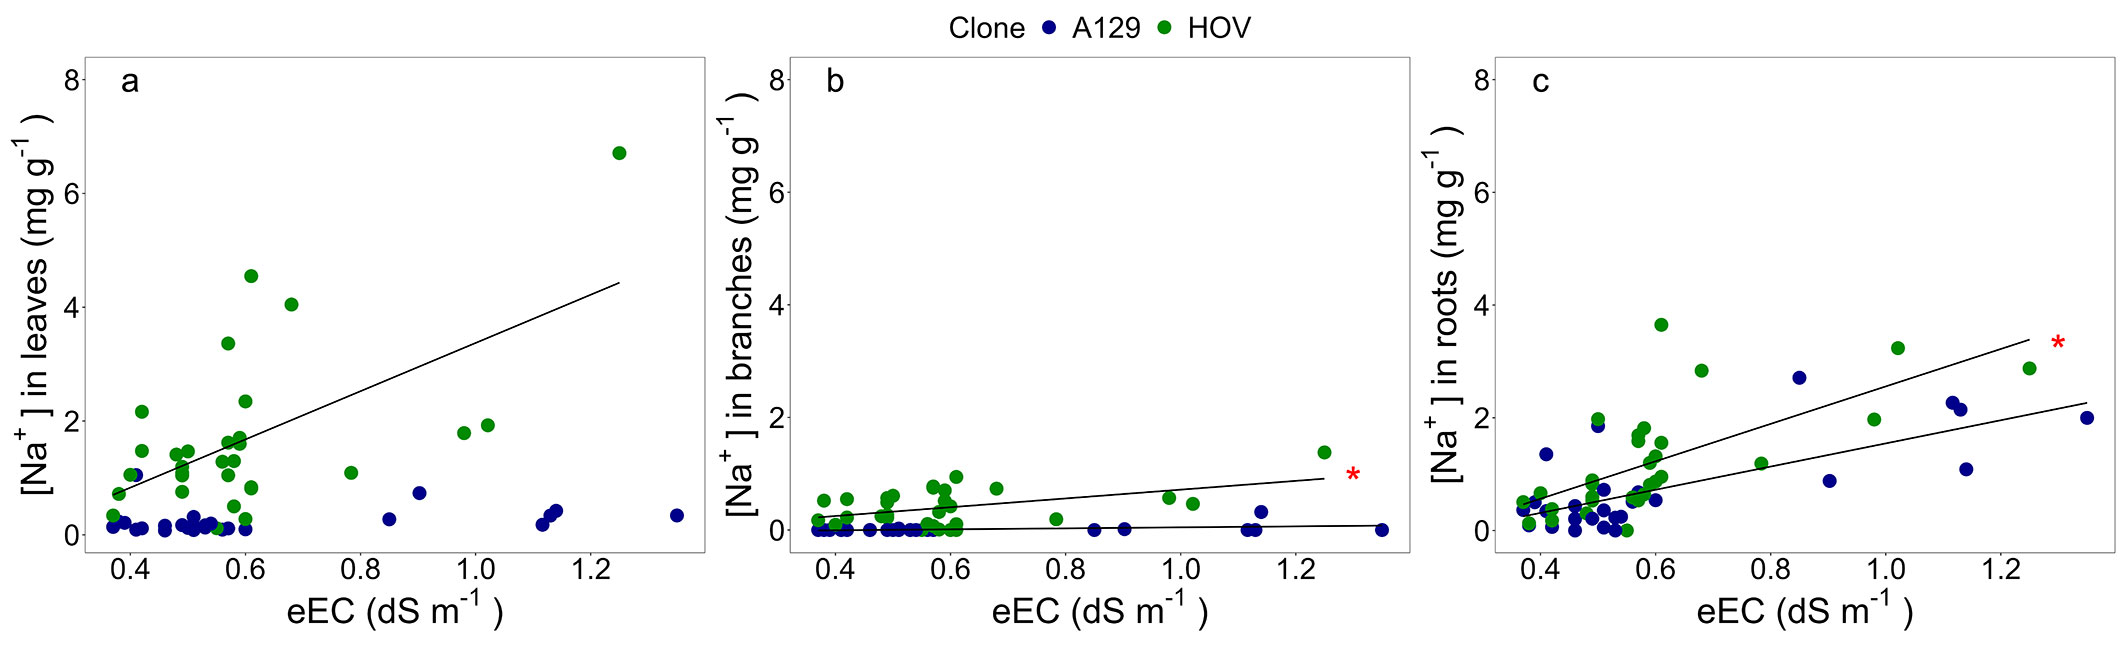
The [Na+] in roots increased with increasing eEC in both clones. However, the slope of the relation between [Na+] in roots and eEC in soil was significantly higher in HOV than in A129 (T = 8.59, p <0.0001). It was also observed that the relationship between the [Na+] in branches and leaves with the eEC differed between genotypes. On the one hand, A129 had a lower slope [Na+] in branches vs. eEC than HOV (T = 40.47, p <0.0001 - Fig. 3). On the other hand, while A129 had [Na+] in leaves close to zero, HOV had a higher [Na+] in leaves with higher soil salinity. In summary, HOV accumulated a similar or even lower sodium amount in branches than in roots, but the [Na+] substantially increased in leaves (Fig. 3).
Fig. 3 - Linear regression analyses between the estimated soil electrical conductivity (eEC, dS m-1) and the sodium concentration ([Na+], mg g-1) in (a) leaves, (b) branches, and (c) roots. One linear regression was fitted for each clone and each compartment. In cases where the linear regression was significant (p ≤ 0.05) for both clones, the one with the larger slope was marked with a red asterisk. The linear model, R2, and p-value of each regression are reported in Tab. S2 (Supplementary material).
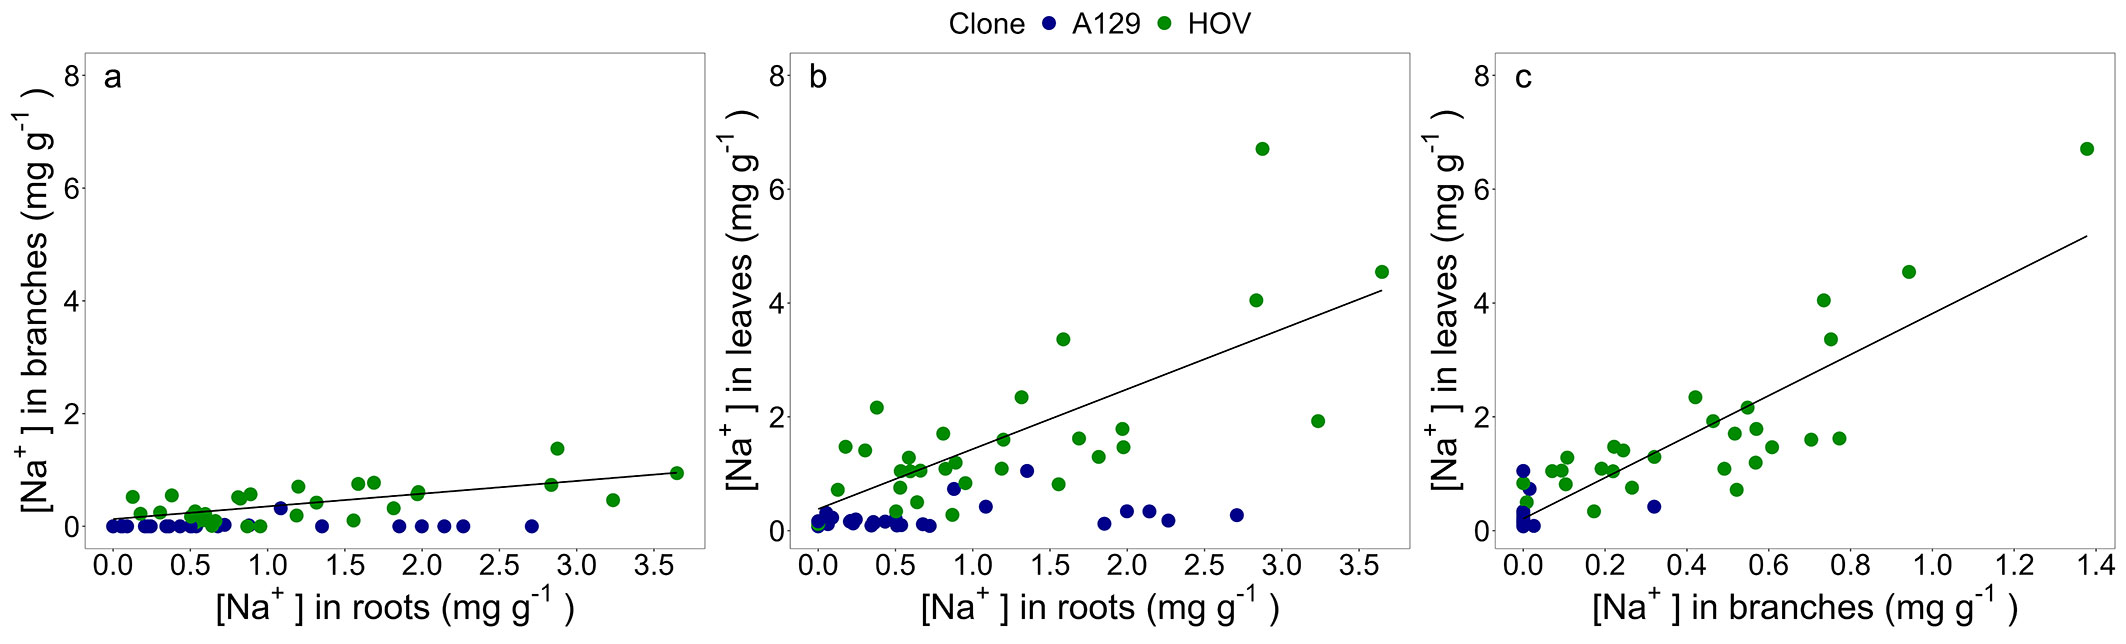
The differences between A129 and HOV with respect to Na+ accumulation were also verified when the relationship of the [Na+] among compartments was analyzed. The [Na+] in the aboveground biomass compartments of A129 did not show any relation with the [Na+] in roots (Fig. 4a, Fig. 4b). In contrast, the [Na+] in branches and leaves of HOV showed a positive relation with that recorded in roots (Fig. 4a, Fig. 4b). It was also detected that the [Na+] in leaves of HOV positively correlated with the [Na+] in branches (Fig. 4c).
Fig. 4 - Linear regression analyses between (a) sodium concentration ([Na+], mg g-1) in roots and [Na+] in branches; (b) [Na+] in roots and [Na+] in leaves; and (c) [Na+] in branches and [Na+] in leaves. A linear regression was fitted for each clone. Linear model, R2, and p-value of each regression are reported in Tab. S2 (Supplementary material).
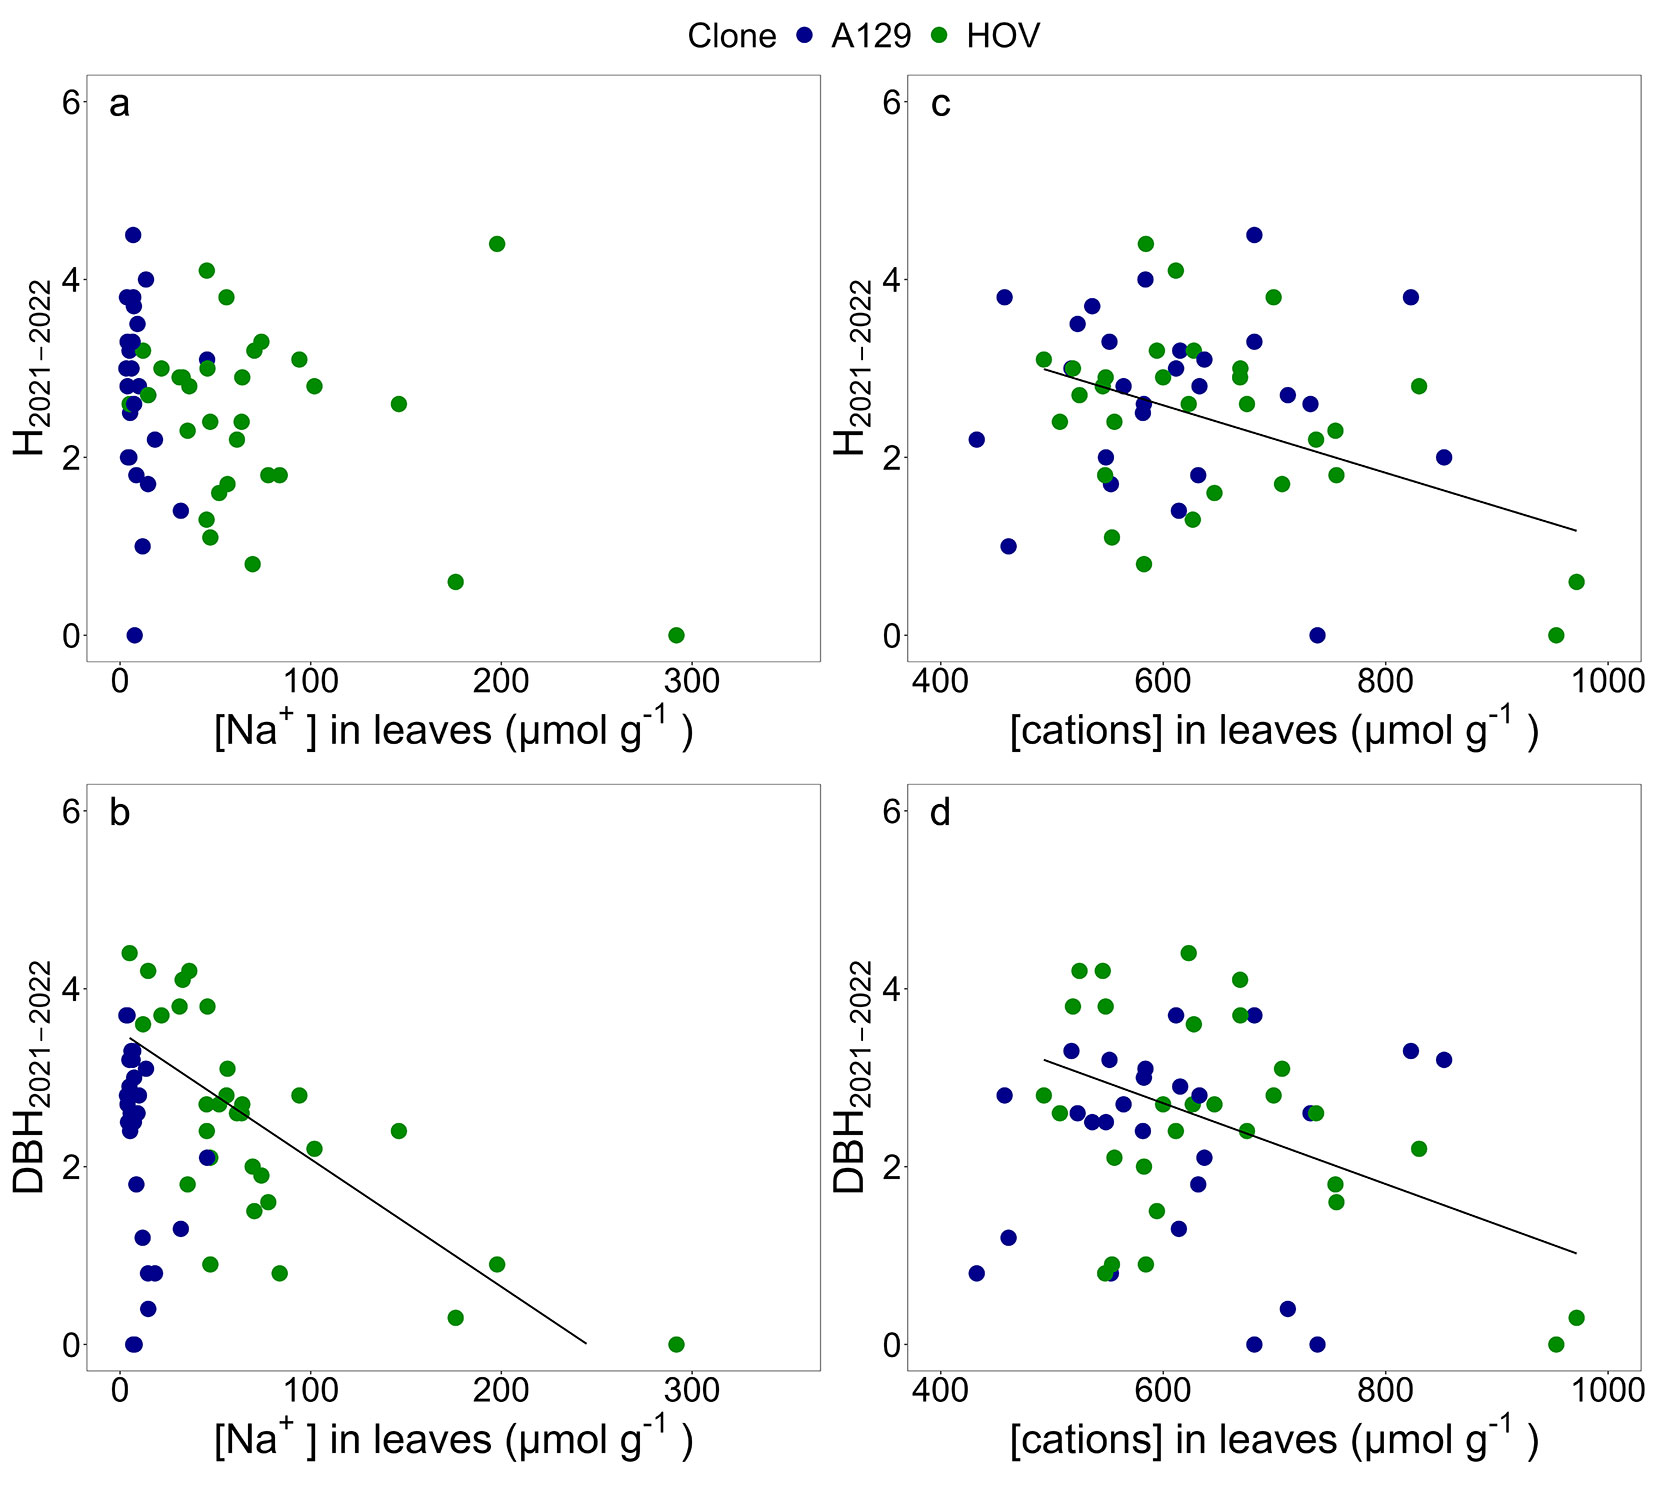
The relations between [Na+] and [cations] in leaves with growth increments were also analyzed (Fig. 5). It was observed that the plants of HOV clone with larger amounts of cations in leaves were those with lower H2021-2022 (Fig. 5c) and DBH2021-2022 (Fig. 5d). The relations between [Na+] and the growth increments in height and DBH were not statically significant for A129. In turn, a strong negative relation was identified between the [Na+] in leaves of HOV and the DBH2021-2022 (Fig. 5a, Fig. 5b).
Fig. 5 - Linear regression analyses between (a) sodium concentration ([Na+], µmol g-1) in leaves and height increment (H2021-2022, m); (b) [Na+] in leaves and DBH increments (DBH2021-2022); (c) cations concentration ([cations], µmol g-1) in leaves and H2021-2022; and (d) [cations] in leaves and DBH2021-2022. Height and DBH increments refer to the tree’s growth from the 2021 winter to the 2022 autumn. A linear regression was fitted for each clone. Linear model, R2, and p-value of each regression are reported in Tab. S2 (Supplementary material).
Discussion
Saline soils are usually defined as those with an electrical conductivity greater than 4 dS m-1 ([46]). Thus, the salinity levels of the water table and the soil in the Delta del Río Paraná are relatively low. However, salinity symptoms are observed in Populus spp. in some areas, especially during dry years and in the center of forest stands. Those symptoms were consistent with similar leaf damage reported for other Salicaceae ([5]).
Salinization processes in soils may be associated with various factors. On the one hand, there is evidence of the presence of salts in deep soil horizons resulting from ancient marine incursions in the Delta del Río Paraná ([40]). Another determining factor is the previous land use history. In this study, the plantation site has been forested with poplars for several years. Those repeated forest cycles could have led to a salt concentration process in the soil near the roots. This salinization process may be equivalent to that observed when natural grasslands are replaced by forests ([26], [39]). Additionally, the quantity and spatial distribution of channels and ditches in the field are other factors that influence the dynamics of salts at the study site ([27]). It is important to highlight that groundwater plays a crucial role in the distribution of salinity at both local and regional scales ([45]). Particularly in this study, it is important to note that the salinity gradient was observed at the micro-sites scale (e.g., EC variability between and within plots). At both regional and micro-site scales, variability is typical in the region due to geographic and geomorphological differences across the wetland ([40], [12]). Microsite-scale heterogeneity is common in several other regions and different croplands, and it has been reported to influence crop yields and soil properties ([3], [57], [15], [55]).
In the present study, a positive relationship was identified between soil EC and water table EC. Measuring the surface soil EC can be a good indicator of salt presence in depth and a useful indirect estimator of the water table EC. This method is consistent with previous research. For example, Losinno et al. ([31]) found that when the water table is closer to the surface, the effect on soil salinization is greater, while Hu et al. ([23]) observed that the salt content of surface soil horizons is positively correlated with groundwater depth. Moreover, Ali et al. ([1]) reported a high relationship between the salinity of the soil, the water table, and the groundwater.
The high concentration of salt in the soil significantly limits the establishment and growth of poplars. However, differences among clones can be identified due to the large intra-specific genetic diversity of poplar species ([13], [22]). In this regard, we observed that sodium enters the roots in both clones. It is generally assumed that uptake of Na+ into the roots occurs through the symplastic pathway. The presence of suberin and the Casparian strip serves as a physical barrier that prevent Na+ and other elements from accessing tissues through the apoplastic pathway ([50], [17]). However, in young or underdeveloped roots, these structures may be absent or less efficient ([33]). We observed no differences in ion exclusion at the root level between A129 and HOV, as the Na+ concentration in the roots is similar for both clones. However, we identified that with the increase in soil EC, HOV had a higher rate of Na+ increment in the roots than A129 (Fig. 3c). The accumulation of Na+ in roots after applying salinity treatments was verified in previous studies of Populus alba L. ([24], [11]).
The differences found in Na+ concentration in aboveground tissues suggest that A129 can prevent Na+ from reaching the branches and leaves, and this exclusion is ion-specific, as the other cations analyzed had similar concentrations in both clones (Fig. 2). This clone likely extrudes Na+ cations out of the xylem in the main stem ([10], [16]), removing them from the transpiration flow. This mechanism is crucial since the amount transported to the leaves depends on the ion concentration and transpiration flow ([46]). The compartmentalization and recirculation of Na+, to prevent it from accumulating in key organs, have been highlighted as a fundamental strategy for salt tolerance in different poplar species ([4], [53], [54]), apple ([52]), pistachio ([19]), and herbaceous plants ([29]). Additionally, this strategy was described in one of the most salt-tolerant poplar species, P. euphratica, in contrast to more sensitive species such as P. popularis and P. × euroamericana ([8], [14]). Moreover, Chen et al. ([9]) highlighted the ability of P. euphratica to block the apoplastic pathway of ion transport, while Imada et al. ([24]) have pointed out the importance of Ca2+ in the exclusion of Na+ at the membrane cell level. Further, Ding et al. ([14]) indicated that P. euphratica copes with salinity stress by maintaining the K+/Na+ balance through the Na+/H+ antiporter activity. These mechanisms are essential for determining salinity tolerance, although their effectiveness is directly related to the level of stress to which the plants are subjected ([24]). On the other hand, it is also important to consider that the anion Cl- is relevant in the induction of salinity stress due to its toxicity when it accumulates in the leaf tissue ([28]). For that reason, the exclusion of Cl- is an important mechanism that must be included in future studies.
Although P. deltoides is not comparable to P. euphratica in salt tolerance, the mechanism underlying the differences between A129 and HOV could be similar to that described above. In this regard, reports exist on poplar species with varying degrees of stress tolerance among clones ([48], [11]). If A129 can exclude Na+ from the transpiration flow, it is likely to be through an equivalent process (exclusion and accumulation in other organs). This is possible because the main mechanisms by which plants cope with salt excess have been reported to be conserved among different herbaceous and woody species ([32]). On the other hand, HOV had even higher concentrations in leaves than in roots, suggesting that HOV clone does not employ this strategy, or at least it is not effective in facing the salt levels found at the site.
Conclusions
Salt stress in Populus deltoides is less frequently studied than that carried out with other poplar species (e.g., P. euphratica or P. alba). The results presented in this study provide important insights into P. deltoides responses to salinity and its intra-specific variability. It constitutes one of the few reports of P. deltoides on salt stress.
Clone A129 can prevent Na+ from reaching the leaves, while clone HOV has extreme foliar damage due to the ion-toxicity effect. Nevertheless, it is important to note that the capacity of A129 does not render it a tolerant clone, though it does confer an advantage within the species. The identification of clonal differences in the sodium dynamics is a relevant aspect. The variability among clones is crucial for coping with abiotic stresses in the field. Thus, poplar growers and breeders will both have more information at the moment of the plantation and selection process.
Finally, it is necessary to further examine the ion uptake and transport to better understand how clone A129 can avoid the accumulation of Na+ in the leaves. It is also relevant to evaluate the role of chloride in salt-induced symptoms.
Acknowledgements
We would like to thank the E.E.A. Delta del Paraná staff for their valuable contributions in the setup, measuring, and maintenance of the experiment. SMB received CONICET-INTA Co-funded Doctoral Fellowships, Argentina. This research was funded by INTA, Argentina, through the project 2019-PE-E1-I016-001 (JAA), by CONICET, Argentina, through the project PIP no. 112-201701-00392 (CG), and by the Agencia I+D+i, Argentina, through the project PICT 2017-1424 (LIF).
Authors’ contributions
Conceptualization: SMB, JAA, CG; methodology: SMB, JAA, CG; collection of data: SMB, LIF, JAA; data analysis: SMB, LIF, JAA, CG; writing - original draft preparation: SMB, CG; writing - review and editing: SMB, LIF, JAA, CG; funding acquisition: JAA, LIF, CG; supervision: JAA, CG.
References
CrossRef | Gscholar
Online | Gscholar
CrossRef | Gscholar
CrossRef | Gscholar
Online | Gscholar
CrossRef | Gscholar
Online | Gscholar
CrossRef | Gscholar
Authors’ Info
Authors’ Affiliation
Javier Alejandro Alvarez 0000-0003-3442-2925
Laura Inés Faustino 0000-0002-5118-3607
Instituto Nacional de Tecnología Agropecuaria (INTA), Estación Experimental Agropecuaria Delta del Paraná, Río Paraná de las Palmas y Canal Laurentino Comas, 4ta Sección de Islas, 2804 Campana, Provincia de Buenos Aires (Argentina)
Consejo Nacional de Investigaciones Científicas y Técnicas (CONICET), Instituto de Fisiología Vegetal (INFIVE), Diagonal 113 y calle 61, 1900 La Plata, Provincia de Buenos Aires (Argentina)
Facultad de Ciencias Agrarias y Forestales, Universidad Nacional de La Plata, Avenida 60 y 118, 1900 La Plata, Provincia de Buenos Aires (Argentina)
Corresponding author
Paper Info
Citation
Bonnin SM, Alvarez JA, Faustino LI, Graciano C (2025). Two Populus deltoides W.Bartram ex Marshall clones cope differentially with sodium salinity stress. iForest 18: 259-266. - doi: 10.3832/ifor4783-018
Academic Editor
Werther Guidi Nissim
Paper history
Received: Dec 30, 2024
Accepted: May 03, 2025
First online: Oct 10, 2025
Publication Date: Oct 31, 2025
Publication Time: 5.33 months
Copyright Information
© SISEF - The Italian Society of Silviculture and Forest Ecology 2025
Open Access
This article is distributed under the terms of the Creative Commons Attribution-Non Commercial 4.0 International (https://creativecommons.org/licenses/by-nc/4.0/), which permits unrestricted use, distribution, and reproduction in any medium, provided you give appropriate credit to the original author(s) and the source, provide a link to the Creative Commons license, and indicate if changes were made.

Web Metrics
Breakdown by View Type
Article Usage
Total Article Views: 4157
(from publication date up to now)
Breakdown by View Type
HTML Page Views: 1638
Abstract Page Views: 1363
PDF Downloads: 975
Citation/Reference Downloads: 0
XML Downloads: 181
Web Metrics
Days since publication: 275
Overall contacts: 4157
Avg. contacts per week: 105.81
Article Citations
Article citations are based on data periodically collected from the Clarivate Web of Science web site
(last update: Mar 2025)
(No citations were found up to date. Please come back later)
Publication Metrics
by Dimensions ©
Articles citing this article
List of the papers citing this article based on CrossRef Cited-by.
Related Contents
iForest Similar Articles
Research Articles
Salinity strongly drives the survival, growth, leaf demography, and nutrient partitioning in seedlings of Xylocarpus granatum J. König
vol. 10, pp. 851-856 (online: 26 October 2017)
Research Articles
Assessment of cadmium tolerance and phytoextraction ability in young Populus deltoides L. and Populus × euramericana plants through morpho-anatomical and physiological responses to growth in cadmium enriched soil
vol. 10, pp. 635-644 (online: 01 June 2017)
Research Articles
Pre-treatment with sodium silicate, sodium hydroxide, ionic liquids or methacrylate resin to reduce the set-recovery and increase the hardness of surface-densified Scots pine
vol. 10, pp. 857-864 (online: 26 October 2017)
Research Articles
Links between phenology and ecophysiology in a European beech forest
vol. 8, pp. 438-447 (online: 15 December 2014)
Research Articles
Tree aging does not affect the ranking for water use efficiency recorded from δ13C in three Populus deltoides × P. nigra genotypes
vol. 12, pp. 272-278 (online: 21 May 2019)
Research Articles
Species-specific morphological and physiological characteristics and progressive nitrogen limitation under elevated CO2 concentration
vol. 13, pp. 270-278 (online: 03 July 2020)
Research Articles
Sodium and potassium allocation under drought stress in Atlas mastic tree (Pistacia atlantica subsp. mutica)
vol. 6, pp. 90-94 (online: 07 February 2013)
Research Articles
Use of δ13C as water stress indicator and potential silvicultural decision support tool in Pinus radiata stand management in South Africa
vol. 12, pp. 51-60 (online: 24 January 2019)
Research Articles
Effect of salt and drought on growth, physiological and biochemical responses of two Tamarix species
vol. 8, pp. 772-779 (online: 25 March 2015)
Research Articles
Intra-annual tree growth responds to micrometeorological variability in the central Amazon
vol. 14, pp. 242-249 (online: 21 May 2021)
iForest Database Search
Search By Author
Search By Keyword
Google Scholar Search
Citing Articles
Search By Author
Search By Keywords
PubMed Search
Search By Author
Search By Keyword


