Species-specific morphological and physiological characteristics and progressive nitrogen limitation under elevated CO2 concentration
iForest - Biogeosciences and Forestry, Volume 13, Issue 4, Pages 270-278 (2020)
doi: https://doi.org/10.3832/ifor3288-013
Published: Jul 03, 2020 - Copyright © 2020 SISEF
Research Articles
Abstract
Elevated atmospheric CO2 (eCO2) concentration initially enhances photosynthesis, growth and ecosystem productivity, but the excessive use of nitrogen due to the increased productivity causes uncertainty in long-term ecosystem responses. We exposed Korean red pine, Chinese ash, and Korean mountain ash to current atmospheric CO2 concentration (aCO2), 1.4 times higher CO2 concentration (eCO21.4), and 1.8 times higher CO2 concentration (eCO21.8) in an Open-Top Chamber (OTC) experiment for eight years (2010-2017) to investigate the effect on the morphological and physiological properties of trees. We also assessed whether nitrogen limitation occurred with time by comparing leaf and soil nitrogen concentration. CO2 fertilization effect was observed on tree growth for the first two years (p < 0.05), but there was no difference thereafter. For photosynthetic properties, CO2 effects were species-specific; no effects on Korean red pine and Chinese ash vs. significant effect on Korean mountain ash. However, maximum photosynthetic and carboxylation rates significantly decreased by 24.3% and 31.3% from 2013 to 2017, respectively. Leaf nitrogen significantly decreased by 21.0 % at eCO21.4 and 18.5 % at eCO21.8 compared with aCO2 treatment. This study showed the decline of leaf nitrogen and species-specific responses to long-term high CO2 concentration, which will effect on species competition and ecosystem succession.
Keywords
Elevated CO2, Photosynthetic Properties, Down-regulation, Progressive Nitrogen Limitation, Carbon dioxide
Introduction
Elevated CO2 concentration has become a common phenomenon in the Earth’s atmosphere over the last half-century ([20]). The indiscreet use of fossil fuels and deforestation has raised the atmospheric CO2 concentration, thus promoting photosynthesis and growth ([9], [1], [40]) and affecting the productivity of plants ([29], [32]), which is referred to as the CO2 fertilization effect ([32]). However, there are conflicting opinions on whether such an effect will continue with increasing CO2 concentration ([19]). In general, the productivity of terrestrial ecosystems is affected by nutrient availability in the soil ([46]). It should be taken into account that, if CO2 fertilization promotes plant growth, the excessive nutrient use will result in insufficient nutrients in the soil, failing to meet the nutrient requirements needed for plant growth ([19], [51]) and decreasing the CO2 fertilization effect. Therefore, the expected increase of ecosystem productivity and carbon storage due to CO2 fertilization is still uncertain ([46]).
Early studies using pots and growth chambers hardly reflected the real forest ecosystem conditions ([7], [32]), therefore experiments with Open-Top chamber (OTC) and Free Air CO2 Enrichment (FACE) techniques have been widely employed ([32]). Many OTC and FACE experiments reported an increased growth and photosynthesis under elevated CO2 ([18], [45]). However, whether these effects would last for a long time is questioned. In particular, experiments on elevated CO2 and soil nitrogen fertilization ([13]), which were conducted at the Duke-FACE and Oak Ridge-FACE, confirmed that nitrogen can directly limit the increase in forest productivity due to the carbon fertilization response, highlighting the relevance of nitrogen on forest productivity.
Nitrogen is an important component of plant photosynthetic organs and of functional and structural proteins ([21]). In particular, nitrogen in the leaves constitutes the photosynthetic enzymes, such as chlorophyll and rubisco (ribulose-1.5-biphosphate carboxylase/oxygenase), which determines the maximum carboxylation rate (VCmax - [27], [17]), with a decisive influence on forest productivity ([14], [15]). However, owing to increased productivity by long-term exposure to a high CO2 concentrations, the consumption of nutrients may overcome the nutrients input, leading to a reduction in effective nutrients in the soil, and consequently to a reduction of plants’ photosynthesis ability. In particular, as the nitrogen concentration absorbed by plants decreases, its concentration in the leaves is lowered, thus decreasing photosynthesis. This in turn results in a progressive nitrogen limitation (PNL), which offsets the CO2 fertilization effect ([9], [26], [4]). This phenomenon is more common under nitrogen deficiency in the soil ([35], [29]).
Under PNL, an increase in productivity due to the CO2 fertilization effect is a short-term phenomenon, whereas in the long term, the ecosystem productivity might decrease again and return to its original state ([26], [13]). This suggests that increased forest productivity due to a high atmospheric concentration of CO2 might be inhibited by soil nitrogen deficiency ([12]). Reich et al. ([37]) and Feng et al. ([12]) confirmed that the response of plants to CO2 fertilization was limited by nitrogen deficiency. Moreover, PNL is expected to be more prominent when the high CO2 concentration environment is maintained for a long time ([39]).
The main objective of this study was to determine the occurrence of nitrogen limitation under long-term CO2 fertilization on three major species of the Korean temperate region: Korean red pine (Pinus densiflora), Chinese ash (Fraxinus rhynchophylla), and Korean mountain ash (Sorbus alnifolia). The effect of the increase in atmospheric CO2 concentration on seedling diameter and height, as well as photosynthetic properties, such as maximum photosynthetic rate, maximum carboxylation rate, and maximum electron transfer rate, was evaluated over a period of 8 years. Moreover, we compared the nitrogen concentration in the leaves and soils to investigate whether the increased productivity due to CO2 fertilization is a short-term effect owing to a progressive nitrogen limitation (PNL) in the soil.
Materials and methods
Experimental system and design
This study was carried out in an Open Top Chamber (OTC) of the Forest Biotechnology Division at National Institute of Forest Science in Suwon-si, Gyeonggi-do, Republic of Korea (37° 15′ 04″ N, 126° 57′ 29″ E). The OTC was made of a decagon structure of diameter 10 m and height 7 m (see Fig. S1 in Supplementary material). The angle of the roof was 45° in order to maintain an opening ratio of 75% or higher. A polyolefin film of thickness 0.15 mm with a light transmittance of approximately 88%, low specific gravity, and excellent chemical and water resistance was used as an external covering material ([23]).
The atmospheric CO2 concentrations kept in the chambers during the experiment were: (i) the current atmospheric CO2 concentration (Chamber 1, aCO2); (ii) 1.4 times higher CO2 concentration than the current concentration (Chamber 2, eCO21.4), which is expected to be the atmospheric CO2 concentration by 2050, according to the IPCC scenario ([20]); and (iii) 1.8 times higher CO2 concentration than the current concentration, which is expected to be the atmospheric CO2 concentration by 2070 (Chamber 3, eCO21.8). The exposure of CO2 were conducted for 10 hours (08:00-18:00) a day during the growing season (April-November). Pest controls were conducted every year and weed controls were conducted for first four years of the experiment. The annual average, minimum and maximum monthly temperature in chambers were 12.4 ± 0.2 °C, -1.3 ± 0.4 °C, 22.5 ± 0.2 °C, respectively. The annual rainfall range was 751.16 mm yr-1 to 1975.96 mm yr-1 over the 9 years of the experimental period.
In each chamber, the same three clones for each species were tested. Four-year-old seedlings of Korean red pine (Pinus densiflora), two-year-old seedlings of Chinese ash (Fraxinus rhynchophylla), and two-year-old seedlings of Korean mountain ash (Sorbus alnifolia) were planted in September 2009. The density within the OTC was 2547 seedlings ha-1.
Growth measurements
Growth measurements (height and diameter) on trees started in May 2010 and were repeated every year until 2017 at the beginning (mid-April, mean daily temperature: ~10 °C) and the end (end of October, mean daily temperature: ~5 °C) of the growing season. The annual increase in growth was obtained as the difference in these two measures. Also, the lack of differences in diameter between the last measurement of the previous year and the first of the subsequent year was verified.
Tree height was recorded using a measuring rod (A-15, SENSHIN Industry Co., LTD., Osaka, Japan), while the tree diameter was measured twice in orthogonal directions 10 cm above the root collar using a digital Vernier callipers (CD-10CPX, Mitutoyo, Kawasaki, Japan), and the average value was used. Exceptionally, since 2016, Korean red pine and Chinese ash trees were measured using a diameter tape (F10-02DM, KDS, Malaysia) because of their large diameters.
Gas exchange measurements
The photosynthetic parameters were measured on tree leaves using a portable device LI-6400 (LI-COR Inc., Lincoln, NE, USA). From 2013 to 2017, except for 2015, the parameters were measured 1-3 times a year from June to August on 3 sunlit leaves for each species. The temperature of the leaves was set at 25 °C and the relative humidity at 55%-60%. The leaves were stabilized before measurements. The area of leaves was set at 6 cm2 for all the species except Korean red pine. For this species the leaf area was recalculated by measuring the actual leaf area using a scanner after all measurements.
The light response curve was obtained using the photosynthetic rate recorded by sequentially varying the intensity of light irradiated on the leaves, using the following sequence in all the chambers: 1400, 1200, 1000, 800, 600, 400, 200, 100, 75, 50, 25, 0, and 1200 μmol m-2 s-1. The reference CO2 supplied in each LI-6400 chamber was set at the atmospheric CO2 in each OTC. The maximum photosynthetic rate (Amax) was estimated as the photosynthetic rate at light saturation (1200 μmol m-2 s-1) under the CO2 concentration in the chambers, which was measured using the light response curve ([44]).
The A/Ci curve was achieved by varying the reference CO2 concentration at light saturation point in the following order: (i) aCO2: 400, 300, 200, 100, 75, 50, 25, 0, 400, 400, 600, 800, 1000, and 1200 μmol m-2 s-1; (ii) eCO21.4: 560, 400, 300, 200, 100, 75, 50, 25, 0, 560, 560, 800, 1000, and 1200 μmol m-2 s-1; and (iii) eCO21.8: 720, 600, 400, 300, 200, 100, 75, 50, 25, 0, 720, 720, 1000, and 1200 μmol m-2 s-1. The parameters VCmax and Jmax were derived using the model proposed by Sharkey ([41]) and estimated in Excel™ spreadsheet version 2.0 (Microsoft, Redmond, WA, USA).
Leaf total nitrogen analysis
Three sunlit leaves were chosen on the same branch and used for photosynthetic measurements (n = 9 for each species, three repetitions for three species), and 1 cm2 leaf disk was collected in 2017. The leaves were dried in a 70 °C in the lab for more than 72 h, then crushed using a FastPrep-24® crusher (MP Biomedicals, Solon, OH, USA), homogenized, and finally analysed for nitrogen content using CHNS Analyzer Flash EA 1112® (Thermo Electron Corporation, USA) at the National Instrumentation Center for Environmental Management (NICEM).
Soil nitrogen analysis
Before planting trees in 2009, the soil in the OTC was excavated to a depth of 1 m and replaced with forest soil to control the soil characteristics of all the treatment groups. Soil at depth < 30 cm was composed of forest soil and sand with a ratio of 1:1 ([23]). For all treatment groups, samples of soil from 0 to 5 cm depth were collected at five randomly selected points in September 2017, air-dried for 3 days at room temperature, and then analysed using the CHNS Analyzer Flash EA 1112 described above at the NICEM.
Statistical analysis
All statistical analyses were carried using the software R ver. 3.3.2 ([36]). Growth, photosynthesis variables and leaf total nitrogen over time were analyzed by repeated-measures ANOVA with CO2 treatments as a fixed factor and the recording year as the repeated-measure. When significant CO2 × Year interactions and CO2 or Year effect were detected, means were compared using Tukey post-hoc comparisons. In addition, one-way ANOVA of individual species and Tukey post-hoc comparisons were conducted to assess the CO2 effect for each year.
Results
To investigate the CO2 fertilization effect over the period 2010-2017, diameter and height increments of trees of different treatments and species were recorded (Tab. 1, Tab. 2). The cumulative increments for height and diameter over the 8 years of the experiment are presented in Fig. 1.
Tab. 1 - Annual growth in diameter (mm, mean ± SE) of Korean red pine (Pinus densiflora, Pd), Chinese ash (Fraxinus rhynchophylla, Fr) and Korean mountain ash (Sorbus alniflolia, Sa) in response to aCO2 (Chamber 1), eCO21.4 (Chamber 2) and eCO21.8 (Chamber 3) during 8 years. Different lowercase letters indicate significant (p < 0.05) multiple comparison results among CO2 treatments (one-way ANOVA followed by Tukey post-hoc test). (ns): not significant.
| Species | Treatments | Diameter growth (mm) | |||||||
|---|---|---|---|---|---|---|---|---|---|
| 2010 | 2011 | 2012 | 2013 | 2014 | 2015 | 2016 | 2017 | ||
| Pd | aCO2 | 11.2 ± 1.4 ns | 8.5 ± 1.4 b | 11.6 ± 10.1 ns | 19.0 ± 3.5 ns | 9.3 ± 3.3 ns | 18.8 ± 7.7 ns | 25.8 ± 7.7 ns | 16.7 ± 5.2 ns |
| eCO21.4 | 11.9 ± 0.2 ns | 11.4 ± 1.1 ab | 20.3 ± 4.2 ns | 18.0 ± 6.7 ns | 12.3 ± 3.8 ns | 26.3 ± 6.3 ns | 19.3 ± 9.1 ns | 16.5 ± 3.8 ns | |
| CeCO21.8 | 12.5 ± 2.9 ns | 17.0 ± 1.7 a | 8.9 ± 3.4 ns | 40.0 ± 24.1 ns | 20.1 ± 4.8 ns | 25.2 ± 0.9 ns | 31.0 ± 5.4 ns | 19.2 ± 3.0 ns | |
| Fr | aCO2 | 11.7 ± 0.8 ns | 8.6 ± 2.3 ns | 8.8 ± 3.4 ns | 2.0 ± 1.2 ns | 12.6 ± 5.6 ns | 13.8 ± 1.1 ns | 6.8 ± 1.7 ns | 5.5 ± 1.0 ns |
| eCO21.4 | 14.4 ± 2.0 ns | 7.6 ± 1.4 ns | 4.7 ± 6.0 ns | 3.0 ± 1.7 ns | 8.4 ± 4.6 ns | 11.0 ± 1.9 ns | 8.2 ± 2.0 ns | 5.0 ± 2.2 ns | |
| CeCO21.8 | 18.5 ± 2.5 ns | 5.3 ± 2.9 ns | 3.4 ± 6.0 ns | 5.0 ± 3.1 ns | 7.0 ± 0.7 ns | 5.5 ± 0.1 ns | 10.5 ± 1.9 ns | 10.6 ± 2.7 ns | |
| Sa | aCO2 | 5.7 ± 0.7 b | 4.5 ± 0.5 ns | 3.8 ± 4.9 ns | 1.7 ± 0.7 ns | 3.0 ± 0.6 ns | 6.1 ± 2.5 ns | 6.0 ± 3.3 ns | 4.9 ± 0.9 ns |
| CeCO21.4 | 7.0 ± 0.5 ab | 6.3 ± 0.2 ns | 5.1 ± 27 ns | 2.7 ± 0.8 ns | 4.7 ± 0.9 ns | 9.0 ± 1.9 ns | 8.0 ± 0.9 ns | 7.6 ± 2.9 ns | |
| eCO21.8 | 9.0 ± 0.5 a | 6.9 ± 0.6 ns | 3.2 ± 2.6 ns | 7.7 ± 4.7 ns | 2.3 ± 2.0 ns | 9.6 ± 1.2 ns | 7.4 ± 1.7 ns | 3.5 ± 2.3 ns | |
Tab. 2 - Annual growth in height (cm, mean ± SE) of Korean red pine (Pinus densiflora, Pd), Chinese ash (Fraxinus rhynchophylla, Fr) and Korean mountain ash (Sorbus alniflolia, Sa) in response to aCO2 (Chamber 1), eCO21.4 (Chamber 2) and eCO21.8 (Chamber 3) during 8 years. Different lowercase letters indicate significant (p < 0.05) multiple comparison results among CO2 treatments (one-way ANOVA followed by Tukey post-hoc test). (ns): not significant.
| Species | Treatment | Height growth (cm) | |||||||
|---|---|---|---|---|---|---|---|---|---|
| 2010 | 2011 | 2012 | 2013 | 2014 | 2015 | 2016 | 2017 | ||
| Pd | aCO2 | 10.5 ± 1.6 ns | 27.0 ± 0.9 b | 65.2 ± 6.6 ns | 52.3 ± 13.0 ns | 41.3 ± 18.3 ns | 72.0 ± 5.1 ns | 35.3 ± 2.7 ns | 73.0 ± 22.1 ns |
| eCO21.4 | 11.5 ± 1.5 ns | 11.4 ± 1.1 b | 57.6 ± 19.1 ns | 59.3 ± 9.5 ns | 65.7 ± 8.7 ns | 94.7 ± 49.6 ns | 50.0 ± 46.0 ns | 17.7 ± 24.6 ns | |
| eCO21.8 | 6.3 ± 1.6 ns | 56.9 ± 7.5 a | 70.5 ± 34.6 ns | 77.0 ± 5.3 ns | 63.0 ± 6.1 ns | 60.0 ± 20.0 ns | 99.0 ± 21.7 ns | 48.0 ± 17.1 ns | |
| Fr | aCO2 | 136.2 ± 23.3 b | 86.5 ± 11.9 ns | 29.0 ± 16.0 ns | 13.0 ± 2.1 ns | 90.7 ± 34.7 ns | 89.3 ± 44.9 ns | 30.2 ± 22.3 ns | 78.3 ± 2.6 ns |
| eCO21.4 | 145.4 ± 14.8 ab | 7.6 ± 1.3 ns | 22.9 ± 3.3 ns | 27.7 ± 12.8 ns | 60.3 ± 29.5 ns | 73.7 ± 18.2 ns | 29.3 ± 20.1 ns | 86.7 ± 0.9 ns | |
| eCO21.8 | 215.0 ± 8.3 a | 84.4 ± 18.4 ns | 9.0 ± 3.3 ns | 75.7 ± 33.1 ns | 92.0 ± 40.8 ns | 81.7 ± 10.9 ns | 70.3 ± 19.7 ns | 82.7 ± 39.8 ns | |
| Sa | aCO2 | 39.1 ± 7.0 ns | 27.0 ± 4.3 ns | 18.2 ± 12.8 ns | 51.0 ± 16.8 ns | 42.3 ± 20.3 ns | 38.0 ± 3.21 ns | 43.0 ± 2.1 ns | 18.7 ± 9.8 ns |
| eCO21.4 | 55.7 ± 15.9 ns | 33.4 ± 9.7 ns | 10.6 ± 5.5 ns | 53.7 ± 33.7 ns | 17.7 ± 7.2 ns | 46.6 ± 13.1 ns | 59.0 ± 11.5 ns | 50.0 ± 8.0 ns | |
| eCO21.8 | 85.8 ± 11.4 ns | 17.3 ± 6.5 ns | 22.3 ± 15.1 ns | 16.0 ± 0.7 ns | 29.3 ± 14.4 ns | 45.3 ± 7.8 ns | 35.7 ± 6.0 ns | 36.0 ± 18.6 ns | |
Fig. 1 - Effects of elevated CO2 concentration (aCO2, Chamber 1; eCO21.4, Chamber 2; eCO21.8, Chamber 3) on average tree diameter (a, b, c) and height (d, e, f) growth per year from 2010 to 2017. There were no significant differences among CO2 treatments (p > 0.05).
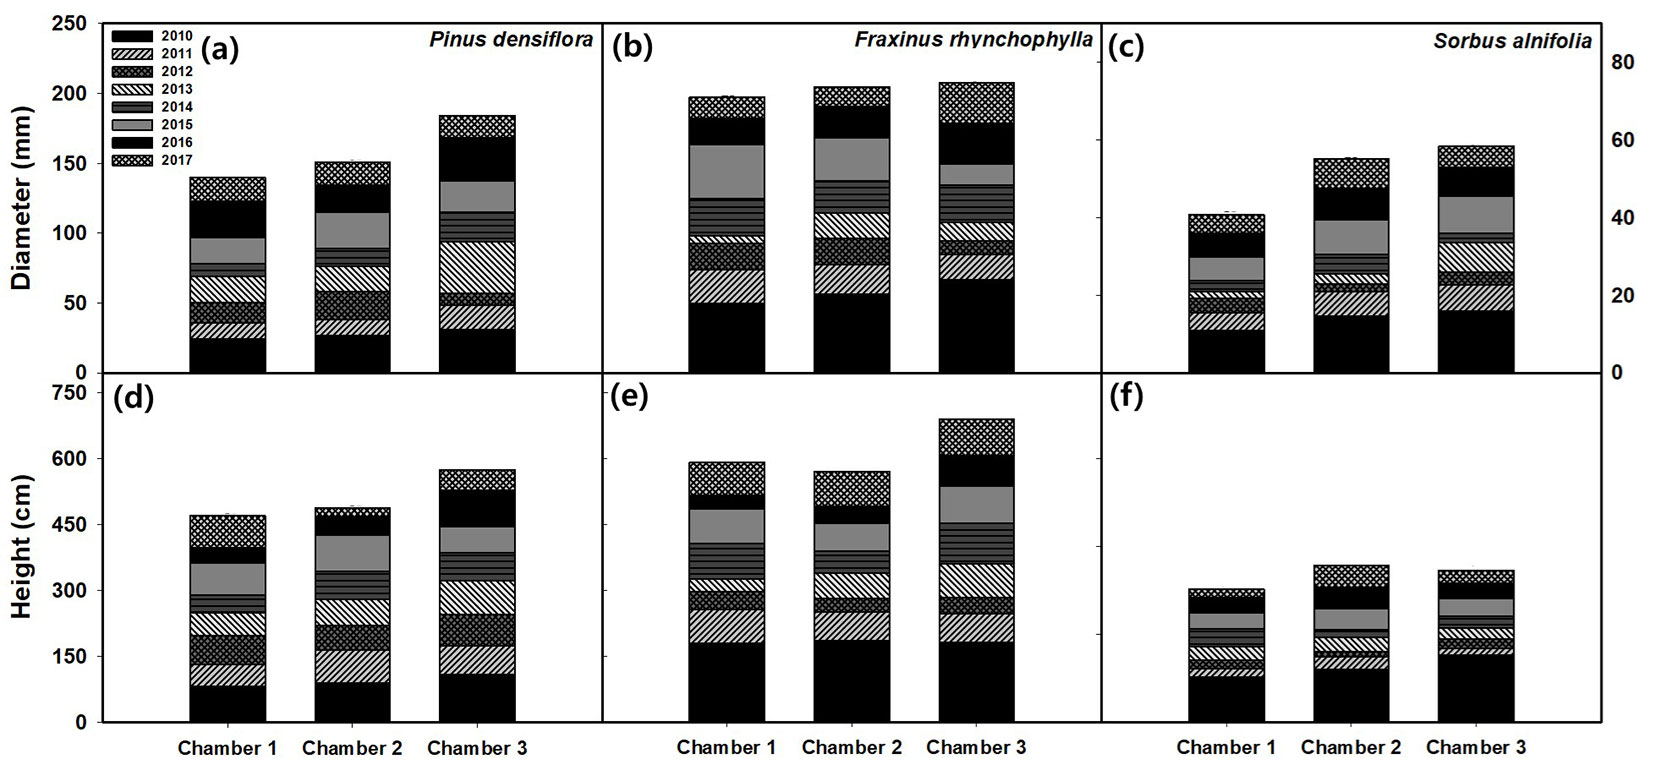
Diameter growth
Tab. 1 summarizes the annual diameter increase measured after CO2 exposure. The results showed a significant increment in diameter growth under high CO2 concentration due to the CO2 fertilization effect (p <0.001 - Tab. 3). On average, the difference between aCO2 and eCO21.8 was 47.7%, 25.3%, and 3.1% in Korean mountain ash (41.4 ± 6.2 vs. 61.1 ± 7.9 mm), Korean red pine (144.7 ± 15.1 vs. 181.3 ± 13.5 mm), and Chinese ash (70.9 ± 9.2 vs. 73.1 ± 5.5 mm), respectively.
Tab. 3 - Results statistics for diameter, height, Amax, Vcmax, Jmax and leaf total N of all species with F statistics and p-values from two-way repeated-measure ANOVA.
| Parameter | Factor | F | p |
|---|---|---|---|
| Diameter | CO2 | 58.03 | < 0.001 |
| Year | 19.08 | < 0.001 | |
| CO2 × Year | 1.04 | 0.982 | |
| Height | CO2 | 17.727 | < 0.001 |
| Year | 9.201 | < 0.001 | |
| CO2 × Year | 0.367 | 0.416 | |
| Amax | CO2 | 2.942 | 0.06 |
| Year | 13.474 | < 0.001 | |
| CO2 × Year | 0.771 | 0.594 | |
| Vcmax | CO2 | 1.662 | 0.194 |
| Year | 2.791 | 0.030 | |
| CO2 × Year | 0.545 | 0.819 | |
| Jmax | CO2 | 0.192 | 0.825 |
| Year | 0.628 | 0.644 | |
| CO2 × Year | 0.251 | 0.979 | |
| Leaf Total N | CO2 | 3.701 | 0.026 |
| Year | 5.295 | 0.002 | |
| CO2 × Year | 0.945 | 0.464 |
The annual diameter increment of individual species under eCO2 was significantly enhanced in all the species in 2010-2011 (maximum p = 0.029 - Tab. 3). However, since 2012, there was no significant difference in diameter increment under eCO2. Korean red pine showed a significant difference in diameter growth under eCO2 in 2011 in the order of aCO2 < eCO21.4 < eCO21.8, an increase of about 100.0% (aCO2 vs. eCO21.8, p = 0.015 - Tab. 1). Korean mountain ash showed significant difference under eCO2 in 2010, an increase of about 57.9% (aCO2: 5.7 ± 0.7 vs. eCO21.8: 9.0 ± 0.5 mm; p = 0.02).
Height growth
Similarly to growth in diameter, annual increase in tree height was recorded each year from 2010 until 2017 (Fig. 1). For all the species, the increase in height was high under eCO2 (p < 0.01 - Tab. 2). On average, the difference between aCO2 and eCO21.8 was 22.01%, 18.3% and 14.3% in Korean red pine (470.7 ± 22.8 vs. 574.3 ± 72.5 cm), Chinese ash (585.3 ± 39.1 vs. 692.3 ± 48.1 cm) and Korean mountain ash (299.3 ± 40.5 vs. 342.0 ± 8.2 cm), respectively.
Tab. 2 summarizes the annual growth of tree height measured after CO2 exposure. For all the species, results were similar to the diameter growth. Chinese ash showed a significant difference in height growth under eCO2 in 2010 (p = 0.029). Differences were observed under eCO21.8 and aCO2, which was increased about 57.9%. Korean red pine showed a significant increase under eCO2 in 2011, an increase of about 110.7% (p = 0.006). However, after 2012, there was no difference in the increase in height due to CO2 concentration for all the species.
Maximum photosynthetic rate (Amax)
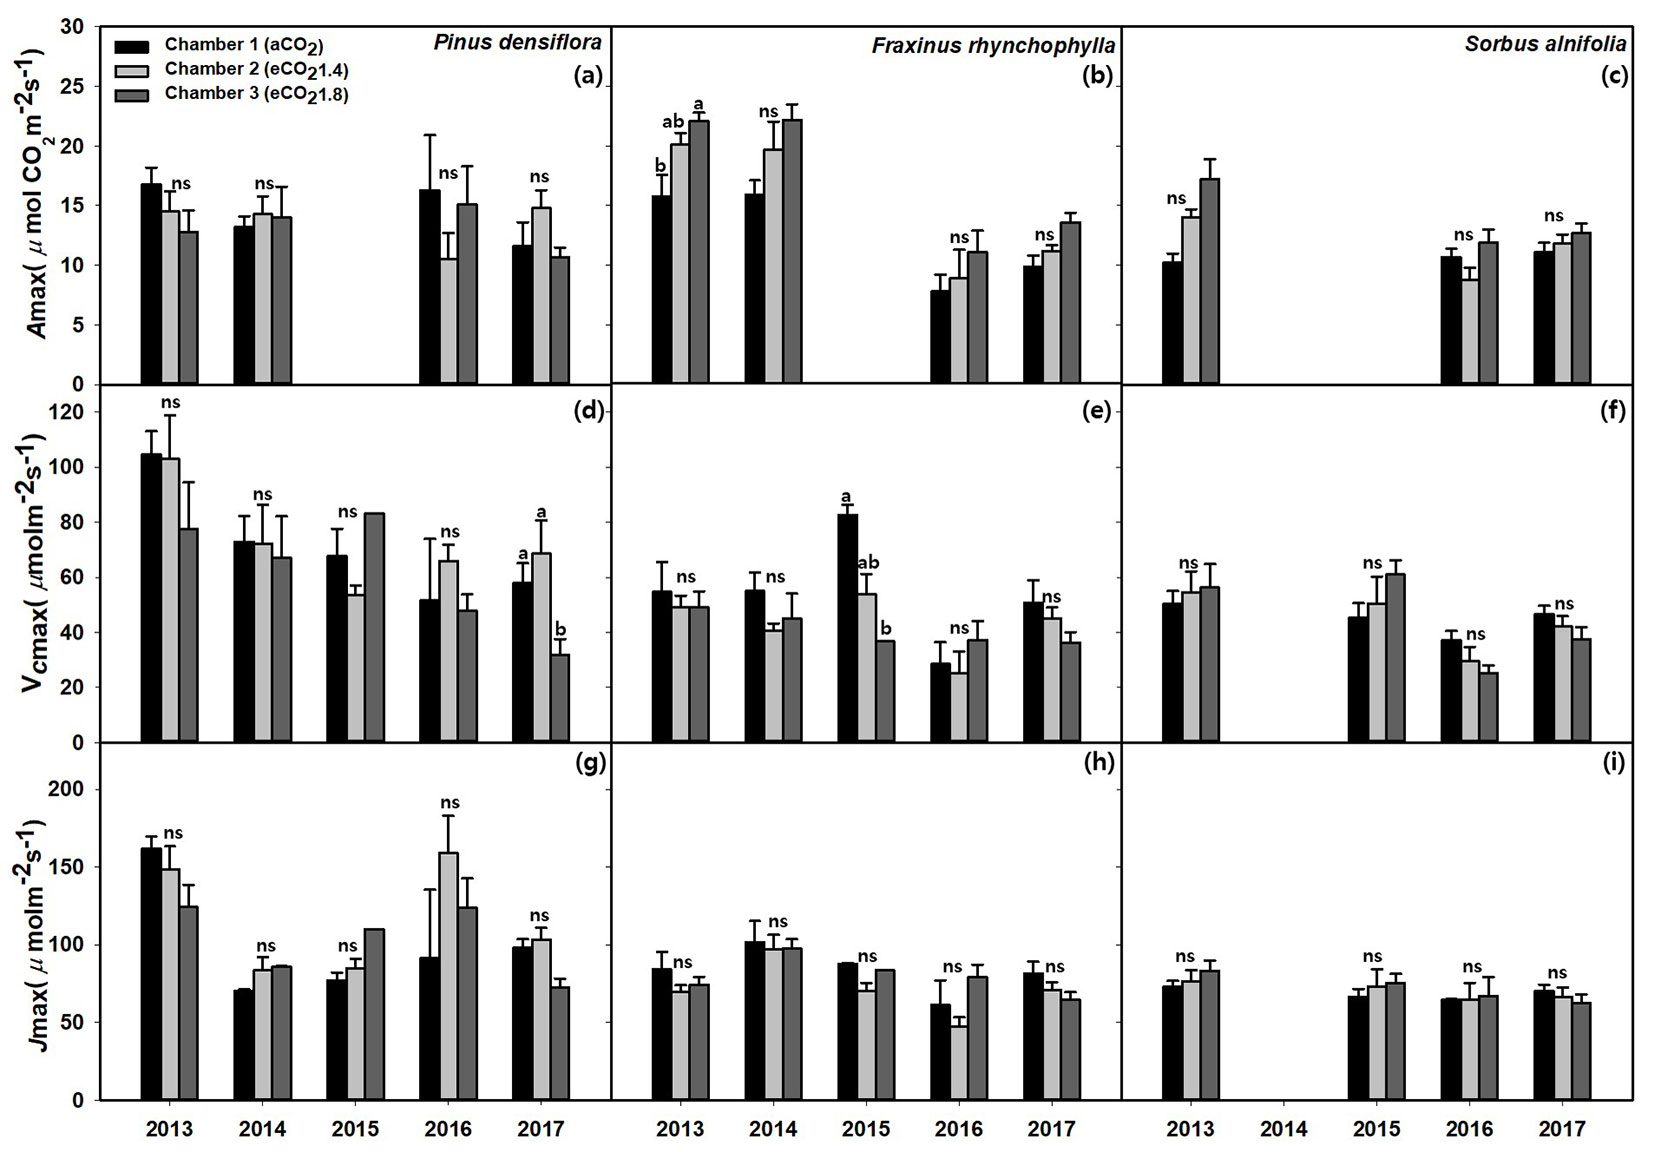
The average Amax under eCO2 measured from 2013 increased in the following order: aCO2 (12.7 ± 0.7 μmol m-2 s-1) < eCO21.4 (13.6 ± 0.8 μmol m-2 s-1) < eCO21.8 (14.9 ± 0.8 μmol m-2 s-1) but did not differ significantly (p = 0.06 - Tab. 3). In terms of response by year, the average Amax decreased by about 28.9%, from 15.9 ± 0.8 μmol m-2 s-1 in 2013 to 11.3 ± 0.9 μmol m-2 s-1 in 2016 (p < 0.001). However, these results showed differences among species and year (Fig. 2, Tab. 4).
Fig. 2 - Effects of CO2 concentration (aCO2, eCO21.4, eCO21.8) on maximum photosynthetic rate (Amax), maximum rate of carboxylation (Vcmax), and maximum rate of electron transport (Jmax) in: (a, d, g) Korean red pine (Pinus densiflora); (b, e, h) Chinese ash (Fraxinus rhynchophylla); and (c, f, i) Korean mountain ash (Sorbus alnifolia). The values shown are mean ± SE. Different lowercase letters above the bars indicate significant (p < 0.05) differences from multiple comparison among CO2 treatments. (ns): not significant.
Tab. 4 - Results statistics of diameter, height, Amax, Vcmax, Jmax and leaf total N of the studied species with F statistics and p-values from two-way repeated measured ANOVA. (Pd): Korean red pine (Pinus densiflora); (Fr): Chinese ash (Fraxinus rhyncophylla); (Sa): Korean mountain ash (Sorbus alnifolia).
| Species | Factors | Diameter | Height | Amax | Vcmax | Jmax | Leaf Total N | ||||||
|---|---|---|---|---|---|---|---|---|---|---|---|---|---|
| F | p | F | p | F | p | F | p | F | p | F | p | ||
| Pd | CO2 | 0.632 | 0.540 | 14.449 | <0.001 | 0.266 | 0.771 | 0.618 | 0.554 | 0.719 | 0.506 | 1.459 | 0.247 |
| Year | 5.827 | <0.001 | 9.673 | <0.001 | 0.840 | 0.498 | 0.979 | 0.452 | 1.957 | 0.161 | 7.837 | <0.001 | |
| CO2×Year | 0.249 | 0.995 | 1.250 | 0.306 | 1.189 | 0.374 | 2.817 | 0.051 | 0.511 | 0.810 | 3.793 | 0.006 | |
| Fr | CO2 | 30.737 | <0.001 | 5.527 | 0.010 | 2.891 | 0.094 | 1.594 | 0.238 | 0.486 | 0.625 | 4.025 | 0.021 |
| Year | 10.920 | <0.001 | 0.403 | 0.890 | 2.661 | 0.095 | 2.232 | 0.118 | 2.364 | 0.103 | 13.145 | <0.001 | |
| CO2×Year | 2.537 | 0.021 | 0.456 | 0.935 | 0.545 | 0.765 | 1.368 | 0.292 | 0.507 | 0.815 | 2.646 | 0.021 | |
| Sa | CO2 | 11.368 | <0.001 | 13.344 | <0.001 | 6.983 | 0.014 | 2.890 | 0.094 | 1.782 | 0.210 | 0.178 | 0.838 |
| Year | 0.179 | 0.987 | 0.583 | 0.762 | 0.918 | 0.433 | 5.243 | 0.015 | 2.931 | 0.0768 | 0.765 | 0.522 | |
| CO2×Year | 2.611 | 0.018 | 1.809 | 0.097 | 1.123 | 0.404 | 0.632 | 0.702 | 0.708 | 0.649 | 1.288 | 0.289 | |
Korean red pine and Chinese ash did not show a significant difference in the average Amax (minimum p = 0.094 - Tab. 4), but Korean mountain ash showed significant CO2 effect. Korean red pine in all the years under eCO2 showed no specific tendency. The Amax of Korean mountain ash was 14.0 ± 1.3 μmol m-2 s-1 under eCO21.8, which showed an enhancement from 10.7 ± 0.7 μmol m-2 s-1 under aCO2 (p= 0.014). The difference in the Amax due to CO2 exposure in each year did not show significant differences (Fig. 2c). The Amax of Chinese ash decreased in the following order: aCO2 (12.4 ± 1.2 μmol m-2 s-1) < eCO21.4 (15.0 ± 1.7 μmol m-2 s-1) < eCO21.8 (17.4 ± 1.6 μmol m-2 s-1), and also decreased steadily from 2013 (19.4 ± 1.1 μmol m-2 s-1) to 2017 (11.7 ± 0.8 μmol m-2 s-1) by about 39.7%, though not significantly (p=0.094, p=0.095, respectively - Fig. 2b). However, the enhancement of Amax due to elevated CO2 was 27.7% at eCO21.8, and the increase was constantly maintained at 28.6% under eCO21.8 in 2013 and 27.5% in 2017 relative to the rate under aCO2.
Maximum rate of carboxylation (VCmax) and electron transport (Jmax)
Unlike the maximum photosynthetic rate, the VCmax was decreased of about 13.6% from eCO21.8 (49.6 ± 3.4 μmol m-2 s-1) to aCO2 (57.4 ± 3.5 μmol m-2 s-1) but did not differ significantly (p = 0.194 - Tab. 3). Similar to the Amax, the VCmax value by year was 68.0 ± 5.2 μmol m-2 s-1 in 2013 and it significantly decreased to 46.7 ± 2.6 μmol m-2 s-1 in 2017 (p = 0.03).
In terms of response by species and year, Korean red pine showed no significant differences with CO2 and year (p = 0.554 and p = 0.452, respectively - Tab. 4). Contrastingly, VCmax showed a decreasing tendency of about 46.4% from 2013 (98.1 ± 8.1 μmol m-2 s-1) to 2017 (52.6 ± 5.9 μmol m-2 s-1). Depending on the CO2 concentration, it also showed same decreasing trend by about 14.8% from aCO2 (70.9 ± 7.1 μmol m-2 s-1) to eCO21.8 (60.4 ± 7.5 μmol m-2 s-1) and the difference between eCO21.8 and aCO2 was the highest and significantly different in 2017 (p = 0.002 - Fig. 2d). The annual VCmax of Korean mountain ash decreased significantly by 23.5% from 55.0 ± 4.5 μmol m-2 s-1 in 2013 to 42.1 ± 2.0 μmol m-2 s-1 in 2017 (p=0.015). For Chinese ash, no statistical differences were found. However, its annual VCmax decreased under eCO21.8 by 55.7% compared with that under aCO2 in 2015 (p = 0.03, Fig. 2e), but there was no difference thereafter. All species showed no significant differences in VCmax due to CO2 enhancement (minimum p = 0.094).
The Jmax showed no significant differences under eCO2 and year (Tab. 3, Tab. 4). However, it had a decreasing tendency of about 23.4% from 2013 (100.2 ± 7.2 μmol m-2 s-1) to 2017 (76.8 ± 3.1 μmol m-2 s-1) with no significance. Depending on the CO2 concentration, there was no significant differences and tendency (minimum p = 0.210). In terms of response by species, all species showed no statistical differences with CO2 and year (Fig. 2g, Fig. 2h, Fig. 2i).
Leaf and soil N
The leaf total nitrogen was significantly different under eCO2 and year (maximum p = 0.026 - Tab. 3). The leaf total N exposed to CO2 significantly (p = 0.026) decreased in the following order: aCO2 (1.57 ± 0.05 %) > eCO21.8 (1.28 ± 0.04 %) > eCO21.4 (1.24 ± 0.03 %).
Korean red pine showed significant differences in leaf total N under CO2 exposure (p < 0.001 - Tab. 4). The leaf total N decreased significantly by about 24.4% from 2013 (1.31 ± 0.08 %) to 2017 (0.99 ± 0.03 %). The leaf total N under eCO2 decreased in the following order: aCO2 (1.45 ± 0.15 %) > eCO21.8 (1.21 ± 0.09 %) > eCO21.4 (1.07 ± 0.04 %) but it was not significant (p = 0.247). The eCO21.4 treatment showed the lowest leaf total N and the difference between aCO2 and eCO21.4 were 31.0% in 2013, 27.9% in 2015, and 10% in 2017 (Fig. 3a).
Fig. 3 - Effects of CO2 concentration (aCO2, eCO21.4, eCO21.8) on leaf total nitrogen content (%) in (a) Korean red pine (Pinus densiflora), (b) Chinese ash (Fraxinus rhynchophylla), (c) Korean mountain ash (Sorbus alnifolia). The values shown are mean ± SE. Different lowercase letters above the bars indicate significant (p < 0.05) differences from multiple comparison among CO2 treatments. (ns): not significant.
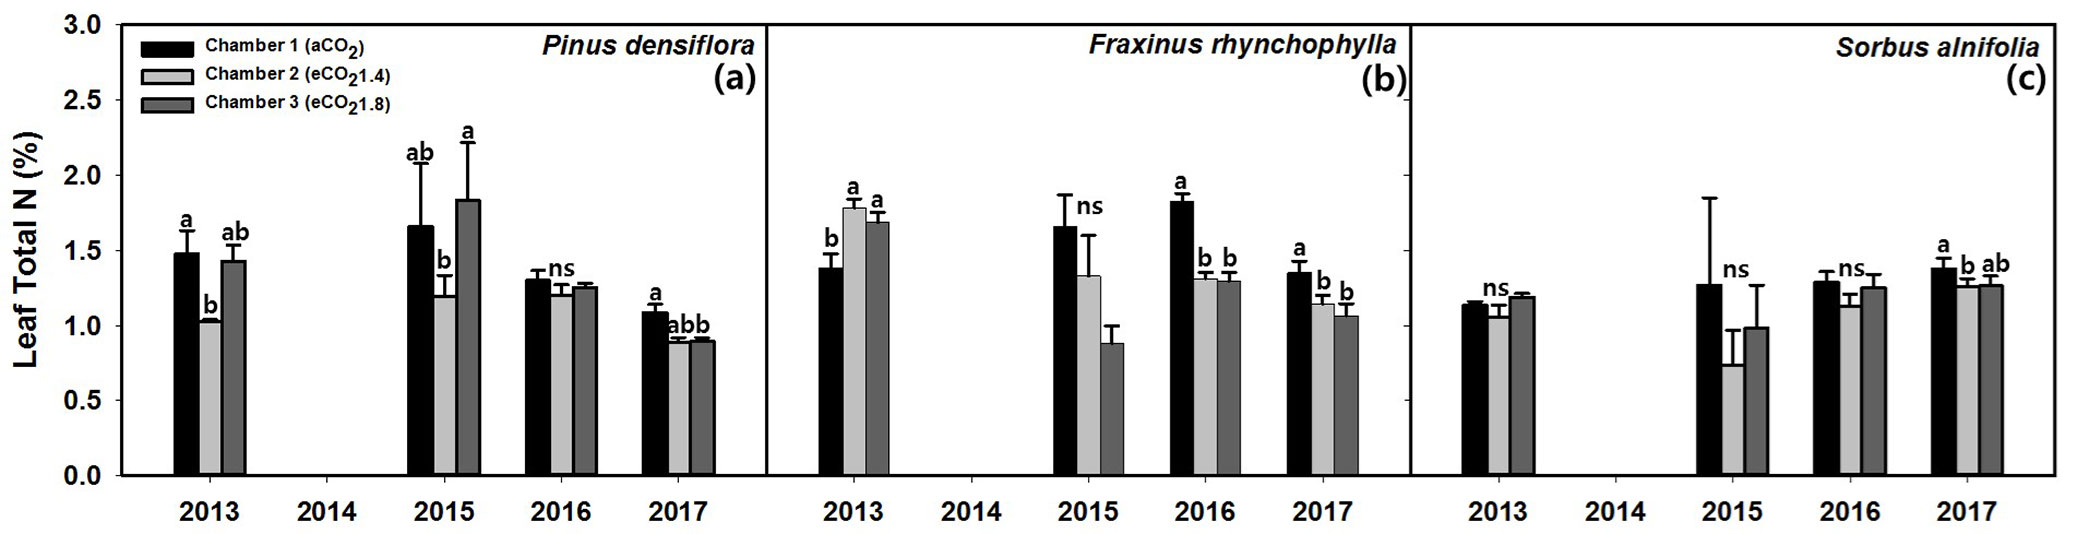
Chinese ash showed a significant decrease in leaf total N under eCO2 and year (p = 0.021 and p < 0.001, respectively). The leaf total N under eCO2 decreased significantly (p = 0.021) in the following order: aCO2 (1.78 ± 0.04 %) > eCO21.4 (1.41 ± 0.04 %) > eCO21.8 (1.36 ± 0.05 %). In particular, the leaf total N was higher under eCO21.4 and eCO21.8 than under aCO2 in 2013 (p < 0.001), but it became significantly lower under eCO21.4 and eCO21.8 than under aCO2 over time (Fig. 3b). The difference between aCO2 and eCO21.8 was 27.8% in 2016, and 18.8% in 2017 (maximum p = 0.04).
Korean mountain ash showed no significant differences under eCO2 and year (minimum p = 0.522). But it decreased significantly by 15.4% under eCO21.4 compared with aCO2 only in 2017 (p = 0.03 - Fig. 3c).
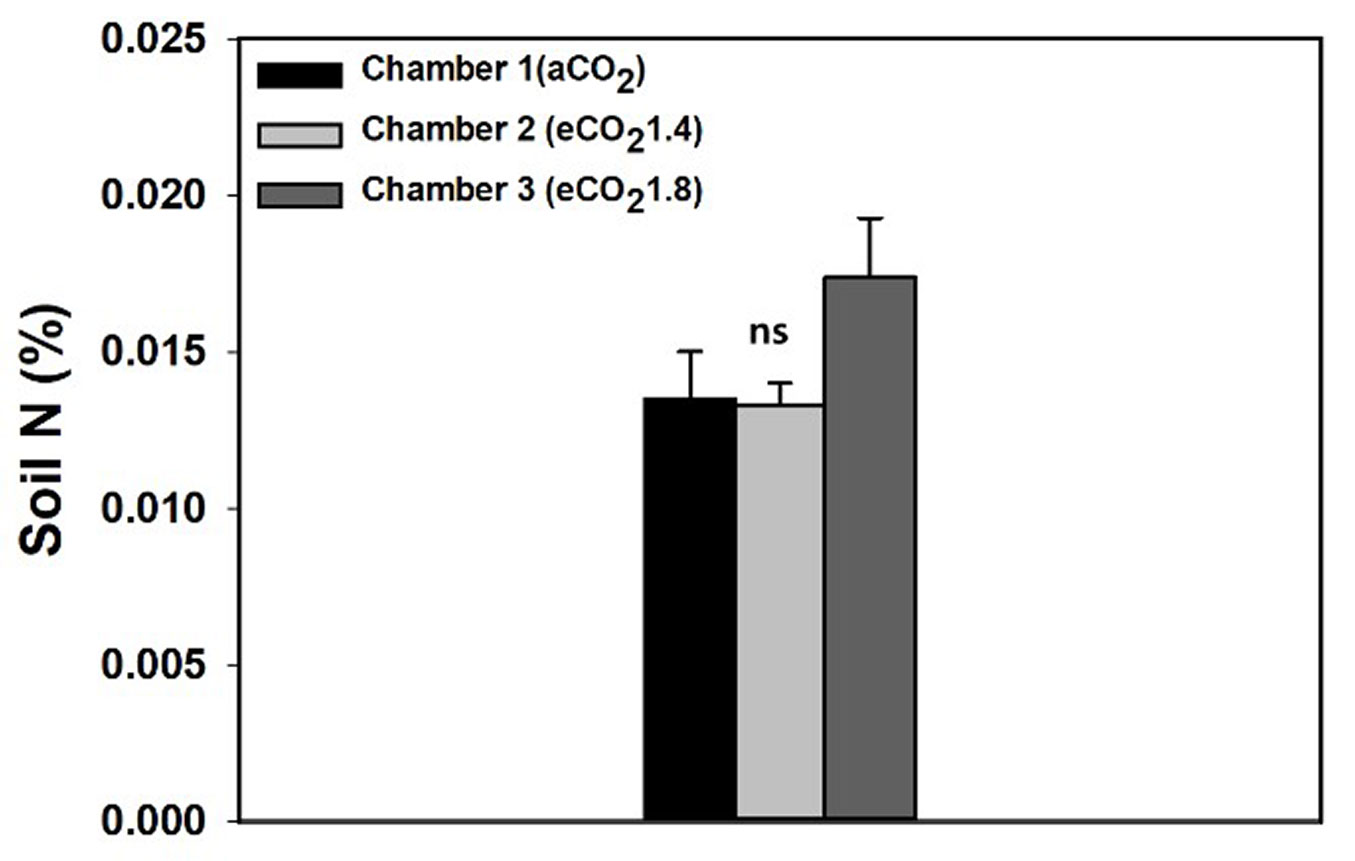
There was no significant difference in soil total N under eCO2 in 2017 (p = 0.125). The absolute concentration of soil total N was very low, and therefore, the variation depending on CO2 concentration was negligible (Fig. 4).
Fig. 4 - Effects of elevated CO2 concentration (aCO2, eCO21.4, eCO21.8) on the soil total nitrogen (%) in 2017. Values are mean ± SE. There were no significant differences among CO2 treatments (p > 0.05).
Discussion
Relationship between the CO2 fertilization effect and growth
Several studies have reported that elevated CO2 concentration due to climate change directly affects photosynthesis, suggesting that eCO2 promotes ecosystem production and biomass accumulation ([29], [32], [38]). For instances, the net primary production (NPP) increased by 22-32% in the Duke-FACE experiment, which conducted the CO2 exposure for more than 10 years. In the Pop-FACE experiment, the diameter increased about 5% and the 12 species leaf area increased about 8% in seven FACE ([1], [13], [29]). In this study, the annual growth of the three speices was analysed, confirming a significant enhancement in height and diameter under eCO2 for the first two years. However, the CO2 fertilization effect was not sustained thereafter (Tab. 1, Tab. 2, Fig. 1). Temporary CO2 fertilization effect was also reported by other studies. In the Oak-Ridge FACE and BioCON experiments, the reduction of CO2 effect was offset after 6 and 3 years, respectively, and nitrogen fertilization showed an immediate increase in NPP ([37], [32]). In addition, there was no CO2 effect in Picea abies growing on a very low-nutrient soil ([52]). Moreover, in the Duke FACE experiment, where the CO2 fertilization effect remained for more than 10 years, soil N positively correlated with productivity increment under eCO2 ([29]). Thus, soil nutrients and CO2 fertilization effect appeared to be closely related. In particular, in our study site, the soil total N was very low because the nearby forest soil was mixed with sand and leaf total N decreased over time. For this reason, we argue that growth promotion through the CO2 fertilization effect was not sustained.
Changes in photosynthetic properties under elevated CO2 concentration
Elevated atmospheric CO2 concentration increases the difference in the partial pressure of CO2 between the atmosphere and leaf mesophyll tissues, increasing the maximum photosynthetic rate ([7], [2]). Twelve FACE experiments showed that the average Amax of all the tested species increased by about 31%. Depending on species, it was increased by about 37% in Pinus australis ([31]), 67% in P. taeda, and 62% in Liquidambar styraciflua ([10]). However, over time, the increase of Amax under eCO2 was reduced by the acclimation of photosynthetic properties ([2]). In our study, the reduction of Amax increase under eCO2 varied depending on the species (Fig. 2). Korean red pine and Korean mountain ash did not show a significant difference since 2013, which was only three years after eCO2 exposure. Chinese ash showed the enhancement in 2013, but the increase in Amax was reduced over time. Amax of Korean mountain ash under aCO2 was maintained over time, but it was decreased in Chinese ash, which might have been due to the low soil nutrient (Fig. 2, Fig. 4). This decrease in the Amax resulted in the down-regulation of the Vcmax and Jmax. In other words, the Amax is usually measured under the CO2 concentration of each treatment, therefore no difference or a decrease indicates that photosynthesis enhancement is not maintained, rather lowered over time. Similar to previous studies ([9], [28]), we observed a reduction in the Vcmax and Jmax under eCO2. This reduction usually occurs after long term CO2 exposure ([2], [32]). In P. ponderosa exposed to eCO2 for 6 years, the VCmax and Jmax were decreased by about 36% and 21%, respectively ([47]), and the VCmax was decreased by about 19% in P. abies ([48]). However, in some cases, the reduction of photosynthesic ability under eCO2 did not occur even in the long term (more than 6 years - [3], [8], [53]). In an experiment on Fagus sylvatica, Quercus petraea, Carpinus betulus, Acer campestre, and Tilia platyphyllos in mature deciduous forests, the increase in the Amax was maintained even after 8 years of CO2 treatment, and the down-regulation of VCmax and Jmax did not occur. Similarly, in the Aspen FACE experiment, the increases in Vcmax (48%-85%) and Jmax (23%-34%) were sustained for 11 years, and no reduction occurred. Warren et al. ([53]) also showed that the increase in photosynthesis was maintained during the first 8 years when the leaf N was 0.2 mg cm-2 or more, but after a decrease of leaf N, the CO2 fertilization effect disappeared. Thus, the increase in photosynthesis and the decrease in photosynthesic ability are largely affected by the nitrogen available in the environment. These studies were conducted in well-developed organic layer of forest floor, such as mature stands ([3]), or soil N of 3% or more ([8]), i.e., environments with considerably higher N than normal forest soil. On the contrary, the long-term exposure under eCO2 leads to nitrogen limitation in common forest soil, which results in PNL that decreases photosynthesis and growth increment ([37], [32], [12], [39]).
Relationship between photosynthetic properties (Vcmax and Jmax) and leaf nitrogen
In general, the leaf total N is positively correlated with the photosynthesis ability ([11]). Several studies have shown that the leaf N decreased in response to long-term eCO2 condition ([10]). The elevated CO2 concentration increases the capacity of the rubisco enzyme to adsorb carbon dioxide, thereby causing carboxylation and a decrease in the demand of nitrogen for rubisco ([34], [25]). Similarly, in this study, the leaf N was significantly lowered under eCO2 over time (Fig. 3). In addition, studies have shown that the Vcmax and photosynthesis ability, decreased as the leaf N decreased ([1], [53]). Thus, fertilization at the time of nitrogen limitation increased the CO2 fertilization effect again or the decreasing rate was reduced ([24], [6], [46]).
In general, there is a strong correlation between VCmax and Jmax, with Jmax/VCmax = 1.5-2.0 at 25 °C ([30], [50], [5]). Similarly, VCmax, Jmax, and leaf N showed correlation under eCO2 ([6], [53]). Therefore, when the leaf N and VCmax were decreased after long-term eCO2 treatment, the Jmax also decreased in some cases ([16], [30], [43], [6], [3]). As in our study, the decrease in Jmax (Tab. 4) was relatively lower than that of Vcmax in some cases ([24], [53]). Moreover, these changes are different depending on species. Chinese ash and Korean red pine showed a decrease only in the VCmax, while Korean mountain ash did not show any decrease in both the above photosynthetic parameters (Fig. 2). These differences due to the change in intracellular nitrogen distribution under eCO2 are dependent not only on the environment but also on the species. Further studies are needed to examine how species change the intercellular nitrogen distribution under elevated CO2 ([11], [17]).
CO2 fertilization effect and PNL
The enhanced productivity of forest ecosystem due to the CO2 fertilization is heavily influenced by the nutrients available in the soil ([13]). PNL is a hypothesis that the increased forest productivity due to eCO2 decreases over time because of the increased N accumulation in the biomass, resulting in a decrease of soil N availability, an increase of N immobilization and a decrease of N mineralization ([26]). In the long-term eCO2 at Duke-FACE, Oak-Ridge FACE, and BioCON experiments, N fertilization led to an immediate increase in NPP. Therefore, there seemed to be an interaction between eCO2 and N in terms of increased productivity ([37], [29], [32]). In particular, the soil N is important and N deficiency leads to a decline in production due to PNL even under eCO2 ([33]). Such N deficiency changes the N distribution in the plants’ organs for effective nitrogen utilization, resulting in a decrease of the N used for above-ground photosynthesis ([35]). In addition, N distribution in photosynthetic apparatus such as Rubisco is greatly reduced. Therefore, nitrogen-use-efficiency is increased generally ([49], [42]), but the persistence of such an increase is controversial ([2], [22]). There is limited information about N distribution in the above- and below-ground under eCO2. Therefore, it is necessary to determine and quantify the distribution of N in the above- and below-ground through follow-up studies.
Conclusions
In this study, we investigated the physiological and morphological characteristics of Korean red pine, Chinese ash, and Korean mountain ash, which are native tree species in Korea, under eCO2 over a period of 8 years. We also examined the longevity of CO2 fertilization effect in our study sites.
The CO2 fertilization effect caused by eCO2 led to an increase in growth in the early stage of exposure, but there was no significant difference thereafter. Photosynthetic properties showed a decreasing tendency in all species and a down-regulation of photosynthetic capacity increase with time, especially in Korean red pine and Korean mountain ash. The analysis of leaf and soil N to identify the cause revealed a significant decrease of leaf N under eCO2. We argue that the enhancement of productivity might have decreased due to low soil N.
In conclusion, progressive nitrogen limitation (PNL) caused by the N reduction might have already started or is about to start in our study sites. Further investigation is needed to clarify N use efficiency and nitrogen distribution according to species.
List of abbreviations
(OTC): Open Top Chamber; (aCO2): current atmospheric CO2 concentration ; (eCO21.4): 1.4 times higher CO2 concentration than the current concentration (Chamber 2); (eCO21.8): 1.8 times higher CO2 concentration than the current concentration (Chamber 3); (Amax): maximum photosynthetic rate; (VCmax): maximum rate of carboxylation; (Jmax): maximum electron transport rate.
Acknowledgments
This research was funded by the National Research Foundation of Korea, by the projects “Evaluation of climate change adaptation mechanisms of native temperate tree species and its ecological effects using open-top chambers” (2014R1A1A2055127) and “Testing progressive nitrogen limitation and nitrogen use efficiency increment through the quantification of leaf nitrogen allocation” (2017R1A2B2012605). We thank members of forest ecophysiology laboratory for their assistance with field sampling.
References
CrossRef | Gscholar
Gscholar
CrossRef | Gscholar
CrossRef | Gscholar
CrossRef | Gscholar
Supplementary Material
Authors’ Info
Authors’ Affiliation
HoonTaek Lee 0000-0002-6661-8298
Forest Ecology and Climate Change Division, National Institute of Forest Science, Seoul 02455 (Republic of Korea)
Si Yeon Byeon
HoonTaek Lee 0000-0002-6661-8298
Min Su Lee
Hyun Seok Kim
Department of Forest Sciences, Seoul National University, Seoul 08826 (Republic of Korea)
Interdisciplinary Program in Agricultural and Forest Meteorology, Seoul National University, Seoul 08826 (Republic of Korea)
Department of Forestry, Kyungpook National University, Daegu 41566 (Republic of Korea)
Forest Biotechnology Division, National Institute of Forest Science, Gyeonggi 16631 (Republic of Korea)
Urban Forests Research Center, National Institute of Forest Science, Seoul 02455 (Republic of Korea)
Corresponding author
Paper Info
Citation
Song WK, Byeon SY, Lee HT, Lee MS, Ryu D, Kang JW, Han SH, Oh CY, Kim HS (2020). Species-specific morphological and physiological characteristics and progressive nitrogen limitation under elevated CO2 concentration. iForest 13: 270-278. - doi: 10.3832/ifor3288-013
Academic Editor
Silvano Fares
Paper history
Received: Nov 08, 2019
Accepted: May 06, 2020
First online: Jul 03, 2020
Publication Date: Aug 31, 2020
Publication Time: 1.93 months
Copyright Information
© SISEF - The Italian Society of Silviculture and Forest Ecology 2020
Open Access
This article is distributed under the terms of the Creative Commons Attribution-Non Commercial 4.0 International (https://creativecommons.org/licenses/by-nc/4.0/), which permits unrestricted use, distribution, and reproduction in any medium, provided you give appropriate credit to the original author(s) and the source, provide a link to the Creative Commons license, and indicate if changes were made.

Web Metrics
Breakdown by View Type
Article Usage
Total Article Views: 41654
(from publication date up to now)
Breakdown by View Type
HTML Page Views: 34444
Abstract Page Views: 3662
PDF Downloads: 2716
Citation/Reference Downloads: 1
XML Downloads: 831
Web Metrics
Days since publication: 2183
Overall contacts: 41654
Avg. contacts per week: 133.57
Article Citations
Article citations are based on data periodically collected from the Clarivate Web of Science web site
(last update: Mar 2025)
Total number of cites (since 2020): 6
Average cites per year: 1.00
Publication Metrics
by Dimensions ©
Articles citing this article
List of the papers citing this article based on CrossRef Cited-by.
Related Contents
iForest Similar Articles
Research Articles
Adaptability of Indocalamus decorus to climate change based on physiological and biochemical responses to elevated carbon dioxide and ozone
vol. 9, pp. 311-317 (online: 22 October 2015)
Research Articles
Photosynthesis of three evergreen broad-leaved tree species, Castanopsis sieboldii, Quercus glauca, and Q. myrsinaefolia, under elevated ozone
vol. 11, pp. 360-366 (online: 04 May 2018)
Review Papers
Open top chamber and free air CO2 enrichment - approaches to investigate tree responses to elevated CO2
vol. 3, pp. 102-105 (online: 15 July 2010)
Research Articles
Links between phenology and ecophysiology in a European beech forest
vol. 8, pp. 438-447 (online: 15 December 2014)
Research Articles
Photosynthetic parameters of urban greening trees growing on paved land
vol. 12, pp. 403-410 (online: 13 August 2019)
Research Articles
The use of branch enclosures to assess direct and indirect effects of elevated CO2 on photosynthesis, respiration and isoprene emission of Populus alba leaves
vol. 1, pp. 49-54 (online: 28 February 2008)
Research Articles
Adjustment of photosynthetic carbon assimilation to higher growth irradiance in three-year-old seedlings of two Tunisian provenances of Cork Oak (Quercus suber L.)
vol. 10, pp. 618-624 (online: 17 May 2017)
Research Articles
Exploring machine learning modeling approaches for biomass and carbon dioxide weight estimation in Lebanon cedar trees
vol. 17, pp. 19-28 (online: 12 February 2024)
Research Articles
Response of Chinese sea buckthorn clonal growth and photosynthetic physiological mechanisms toward a soil moisture gradient
vol. 14, pp. 337-343 (online: 15 July 2021)
Research Articles
Changes in the proteome of juvenile European beech following three years exposure to free-air elevated ozone
vol. 4, pp. 69-76 (online: 05 April 2011)
iForest Database Search
Search By Author
Search By Keyword
Google Scholar Search
Citing Articles
Search By Author
Search By Keywords
PubMed Search
Search By Author
Search By Keyword


