Salinity strongly drives the survival, growth, leaf demography, and nutrient partitioning in seedlings of Xylocarpus granatum J. König
iForest - Biogeosciences and Forestry, Volume 10, Issue 5, Pages 851-856 (2017)
doi: https://doi.org/10.3832/ifor2382-010
Published: Oct 26, 2017 - Copyright © 2017 SISEF
Research Articles
Abstract
Salinity is increasing in the Sundarbans (Bangladesh) due to sea-level rise and the reduction of fresh water flow. Xylocarpus granatum is one of the most valuable mangrove tree species of the Sundarbans. We conducted a six-month long study to investigate the effect of salinity on the survival, growth, leaf demography, and nutrient partitioning in parts of X. granatum seedlings. Our results showed that most of the seedlings (90%) survived at 0 to 5 PSU salinity, and this survival percentage was found to decrease at higher saline conditions. Salinity of more than 25 PSU was lethal to the plants as no seedlings survived under these conditions. In this salinity (25 PSU), accelerated leaf fall coupled with a reduction in the new leaves caused loss of leaves. The relative growth rate (RGR) was higher at 0 to 5 PSU salinity, and conversely, a lower growth rate was observed with increased salinity. Higher saline conditions created stress, which inhibited nutrient (N, P and K) accumulation in different parts (leaf, stem, bark and root) of the seedlings. We concluded that salinity is a critical factor for the growth and survival of X. granatum either by inhibiting plant nutrient uptake or due to salinity related toxicity.
Keywords
Mangroves, Climate Change, Leaf Demography, Salinity, Sundarbans, Xylocarpus granatum
Introduction
Mangroves are the dominant woody vegetation of intertidal coastlines in the tropical, sub-tropical and warm temperate zones of the world ([24]), and these plants are constantly subjected to salinity ranging from seasonally freshwater (with traces of salinity) to hypersaline conditions ([44], [32]). Salinity is known to limit propagule germination, seedling growth, and survival of mangroves ([26]).
Several researchers have studied the growth of mangrove species under different salinity levels. For example, Hoppe-Speer et al. ([13]), Mahmood et al. ([26]), and Chen & Ye ([7]) found maximum biomass in salinity ranging from 0 to 10 PSU (Rhizophora mucronata at salinity 8 PSU, Heritiera fomes and Excoecaria agallocha at salinity range 0 to 5 PSU). However, further increases in salinity can slow the biomass growth ([7], [27]). Reduction of leaf production accompanied with higher leaf mortality often leads to the death of the plant ([6], [41]). Leaf production and senescence are of vital physiological significance for plants as they govern the total leaf surface area per plant and leaf turnover rate ([38]). Leaf demography patterns at different salinity stress conditions provide important indications of salt balance ([8]). Higher saline conditions reduce the nutrient uptake and accumulation and can also affect nutrient partitioning in plant parts ([12], [9]). Differences in ion partitioning and the maintenance of higher nutrients such as K+ to Na+ ratios, especially in young tissues, may be an important mechanism for improving salt tolerance ([43]). Moreover, Khan et al. ([17]) and Patel et al. ([36]) stated that ion toxicity was due to saline stress. Salinity tolerance ranges vary considerably by mangrove species, and the range of salinity tolerance is an important determinant for plant growth and survival in their habitats ([31], [27]).
Allen et al. ([1]) reported that seedlings of Xylocarpus granatum can grow in 23 PSU salinity without any visible stress signs, but they add that growth is much better in non-saline conditions. However, in the Sundarbans, X. granatum commonly occurs in moderately (15 to 25 PSU) saline areas. Xylocarpus granatum is a medium sized, less branched, exclusive mangrove tree species that normally flowers either in pre-monsoon (March-May) or post-monsoon time (October-December). Fruits, consequently, may come either in May-July or in December-February, and each fruit contains approximately 4-6 semi-triangular seeds. Both fruits and seeds are buoyant and water dispersed, and seeds show epigeal germination ([23]). Seed germination is greater in less saline conditions (approximately 60%) than in high saline conditions (approximately 20% - [26]). Xylocarpus granatum is considered to be a salt accumulating species ([34]) and occurs in association with H. fomes, Avicennia officinalis or Brugeira gymnorrhiza. Xylocarpus granatum covers 3.09% of the total vegetated area of the Sundarbans, which declined at a rate of 0.10% year-1 during the 1926-1997 period ([15]). Assuming increased salinities might prevent the recovery and reduce the abundance of X. granatum as a consequence of seedling failure, we aimed to determine whether X. granatum can change its salinity tolerance over time. We wanted to investigate what its salinity tolerance over time would be at each developmental stage. We conducted our study with X. granatum seedlings, as the juvenile stage is more sensitive compared to adults, and X. granatum will increase its salinity tolerance with age.
Evidence suggests that salinity is increasing in the Sundarbans due to sea-level rise in association with reduced fresh water flow from upstream ([11]). The present study examined the effect of salinity on seedling survival and growth, leaf demography, nutrient (N, P and K) and sodium distribution in different parts of X. granatum seedlings. Investigating the relationship of these characteristics to salinity should facilitate a better understanding of the leaf and growth dynamics of this mangrove species. Furthermore, these adaptations may help to elucidate the future status of this species in relation to the consequences of climate change.
Materials and methods
Seed collection and seedling raising
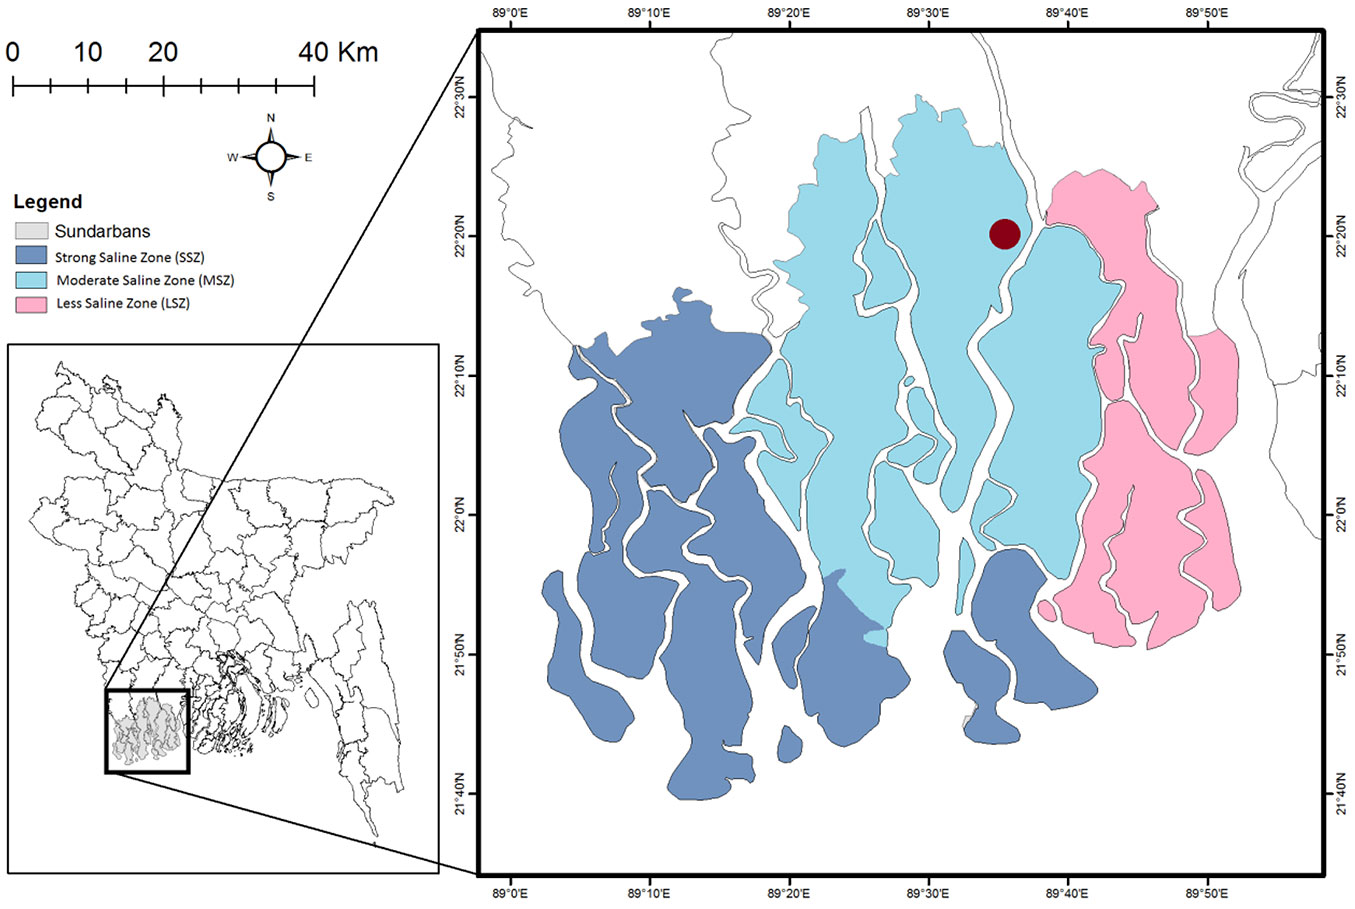
Mature fruits were plucked and collected from several healthy X. granatum trees from the Chandpai range of the Sundarbans, Bangladesh (89° 36′ 31.068″ E, 22° 20′ 11.832″ N) during June and July (Fig. 1). The fruit collection site was in a 10-25 PSU saline zone with an average elevation of 0.9 to 2.1 m above mean sea level and can therefore be classified as mesohaline zone according to Siddiqi ([40]). The site is nearly 200 m away from the Passur River. The land is low and flat and dominated by silty clay loam or alluvium ([16]) with an alternate layer of clay and sand, which is mostly neutral to mildly alkaline in nature. The area becomes waterlogged during the full moon, though there are two high tides per day where it remains dry except during the rainy season when it becomes waterlogged twice a day by high tide. The salinity of the river decreases rapidly with the increase of freshwater flow after the dry season (minimum salinity in August-September) and increases steadily after the freshwater flow reduction in the post-monsoon period (April-May) as the area is situated in the eastern part (except at the river mouth) according to Siddiqi ([40]). Due to the strong seasonal climate, 87% of the annual precipitation (1500 mm) occurs between May and October, and the other months are considered dry with little or no precipitation ([40]). Maximum and minimum temperatures range from 18 to 35 °C in summer and 12 to 29 °C during winter. The site is dominated by H. fomes with a scattered distribution of X. granatum.
Sampled fruits are globose up to 18-24 cm in diameter, and each fruit contains an average of 4-6 seeds. Seeds with visible defects were discarded from the study. Germination was initiated by placing the seeds on the surface of coarse sand (0.5 mm to 1 mm) in a 15-cm thick germination bed. Daily water was provided early in the morning and late in the afternoon to maintain a high level of moisture, compensating for evaporative loss.
Seedling survival, growth and leaf demography
Each six-month-old individual seedling was placed in a coarse sand-filled PET bottle (9 cm in diameter and 20 cm in height), and a total of 156 seedlings were prepared. For each seedling, fresh weight of the whole plant including the stem, roots and leaves was measured and recorded. The number of leaves per seedling was counted and recorded at the beginning of the experiment, and the number of newly grown leaves and leaves shed (by counting the leaf marks left by the fallen leaves on the stem) per seedling was counted and recorded throughout the experiment. The fresh to oven-dried weight conversion ratio was calculated from 12 seedlings after drying them at 80 °C for 4 days. A total of 6 bottles with seedlings were placed in a plastic box (20 × 15 × 12 cm), and thus, 24 boxes were prepared, which were exposed to different salinity treatments (0-35 PSU, at 5 PSU intervals) with 3 replicates for each treatment. Each of the boxes was irrigated with 5 liters of modified full strength Hogland nutrient solution. Different salinity levels of this nutrient solution were maintained by preparing the 1000 ppm stock solution of commercially available NaCl. Hogland solution was modified to avoid further contamination of Na+ and Cl- from the nutrient composition of this solution ([26]). The depth of the nutrient solution was maintained up to the collar height of seedlings, and the salinity levels were checked daily by using a portable hand salinity refractometer (RHS-4/ATC). The water level was marked in each of the boxes and checked daily; if necessary, distilled water was added up to the mark to compensate for evaporative loss.
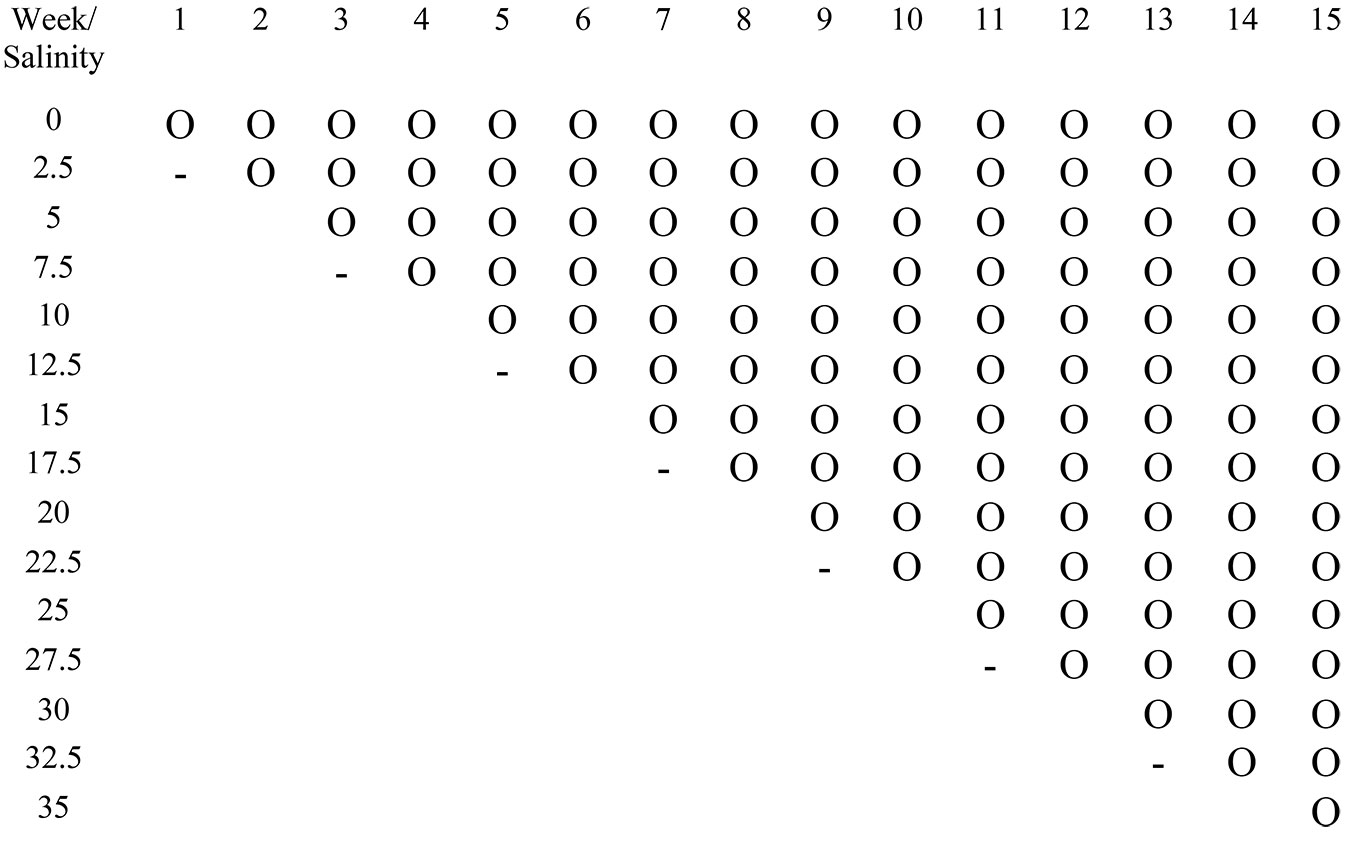
The initial salinity of the nutrient solution was 0 (zero) PSU. At the second week, the salinity of the first treatment was kept at 0 PSU, and all other treatments were increased to 2.5 PSU. At the 3rd week, the salinity of the first treatment was kept at 0 PSU, but the other treatments were increased by another 2.5 PSU. At the 4th week, the salinity of the first treatment was kept at 0 PSU, and the second treatment was kept at 5 PSU, while all other treatments were increased by 2.5 PSU. Thus, the salinity of the solution was gradually increased from 0 to 35 PSU in the respective treatments following the above method (Fig. 2). Salinity was increased gradually as it helps the seedlings to cope with the sudden shock of salt stress. The solution was replaced weekly, and salinity levels were checked regularly. The pH in the nutrient medium was maintained at 7.5-8 for all the treatments. After reaching their final salinity level, every seedling was kept for 25 weeks in an uncontrolled glass-house under natural temperature and light and then harvested. At the end of the experiment, the number of surviving seedlings was counted before they were harvested, and the green final biomass of each seedling including stem, roots and leaves was taken. The leaf area was measured by using Fiji ImageJ software ([39]), and the relative growth rate (RGR, mg g-1d-1) was calculated according to Kriedermann et al. ([20] - eqn. 1):
where Bt is the final biomass of the seedlings measured at the time of harvest, and B0 is the initial dry biomass of the seedling estimated from the fresh to oven dry weight conversion ratio. Specific leaf area (SLA, cm2 g-1) was obtained by dividing the leaf area by leaf biomass.
Measurements of nutrients (N, P and K), and sodium in seedling parts
Tree seedling parts (leaves, bark, stems and roots) were collected from the harvested seedlings of each treatment and crushed to 1.0 mm particle size by sieving to ensure homogeneity. After thorough mixing of the sieved samples, approximately 100 g of subsamples were taken for oven-drying at 60 °C for 4 days. The oven-dried samples were processed and acid digested according to Allen ([2]). Nitrogen and P in the sample extract were measured according to Baethgen & Alley ([3]) and Olsen & Sommers ([33]), respectively. Potassium (K) and sodium (Na) in the sample extract were measured by a Flame photometer (PFP7, Jenway LTD, England).
Statistical analysis
The survival percentages were arcsine transformed and then compared among the treatments by one-way Analysis of Variance (ANOVA) followed by Least Significant Difference (LSD) tests. Additionally, correlation among the survival and growth parameters of seedlings and salinity treatments was conducted using SAS v. 6.12 statistical software. Relative Growth Rate (RGR), Specific Leaf Area (SLA) and Leaf Area Ratio (LAR) in different salinity treatments were also compared by one-way ANOVA followed by LSD tests. Nitrogen (N), Phosphorus (P), Potassium (K) and Sodium (Na) concentrations in different parts of seedlings in different salinity treatments were compared by two-way ANOVA followed by LSD tests. N, P, K and Na relationships with salinity were evaluated through Pearson’s correlation analysis using SAS v. 6.12 statistical software.
Results
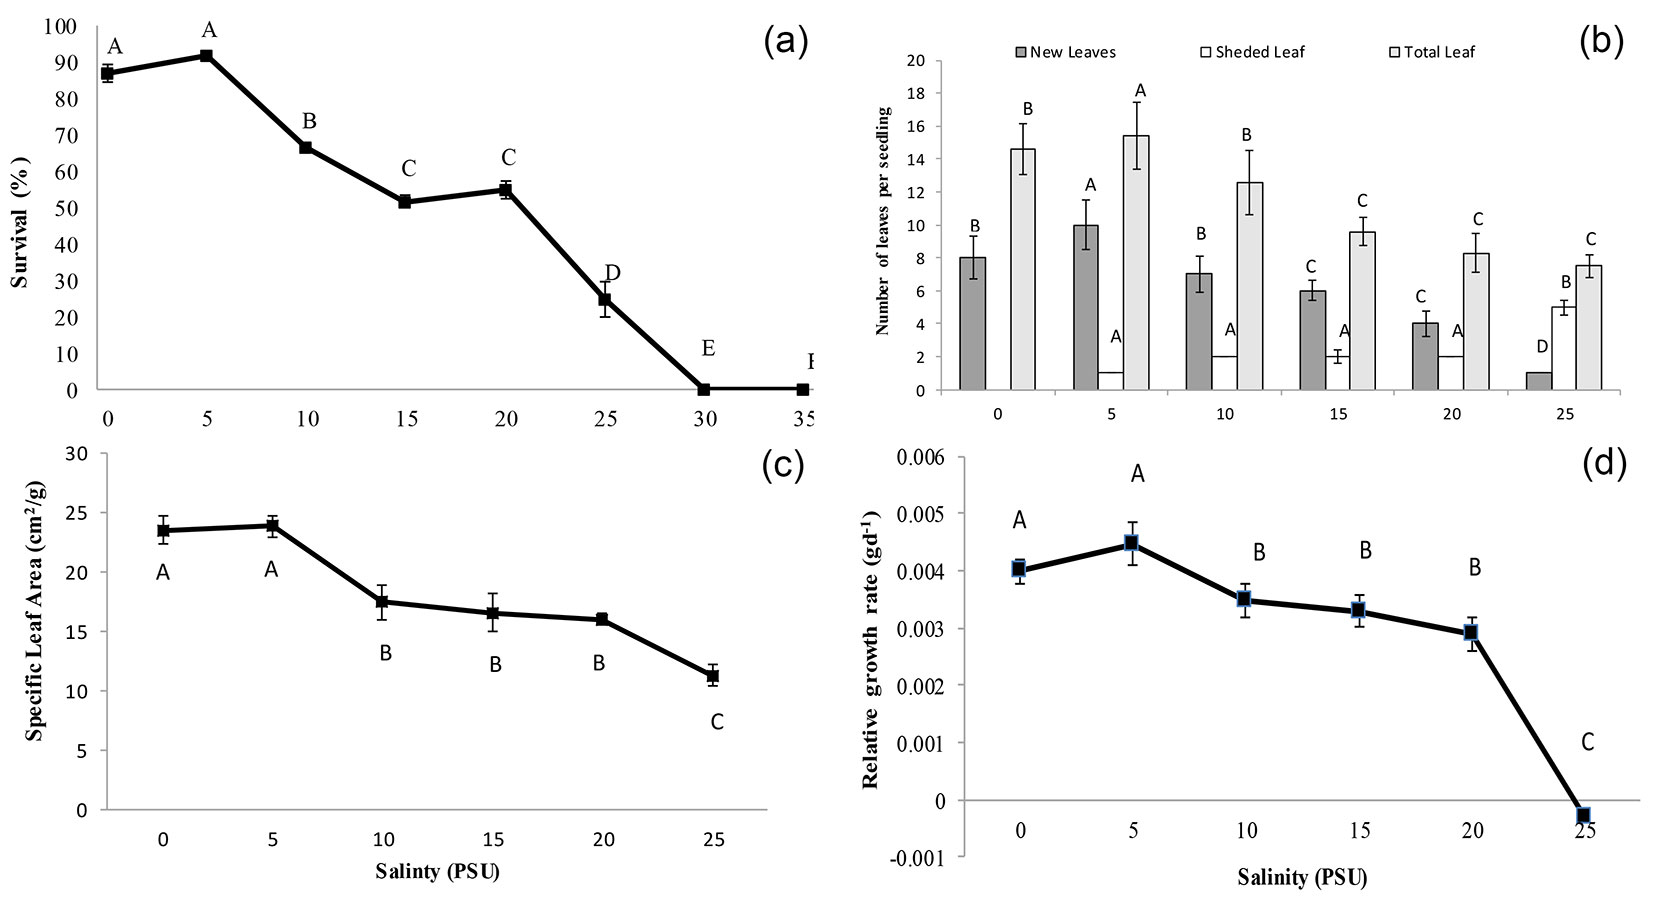
The highest survival (87% to 92%) of seedlings was observed at 0 to 5 PSU saline conditions, and the rate of survival started to decrease significantly (p<0.05) with increasing salinity. The lowest survival (25%) was observed at 25 PSU salinity (Fig. 3a, Tab. 1). The survival of seedlings showed a significant (p<0.05) strong negative correlation (r = -0.94) with salinity. Hence, the effect of salinity on seedling growth was only considered up to a salinity level of 25 PSU.
Fig. 3 - Effects of salinity on seedlings of Xylocarpus granatum: (a) survival; (b) leaf demography; (c) specific leaf area; and (d) growth. Values are means of three replicates with six seedlings per replicate. Means at the same salinity with different letters are significantly different (p<0.05) according to one-way ANOVA test.
Tab. 1 - ANOVA table for the effects of salinity on the survival, leaf demography and growth of Xylocarpus granatum seedlings.
| Sources of Variation | df | Mean Square | F Value | P |
|---|---|---|---|---|
| Survival | 7 | 11008.84 | 370.02 | 0.0001 |
| Total Leaf | 5 | 252.86 | 5.91 | 0.0001 |
| New Leaf | 5 | 115.81 | 6.88 | 0.0001 |
| Shaded Leaf | 5 | 8.59 | 6.72 | 0.0033 |
| Specific Leaf Area | 5 | 595.10 | 8.42 | 0.0001 |
| Relative Growth Rate | 5 | 0.00002557 | 9.92 | 0.0001 |
The highest number of new leaves (10) and consequently the highest number of total leaves (15) per seedling was observed at 5 PSU salinity, and the number of new leaves as well as total leaves decreased significantly (p<0.05) with increasing salinity. Conversely, the highest number of leaves shed per seedling (5) was observed at 25 PSU and decreased significantly (p<0.05) with decreasing salinity (Fig. 3b, Tab. 1). Accelerated senescence of leaves coupled with reduced numbers of newly initiated leaves at salinities of 20 and 25 PSU resulted in loss of leaf over time. The number of newly grown leaves showed a significant negative correlation (r = -0.85) with salinity, whereas the number of shed leaves was positively correlated (r = 0.93) with salinity. The highest specific leaf area (24 cm2 g-1) was observed at 0 to 5 PSU salinity conditions, and the leaf area significantly (p<0.05) declined with increasing salinity (11 cm2 g-1 in 25 PSU salinity) conditions (Fig. 3c, Tab. 1). The specific leaf area showed a significant (p<0.05) negative correlation (r = 0.95) with salinity.
Seedlings of X. granatum grew best at 0 PSU (0.004 g d-1) to 5 PSU (0.0045 g d-1), but the growth of seedlings was significantly (p<0.05) compromised at elevated saline conditions (Fig. 3d, Tab. 1), and at a salinity of 25 PSU, the relative growth rate was negative. Relative growth rate showed a significant negative correlation (r = -0.83) with salinity.
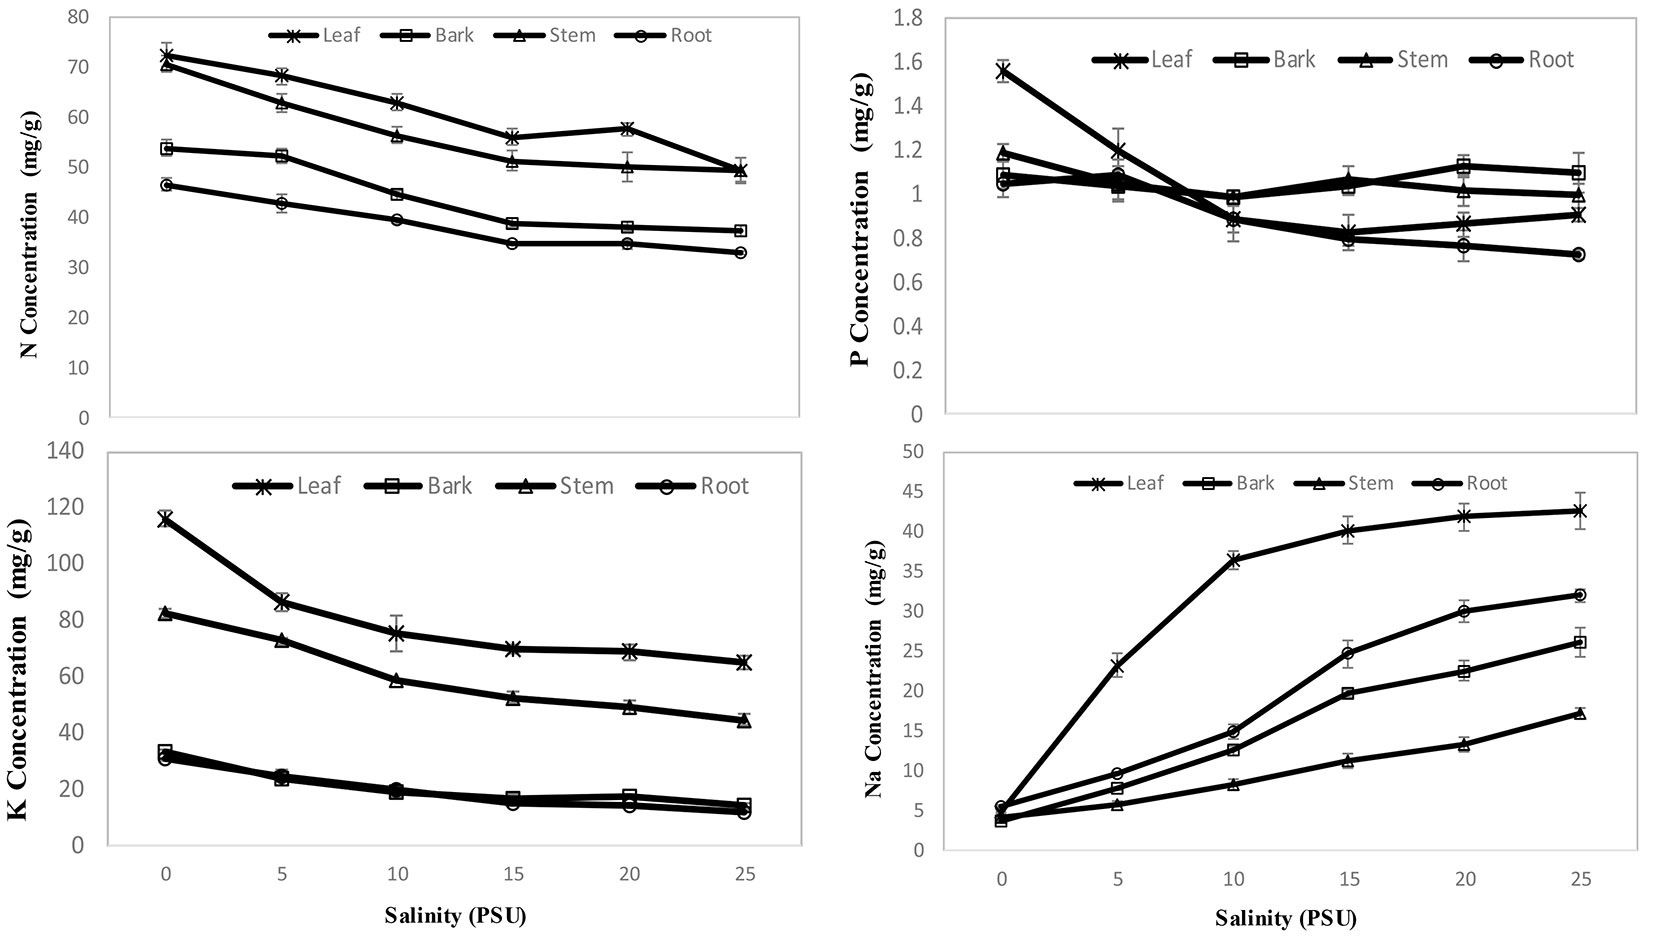
Significant differences in nitrogen (F = 121.72, p <0.0001), phosphorus (F = 5.71, p <0.0001), potassium (F = 148.07, p <0.0001) and sodium (F=59.36, p<0.0001) concentrations were observed for different parts of X. granatum seedlings at different salinity levels. Comparatively, the highest (p <0.05) concentration of N (72 mg g-1) was observed in leaves, followed by stems, bark and then roots (Fig. 4a, Tab. 2). The highest concentration of P (1.56 mg g-1) was detected in leaves, but similar concentrations were observed for bark, roots and stems at different salinities (Fig. 4b, Tab. 2). In the case of K, comparatively, the highest (p <0.05) concentration (116.5 mg g-1) was observed in leaves followed by stems, roots and bark. However, the concentration was very similar for bark and roots (Fig. 4c, Tab. 2). Comparatively, the highest (p<0.05) Na concentration (42.57 mg g-1) was observed in leaves followed by roots, bark and stems (Fig. 4d, Tab. 2). The concentration of nutrients was comparatively higher (p<0.05) at 0 to 5 PSU salinity conditions, and with the increase of salinity, the concentration of nutrients was compromised in all parts of seedlings except for P in bark and stems (Fig. 4). N, P and K concentrations in different parts of seedlings showed significant (p<0.05) negative correlations with salinity, while Na concentration showed a significant positive (p<0.05) correlation. The sodium concentrations in plant parts showed a significant (p<0.05) inverse relationship with potassium in the respective plant parts (Tab. 3).
Fig. 4 - Effects of salinity on nutrients concentration in seedlings of Xylocarpus granatum. (a) Nitrogen; (b) Phosphorus; (c) Potassium and (d) Sodium. Values are means of three replicates with six seedlings per replicate.
Tab. 2 - ANOVA table for the effects of salinity on nutrient partitioning of Xylocarpus granatum seedlings.
| Sources of Variation | df | Mean Square | F Value | Prob. | |
|---|---|---|---|---|---|
| N | Leaf | 5 | 203.443 | 26.03 | <0.0001 |
| Bark | 5 | 163.154 | 39.68 | <0.0001 | |
| Stem | 5 | 306.198 | 22.85 | <0.0001 | |
| Root | 5 | 86.6544 | 30 | <0.0001 | |
| P | Leaf | 5 | 0.07528 | 3.34 | 0.0404 |
| Bark | 5 | 0.0078 | 0.8 | 0.5716 | |
| Stem | 5 | 0.01728 | 1.1 | 0.4083 | |
| Root | 5 | 0.27461 | 7.59 | 0.002 | |
| K | Leaf | 5 | 165.439 | 38.3 | <0.0001 |
| Bark | 5 | 141.106 | 44.93 | <0.0001 | |
| Stem | 5 | 716.098 | 211.12 | <0.0001 | |
| Root | 5 | 1093.99 | 14 | <0.0001 | |
| Na | Leaf | 5 | 670.825 | 92.17 | <0.0001 |
| Bark | 5 | 222.447 | 68 | <0.0001 | |
| Stem | 5 | 72.2391 | 55.03 | <0.0001 | |
| Root | 5 | 364.349 | 115.12 | <0.0001 | |
Tab. 3 - Correlation (Pearson) among salinity level and nitrogen, phosphorus, potassium and sodium in different parts of Xylocarpus granatum seedlings (Values are means of three replicates with six seedlings per replicate and p<0.05).
| Elements | Plant Parts | |||
|---|---|---|---|---|
| Leaf | Bark | Stem | Root | |
| N | -0.97 | -0.95 | -0.93 | -0.97 |
| P | -0.82 | 0.38 | -0.71 | -0.95 |
| K | -0.97 | -0.91 | -0.95 | -0.86 |
| Na | 0.89 | 0.99 | 0.99 | 0.99 |
Discussion
Higher survival of seedlings was observed in non-saline to slightly saline conditions (0 to 5 PSU), and the survival percentage was reduced with increased salinity, similar to the findings of Ball et al. ([4]), Houle et al. ([14]), and Nandy et al. ([31]). Higher survival in non-saline to slightly saline conditions suggests that salt is not a requirement for the growth of a mangrove species such as X. granatum ([18]). Beyond the salinity 25 PSU, no seedlings survived, and as a result, salinity over 25 PSU was considered a threshold for the survival of X. granatum species (Fig. 2a). Similarly, Ye et al. ([44]) found lower survival for Aegiceras corniculatum at 25 PSU, and Chen & Ye ([7]) found 25 PSU salinity to be lethal for Excoecaria agallocha.
Reduced leaf production, decreased specific leaf area and increased leaf senescence with increased salinity is in accordance with the findings of Ball & Pidsley ([6]) and Chen & Ye ([7]). Leaf area reduction is considered to be the immediate response to salt stress ([35], [37]). Increased salt concentration leads to an increase in leaf shedding, as it is one of the mechanisms used by halophytes in high salinity conditions ([19]) to remove excess salt. The accelerated leaf senescence and mortality of X. granatum seedlings at 25 PSU was accompanied by little leaf production, resulting in negative foliage gain over time. This suggests that although they survived the duration of the experiment, older seedlings of X. granatum cannot survive at this salinity in the long term.
Differences in N, P, K and Na in various seedling parts in our study are similar to the findings of Mahmood et al. ([26]). Nitrogen, P and K are more abundant in leaves as they are physiologically active and help in photosynthesis ([25], [42]). The higher amount of K in leaves suggests that K is a principal element responsible for osmotic adjustment, which contributes to the salt regulation mechanism ([43]). The higher concentration of Na in leaves of X. granatum contradicts the findings of Taffouo et al. ([42]) for Citrullus lanatus and Cucurbita moschata in Cameroon. This variation may represent species-specific accumulation of salt in their leaves. Additionally, as a salt accumulator, X. granatum ([34]) may expel excess salt by dropping leaves ([29]), which is also supported by the results from our leaf demography study.
Nutrient imbalance in plants due to salinity stress ([12]) may be attributed to reduced leaf numbers and leaf area ([6], [41]), which implies that the productivity of the plant is affected by salinity ([10]). The reduction in nutrient concentrations (N, P and K) corresponding with increasing salinity may indicate a barrier provided by salinity to the uptake and accumulation of nutrients, or affect nutrient partitioning within the plant ([9]). However, the extent of this relationship varies with species and plant parts ([12]). Nonetheless, no variation in P of bark and stems with respect to salinity may be due to ontogeny, salinity level or species-specificity ([12]). The antagonistic relationship among sodium and potassium found in the present study suggests that sodium inhibited the uptake of potassium ([26]).
Reduced growth associated with increasing salinity was also reported with Ceriops australis and C. decandra in Australia ([5]), H. fomes in Bangladesh ([26]), and A. germinans in Venezuela ([22]). Further, Ye et al. ([44]) found a significant increase of RGR from 0 to 5 PSU, with a significant decrease in RGR at salinities over 15 PSU; the highest value was at low (5 PSU) to moderate salinities (15 PSU) for three salt-secreting mangrove species (Acanthus ilicifolius, Aegiceras corniculatum and Avicennia marina). However, we found no significant difference from 0 to 5 PSU salinity both in survival percentage and RGR in our study, which may be attributed to the efficiency of salt regulation up to 5 PSU by the plants.
Nutrients are essential to perform different physiological functions (such as respiration, transpiration and photosynthesis) of plants ([28]). High salinity affects plant growth through sodium induced toxicity or by causing nutrient deficiency/disorder or a combination of those factors ([21]). This could be the reason we observed higher RGR at 0 to 5 PSU salinity and vice versa. Ball & Pidsley ([6]) observed similar results while studying Sonneratia lanceolata. Thus, we can conclude that salinity is a critical factor for the development, survival and growth of mangrove seedlings and that the effect of salinity depends on the species-specific salt tolerance range ([14], [31]). In low salinity conditions, mangroves usually deploy most of their energy for growth and development. Conversely, most of the energy is utilized for survival at higher salinities ([41]) to help develop salinity-induced physiological changes ([30]). These changes could be the reason we observed comparatively higher survival and growth of X. granatum seedlings at lower salinities.
Conclusion
Salinity is a driving factor for the survival, growth, development and nutrient partitioning in plant parts of mangrove species. The studied species is known as a moderated salt tolerant species in the Sundarbans. However, climate change consequences (sea level rise, change in rainfall amount and pattern, saline intrusion due to the withdraw of fresh water flow from the upstream of the Sundarbans) may lead to increase the salinity in the studied area. The increase in salinity up to more than 25 PSU in the Sundarbans may cause threat on the natural regeneration and recruitment of this species. Therefore, sustainable flow of fresh water in the Sundarbans may protect the extinction of this species from its habitat.
Acknowledgements
We are thankful to United States Department of Agriculture (USDA) for their financial support; Ministry of Education and University Grants Commission, Bangladesh for their monitoring and smoothing the project activities. We also acknowledge the Sundarbans East Forest Division, and Forestry and Wood Technology Discipline, Khulna University for the logistic support.
References
Gscholar
Gscholar
Gscholar
Gscholar
Gscholar
Gscholar
Gscholar
Gscholar
Authors’ Info
Authors’ Affiliation
Serajis Salekin
Hossain Mahmood
Forestry and Wood Technology Discipline, Khulna University, Khulna 9208 (Bangladesh)
Centre for Integrated Studies on the Sundarbans, Khulna University, Khulna 9208 (Bangladesh)
Corresponding author
Paper Info
Citation
Siddique MRH, Saha S, Salekin S, Mahmood H (2017). Salinity strongly drives the survival, growth, leaf demography, and nutrient partitioning in seedlings of Xylocarpus granatum J. König. iForest 10: 851-856. - doi: 10.3832/ifor2382-010
Academic Editor
Claudia Cocozza
Paper history
Received: Jan 31, 2017
Accepted: Jul 17, 2017
First online: Oct 26, 2017
Publication Date: Oct 31, 2017
Publication Time: 3.37 months
Copyright Information
© SISEF - The Italian Society of Silviculture and Forest Ecology 2017
Open Access
This article is distributed under the terms of the Creative Commons Attribution-Non Commercial 4.0 International (https://creativecommons.org/licenses/by-nc/4.0/), which permits unrestricted use, distribution, and reproduction in any medium, provided you give appropriate credit to the original author(s) and the source, provide a link to the Creative Commons license, and indicate if changes were made.
Web Metrics
Breakdown by View Type
Article Usage
Total Article Views: 51740
(from publication date up to now)
Breakdown by View Type
HTML Page Views: 42485
Abstract Page Views: 3367
PDF Downloads: 4823
Citation/Reference Downloads: 20
XML Downloads: 1045
Web Metrics
Days since publication: 3025
Overall contacts: 51740
Avg. contacts per week: 119.73
Article Citations
Article citations are based on data periodically collected from the Clarivate Web of Science web site
(last update: Mar 2025)
Total number of cites (since 2017): 13
Average cites per year: 1.44
Publication Metrics
by Dimensions ©
Articles citing this article
List of the papers citing this article based on CrossRef Cited-by.
Related Contents
iForest Similar Articles
Research Articles
Two Populus deltoides W.Bartram ex Marshall clones cope differentially with sodium salinity stress
vol. 18, pp. 259-266 (online: 10 October 2025)
Research Articles
Links between phenology and ecophysiology in a European beech forest
vol. 8, pp. 438-447 (online: 15 December 2014)
Research Articles
Relationships between leaf physiognomy and sensitivity of photosynthetic processes to freezing for subtropical evergreen woody plants
vol. 12, pp. 551-557 (online: 17 December 2019)
Research Articles
Leaf transpiration of drought tolerant plant can be captured by hyperspectral reflectance using PLSR analysis
vol. 9, pp. 30-37 (online: 05 October 2015)
Research Articles
Effect of salt and drought on growth, physiological and biochemical responses of two Tamarix species
vol. 8, pp. 772-779 (online: 25 March 2015)
Research Articles
Calibration of a multi-species model for chlorophyll estimation in seedlings of Neotropical tree species using hand-held leaf absorbance meters and spectral reflectance
vol. 9, pp. 829-834 (online: 17 May 2016)
Research Articles
Gas exchange characteristics of the hybrid Azadirachta indica × Melia azedarach
vol. 8, pp. 431-437 (online: 17 December 2014)
Research Articles
Evergreen species response to Mediterranean climate stress factors
vol. 9, pp. 946-953 (online: 07 July 2016)
Research Articles
Successional leaf traits of monsoon evergreen broad-leaved forest, Southwest China
vol. 10, pp. 391-396 (online: 16 March 2017)
Research Articles
Drought tolerance in cork oak is associated with low leaf stomatal and hydraulic conductances
vol. 11, pp. 728-733 (online: 06 November 2018)
iForest Database Search
Search By Author
Search By Keyword
Google Scholar Search
Citing Articles
Search By Author
Search By Keywords
PubMed Search
Search By Author
Search By Keyword

