Application of machine learning models and Euclidean distance to predict soil spatial properties
iForest - Biogeosciences and Forestry, Volume 19, Issue 3, Pages 186-194 (2026)
doi: https://doi.org/10.3832/ifor4758-018
Published: Jun 02, 2026 - Copyright © 2026 SISEF
Research Articles
Abstract
Accurate estimation of the spatial properties of forest soil is essential for sustainable land management. This research aimed to map key soil properties in temperate forests using hybrid machine learning models. The integration of predictive and geostatistical techniques has gained prominence in soil science, with hybrid approaches enhancing prediction accuracy. Precise soil maps serve as a foundational resource for effective soil management, motivating the development of more accurate and cost-efficient mapping methods. We used hybrid machine-learning techniques that incorporated Euclidean distance (Dis), remote sensing (RS) data, and digital elevation models (DEM) to improve spatial predictions. We hypothesized that integrating Euclidean distance data into predictive models would boost the accuracy of soil property maps. Model performance was evaluated using root-mean-square error (RMSE), coefficient of determination (R²), mean absolute error (MAE), and concordance correlation coefficient (CCC). The hybrid RF+GA+Dis model offered the highest accuracy for predicting soil organic carbon (RMSE = 1.810, R2 = 0.763, MAE = 1.883, CCC = 0.803), with similar improvements observed for soil nitrogen, organic carbon stock, bulk density, calcium carbonate, and soil texture. Hybrid models consistently demonstrated a superior performance over individual machine learning methods such as Random Forest (RF) and Genetic Algorithm (GA). Incorporating ancillary data, especially from DEM and RS, substantially ameliorated prediction accuracy for soil physicochemical properties. Among the tested models, those using a broader range of covariates demonstrated a superior performance, with RF+GA+Dis outperforming RF+Dis. These findings confirm that integrating machine learning with comprehensive spatial data is a cost-effective and reliable approach for generating high-resolution soil maps, facilitating precision land management and informed decision-making. This highlights the value of hybrid modeling and diverse covariates in advancing soil property prediction.
Keywords
Machine Learning, Euclidean Distance, Forest Soil, Ancillary Data
Introduction
Studies on forest soil physicochemical properties are essential because they reflect the influence of plant communities, root systems, and litterfall on soil characteristics ([53], [34], [16]). Further, plant communities have different effects on soil microorganisms ([27]), which, in turn, influence the soil properties, including organic matter decomposition and nutrient availability ([53]). Meanwhile, forest soils contain a considerable amount of carbon and organic matter. Thus, it is essential to understand soil properties and identify the impact of management on forest resources ([35], [2], [26]).
Different ecosystems, each characterized by unique conditions and plant species, contribute to variations in soil properties. Accordingly, researchers strive to understand these properties and the factors that drive their changes ([48]). Nevertheless, due to the complexity and wide range of influencing factors, examination of soil physicochemical properties is often time-consuming and expensive. As such, there is a growing demand for efficient techniques to estimate the spatial variability of soil properties.
The importance of soil spatial properties lies in their sensitivity to factors such as bedrock composition ([13]), land use ([56]), human activities ([33]), and runoff ([18]). Nevertheless, spatial properties of plant species could also be derived from soil nutrient properties ([56], [22]). Hence, given the interaction between plants and soil, soil spatial property studies could identify potential lands for afforestation ([56]) and provide information about the presence or absence of plant species.
In current soil science research, geostatistics and soil map production constitute critical aspects that not only serve as fundamental requirements for monitoring soil physicochemical properties but also help identify optimal soil sampling locations ([38]). Machine learning has gained substantial traction across various scientific fields ([54]). This popularity stems from the machine learning ability to generate soil property prediction maps with greater accuracy than traditional geostatistical methods, such as ordinary kriging. Further, combining machine learning with ordinary kriging yields even more accurate results ([52]). Nowadays, machine learning methods are widely regarded as promising for generating accurate soil maps worldwide. They have provided accurate maps of soil organic carbon ([44]), soil particle maps ([23]), and different soil types ([29]).
Among hybrid geostatistical models, regression kriging is particularly noteworthy, as it merges soil property data with DEM and remote sensing information ([10]). Regression kriging and kriging artificial neural networks are widely employed in hybrid geostatistical modeling ([9], [19]). Regression kriging, in particular, excels in estimating soil organic carbon and nitrogen in large-scale, homogenous ecosystems ([1]). RF can accurately predict soil organic carbon quantity ([44]). In addition, machine learning is an effective technique, not only for ascertaining soil properties and degradation ([43]), but also for studying soil nutrient recovery in plantations ([42]).
The application of machine learning models in soil science is most evident in digital soil mapping and the analysis of infrared spectral data, enabling more precise predictions of soil types and properties ([40]). Machine learning methods consistently outperform traditional soil mapping approaches ([61]). This combination of machine learning and geostatistics marks a significant contribution to advancing soil science, offering a promising pathway to improved soil monitoring and management. Despite advances in machine learning algorithms and software packages, there is no single best general algorithm for mapping soil properties. Accordingly, researchers continue to develop improved, compatible, and cost-effective algorithms.
The combination of predictive and geostatistical methods has become increasingly popular in soil science, with hybrid methods proving effective in improving the accuracy of soil property predictions ([49], [8], [59]). In light of these developments, digital soil mapping (DSM) has evolved to enhance accuracy and refine methodologies. Accurate soil maps provide a fundamental framework for soil management, prompting researchers to seek more precise and cost-effective mapping techniques. This study aims to generate accurate soil maps by applying hybrid machine learning methods that integrate distance data (particularly Euclidean distance) with remote sensing and digital elevation model (DEM) data. Through integrating these diverse data sources with machine learning models, this approach aims to enhance the selection of optimal methods for generating soil maps with reduced error ([52]). We hypothesize that incorporating Euclidean distance data into predictive models improves the spatial mapping of soil properties. In addition, combining Euclidean distance, remote sensing, and DEM data with machine learning models is suggested as the most effective approach for predicting soil properties in temperate forests.
Materials and methods
Study site
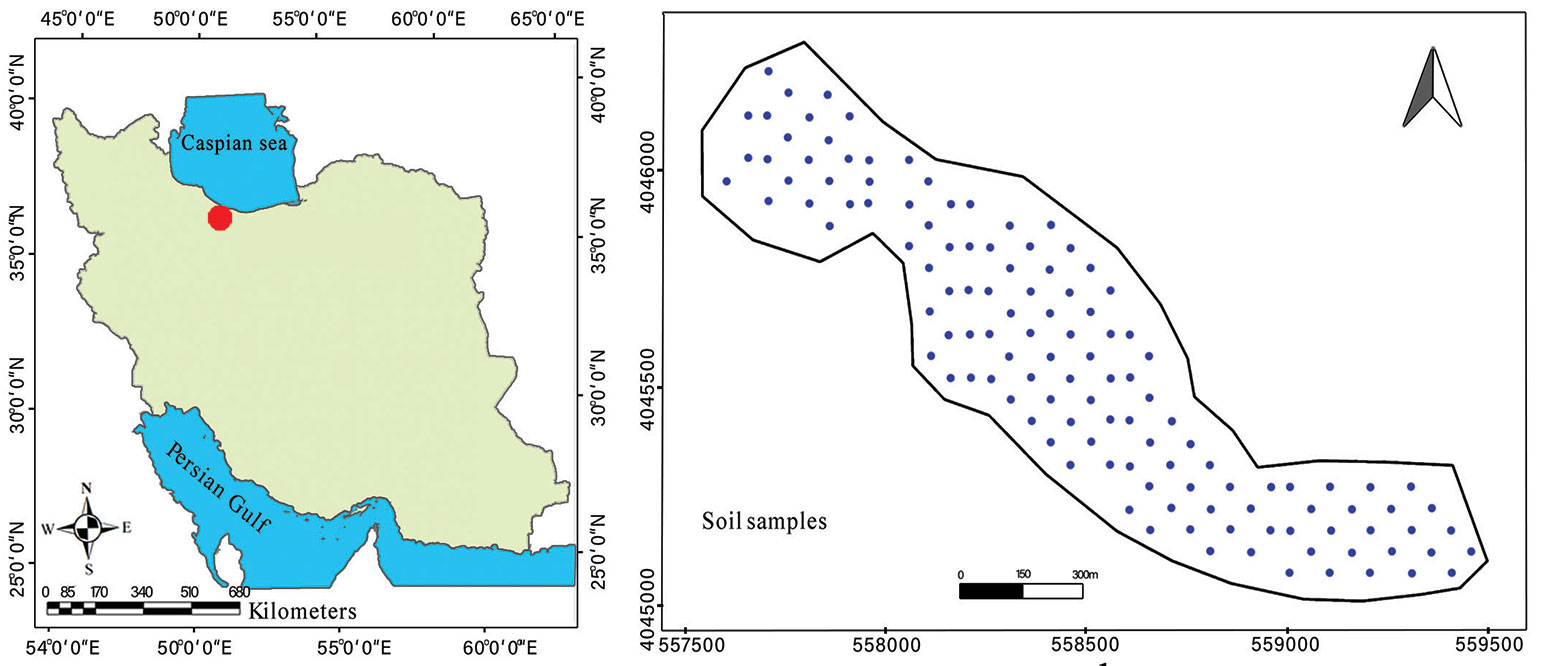
The study site was located in Kheyrud Experimental Forest at the University of Tehran, Mazandaran province, northern Iran. This forest covers 8.000 ha and is located at a latitude of 36° 27′ N to 36° 40′ N and a longitude of 51° 32′ E to 51° 43′ E (Fig. 1). The mean annual temperature is 8.6 °C, and the annual precipitation is 1380 mm. Two uneven-aged parcels (236 and 327) dominated by Fagus orientalis were chosen in the present study. Other species, including Carpinus betulus and Acer velutinum, were recorded at the studied sites ([47]). This site was selected because it is similar to North American and East Asian temperate forests but has lower levels of human disturbance and exploitation ([46]).
Fig. 1 - Location of the study site (left panel, in red) and spatial distribution of sampling points (right panel, blue dots).
Soil sampling and analysis
Soil sampling was performed using a regular grid design with a spacing of 100 × 50 m. A total of 126 soil samples were collected from the 0-10 cm mineral soil layer, following removal of surface litter and woody debris. The samples were air-dried and subsequently prepared for physicochemical analysis. The contents of soil nitrogen ([6]), potassium ([31]), phosphorus ([39]), and soil organic carbon ([55]) were determined. In addition, a cylindrical metal core sampler (4.8 cm diameter by 10.1 cm high) was used to measure soil bulk density ([41]), and soil texture was also determined using a hydrometer method ([20]).
Ancillary data
Landsat-8 (30 m resolution) and Sentinel-2 (10, 20, and 60 m resolution) satellite images were utilized as ancillary data in this study, providing valuable spectral information across multiple bands that help detect variations in vegetation cover, moisture content, and mineral composition, all being crucial indicators of soil properties (Tab. 1). Sentinel-2 (10, 20, and 60 m resolution) was used to leverage the full spectral range and enhance the model performance. Prior to analysis, all bands were resampled to a resolution of 30 m using bilinear interpolation to ensure spatial consistency with our soil sampling grid. This approach aligns with current practices in digital soil mapping, where spectral richness often outweighs small variations in native spatial resolution, especially at local-to-regional scales ([24], [57]). The use of multiple bands with varying resolutions enables the inclusion of valuable information, such as vegetation indices, soil brightness, and moisture content, which are key factors influencing soil properties. In addition to these spectral datasets, DEM data, including slope and Euclidean distance, were incorporated. Slope data are necessary for understanding soil erosion and deposition patterns, as well as hydrological processes, which significantly influence soil nutrient distribution. Euclidean distance can ameliorate the soil property prediction ([50]); thus, it was used to measure the proximity of each soil sample to specific landscape features, such as streams, roads, and vegetation zones, often correlating with soil property variations owing to the influence of water flow, anthropogenic activities, and ecological transitions.
Tab. 1 - Ancillary data used for soil properties estimation.
| Terrain attributes (Name) | Terrain attributes (Name) |
|---|---|
| Analytical hill-shading | Sentinel 2.6 |
| Aspect | Sentinel 2.7 |
| Catchment Area | Sentinel 2.8 |
| Catchment Slope | Sentinel 2.9 |
| Channel Network Base Level | Sentinel 2.10 |
| Channel Network Distance | NDVI. S |
| Convergence Index | EVI. S |
| Cross-Sectional Curvature | TVI. S |
| Generalized Surface | SAVI. S |
| Gradient | LSWI. S |
| Longitudinal Curvature | Brightness Index S |
| LS-factor | Clay Index S |
| Maximum Curvature | Salinity Index S |
| Minimum Curvature | Carbonate Index S |
| Modified Catchment Area | Gypsum Index S |
| Morphometric Features | Landsat 8.1 |
| MRRTF | Landsat 8.2 |
| MRVBF | Landsat 8.3 |
| Negative Openness | Landsat 8.4 |
| Plan Curvature | Landsat 8.5 |
| Positive Openness | Landsat 8.6 |
| Profile Curvature | NDVI. L |
| Relative Slope Position | EVI.L |
| Slope | SAVI.L |
| Topographic Wetness Index | NDMI.L |
| Topographic Wetness Index 1 | COSRI. L |
| Total Catchment Area | Brightness Index L |
| Valley Depth | Clay Index L |
| Wind Effect | Salinity Index L |
| Sentinel 2.1 | Carbonate Index L |
| Sentinel 2.2 | Gypsum Index L |
| Sentinel 2.3 | - |
| Sentinel 2.4 | - |
| Sentinel 2.5 | - |
We employed a 30 m-resolution DEM derived from the Shuttle Radar Topography Mission (SRTM) because our target soil maps were generated at 30 m resolution. Various modeling scenarios were developed and tested to optimize soil property prediction. The modeling scenarios were designed to systematically assess the contribution of different covariate sets to model performance and to test the hypothesis that including spatial metrics, such as Euclidean distance, improves prediction accuracy. In digital soil mapping (DSM), scenario-based testing is a recognized approach to exploring the relative importance of different covariate groups and their interactions ([37]). The introduction of Euclidean distance in the latter scenarios was informed by studies showing that it accounts for spatial relationships between soil samples and landscape features, often exhibiting strong spatial autocorrelation with soil properties ([3]).
The first scenario used a random forest (RF) model in conjunction with ancillary data (satellite images and DEMs). The second scenario introduced a hybrid model that integrates random forest with a genetic algorithm (GA) and ancillary data (satellite images and DEM). The third scenario used an RF with extended ancillary data, incorporating satellite images, DEMs, and Euclidean distances. The final scenario employed a hybrid model that combined RF, GA, and extended ancillary data (satellite images, DEM, and Euclidean distance). By incorporating Euclidean distance data, the third and fourth scenarios aimed to capture the spatial variability associated with proximity to landscape features. After ascertaining the results across these four scenarios, the best-performing model was selected to generate the soil property maps.
Machine learning models
The genetic algorithm is an optimization technique based on natural selection and genetic principles, inspired by the biological process of evolution and demonstrating Darwin’s theory of survival ([32]). The integration of GA with geographic information systems (c) considerably enhances data analysis ([28]). By selecting the most relevant variables, GA improves predictive model performance ([58]). This technique has been widely applied in soil classification and property mapping ([58], [52]) because of its robustness and ability to avoid local minima ([14]).
The RF model, on the other hand, employs an ensemble of classification and regression trees to improve predictive accuracy and reduce overfitting ([5]). As a tree-based model, it identifies the most informative variable at each node split, making it resilient to outliers. This robustness, speed, and ease of use make random forest a preferred method in predictive modeling ([11]).
Despite the performance of machine learning models in predicting soil properties, we need more alternatives to generate more accurate maps ([60]). Hence, in addition to standalone RF and GA models, this study also utilized two hybrid machine learning methods: (i) Random Forest combined with Distance (RF+Dis): Incorporates Euclidean distance data to improve spatial variability prediction; (ii) Random Forest combined with Genetic Algorithm and Distance (RF+GA+Dis): Integrates GA for variable selection and Euclidean distance data to optimize the prediction of soil properties.
The inclusion of Euclidean distance is a recent method that causes spatial autocorrelation, thus generating more accurate digital soil maps ([3]). Hence, the hybrid models used in the present study leverage the strengths of both GA and RF to improve predictive accuracy, particularly for mapping spatial variations in soil properties.
The performance of each studied model was judged by RSME, MAE, R2, CCC, and error. These parameters are defined as follows eqn. 1 - eqn. 4):
where n represents the number of samples; Oi and Pi denote observed and predicted soil variables, respectively; O′ and P′ show the means for the observed and predicted soil variables, respectively; variances of observed and predicted values are represented by σo and σp.
K-fold cross-validation techniques (10-fold cross-validation) were applied for model validation ([24]). Cross-validation is a robust method for evaluating model performance, ensuring that all available samples are used for both training and testing. In K-fold cross-validation, the dataset is randomly split into K equally sized subsets, or folds. Along each iteration, one fold is used as the test set, while the remaining K-1 folds are utilized as the training set. This process is repeated K times, ensuring that each fold is utilized as the test set exactly once. The performance metrics from each K iteration are then averaged to provide a comprehensive assessment of the model’s accuracy. Using all data points for training and testing, this method ensures that multiple samples and scenarios are ascertained to lower the risk of overfitting and provide a more accurate measure of generalization. Cross-validation is essential for mitigating overfitting since the model is trained and tested on different subsets of the data, helping identify models that may perform well on the training set but poorly on unseen data. It also provides a more reliable estimate of model performance than a simple train-test split, by averaging the results over multiple iterations. It also aids in optimal model selection by comparing the performance across different models or parameter configurations. Overall, K-fold cross-validation enhances the reliability and generalizability of predictive models, ensuring that the selected models accurately forecast soil properties across diverse landscapes.
Further, we employed 2500 trees (ntree = 2500), with the mtry value optimized via cross-validation (typically set to the square root of the number of predictors) in the RF model. A population size of 50, crossover probability of 0.8, mutation rate of 0.01, and a maximum of 100 generations were applied in GA. Since the RF model is not sensitive to variable scaling, and categorical variables were not included, no standardization was applied. Nevertheless, all continuous covariates were checked for outliers and normalized if extreme values were present, to avoid bias in interpreting feature importance.
The entire data analysis and modeling was performed using the R programming language (version 4.2.2). We used the “randomForest” package for RF modeling and the “GA” package to implement the genetic algorithm. Data preprocessing and visualization were performed using packages such as “caret”, “raster”, and “ggplot2”.
Results
Soil properties overview
Our results revealed that the mean soil nitrogen content at the study site was 0.31% (Tab. 2), whereas the mean soil organic carbon (SOC) was 7.7%. The average soil calcium carbonate (CaCO2) content was 1%, and the mean soil bulk density was 1.38 g cm-3, with values ranging from 1.16 to 1.66 g cm-3 (Tab. 2). The mean percentages of soil clay, silt, and sand were 24.8%, 31.6%, and 43.5%, respectively (Tab. 2). The mean soil carbon stock (SCS) was 107.5 tons per hectare, ranging from 22.6 to 203 t ha-1 (Tab. 2).
Tab. 2 - The summary of soil physicochemical properties in the studied site (SOCS: soil organic carbon stock).
| Soil properties | Minimum | Maximum | Mean | Std. Deviation |
|---|---|---|---|---|
| Organic carbon (%) | 1.74 | 15.40 | 7.70 | 2.53 |
| Nitrogen (%) | 0.14 | 0.70 | 0.31 | 0.09 |
| CaCO3 (%) | 0.20 | 2.30 | 1.09 | 0.39 |
| Silt (%) | 8.00 | 49.44 | 31.6 | 7.47 |
| Sand (%) | 16.96 | 84.16 | 43.55 | 12.89 |
| Clay (%) | 6.56 | 45.60 | 24.82 | 7.73 |
| Bulk density (g cm-3) | 1.16 | 1.66 | 1.38 | 0.07 |
| SOCS (ton ha-1) | 22.62 | 234.08 | 107.49 | 37.55 |
Machine learning models
Tab. 2outlines the performance results of different machine learning algorithms for soil property prediction. Model performance was evaluated using RMSE, MAE, R2, CCC, and other error metrics. Given lower error values and higher R2, our findings indicate that the hybrid model RF+GA+Dis generated the most accurate estimates of soil physicochemical properties (Tab. 3). In contrast, the non-hybrid models revealed higher error levels and lower coefficients of determination (Tab. 3). Although two hybrid models were tested in this study, the results showed that the RF+Dis model was less accurate than the RF+GA+Dis model in estimating soil properties. Nevertheless, the RF+Dis model outperformed non-hybrid models (Tab. 3).
Tab. 3 - Performances of different machine learning models in estimating soil physicochemical properties (Soil prop.). (SOC): soil organic carbon; (N): nitrogen; (BD): bulk density; (SOCS): soil organic carbon stock; (RF): Random Forest; (GA): Genetic Algorithm; (DIS): Euclidean distance.
| Soil prop. |
ML models |
RMSE | MAE | R2 | CCC | %Error | Soil prop. |
ML models |
RMSE | MAE | R2 | CCC | %Error |
|---|---|---|---|---|---|---|---|---|---|---|---|---|---|
| SOC (%) |
RF | 2.488 | 2.055 | 0.304 | 0.344 | 32.299 | Sand (%) |
RF | 13.017 | 10.970 | 0.440 | 0.480 | 29.886 |
| RF+GA | 2.432 | 2.035 | 0.507 | 0.547 | 31.570 | RF+GA | 12.644 | 10.818 | 0.511 | 0.551 | 29.029 | ||
| RF+DIS | 2.124 | 1.921 | 0.616 | 0.656 | 27.565 | RF+DIS | 10.292 | 8.922 | 0.578 | 0.618 | 23.629 | ||
| RF+DIS+GA | 1.810 | 1.883 | 0.763 | 0.803 | 23.497 | RF+DIS+GA | 8.962 | 6.190 | 0.691 | 0.731 | 20.574 | ||
| N (%) |
RF | 0.080 | 0.065 | 0.329 | 0.369 | 25.627 | Clay (%) |
RF | 8.365 | 7.102 | 0.395 | 0.435 | 33.699 |
| RF+GA | 0.078 | 0.065 | 0.527 | 0.567 | 24.966 | RF+GA | 8.290 | 7.113 | 0.524 | 0.564 | 33.399 | ||
| RF+DIS | 0.071 | 0.054 | 0.605 | 0.645 | 22.926 | RF+DIS | 6.912 | 6.007 | 0.557 | 0.597 | 27.845 | ||
| RF+DIS+GA | 0.068 | 0.047 | 0.711 | 0.751 | 21.787 | RF+DIS+GA | 5.849 | 5.393 | 0.680 | 0.720 | 23.566 | ||
| CaCO2 (%) |
RF | 0.366 | 0.309 | 0.384 | 0.424 | 33.388 | BD (gr cm-3) |
RF | 0.078 | 0.065 | 0.372 | 0.412 | 5.641 |
| RF+GA | 0.358 | 0.307 | 0.474 | 0.514 | 32.607 | RF+GA | 0.073 | 0.062 | 0.434 | 0.474 | 5.289 | ||
| RF+DIS | 0.314 | 0.293 | 0.579 | 0.619 | 28.662 | RF+DIS | 0.070 | 0.064 | 0.579 | 0.619 | 5.076 | ||
| RF+DIS+GA | 0.250 | 0.243 | 0.602 | 0.642 | 22.758 | RF+DIS+GA | 0.069 | 0.063 | 0.651 | 0.691 | 4.961 | ||
| Silt (%) |
RF | 7.197 | 5.990 | 0.327 | 0.367 | 22.765 | SOCS (ton ha-1) |
RF | 37.197 | 30.425 | 0.507 | 0.547 | 34.603 |
| RF+GA | 6.813 | 5.910 | 0.479 | 0.519 | 21.551 | RF+GA | 34.841 | 29.293 | 0.449 | 0.489 | 32.411 | ||
| RF+DIS | 6.300 | 5.521 | 0.518 | 0.558 | 19.928 | RF+DIS | 31.940 | 28.853 | 0.622 | 0.662 | 29.712 | ||
| RF+DIS+GA | 5.175 | 5.170 | 0.648 | 0.688 | 16.369 | RF+DIS+GA | 24.848 | 24.898 | 0.641 | 0.681 | 23.115 |
Hybrid model of DEM+Rs
Applying the hybrid model, incorporating DEM and RS data, yielded insightful results for forecasting various soil properties. For SOC, the wind effect was the most significant covariate in lowering estimation errors. The wind effect, often modeled using indices such as wind fetch or wind exposure, is essential for determining soil erosion and deposition patterns, thereby influencing the spatial distribution of organic matter. The brightness index (S), a measure of soil reflectance, and Sentinel 2.6, a specific spectral band from the Sentinel-2 satellite, also played significant roles in enhancing SOC predictions (Fig. 2A). The brightness index helps distinguish soil types based on surface reflectance, while Sentinel 2.6, which is sensitive to soil mineralogy, aids in capturing variations in soil organic content. On the contrary, Sentinel 2.8 and NDVI.S (Normalized Difference Vegetation Index for Sentinel) contributed the least to mitigating the estimation error. This suggests that vegetation cover, as represented by NDVI, and certain spectral bands are less effective in SOC prediction within this hybrid model.
Fig. 2 - Variables for soil physiochemical properties in the hybrid model DEM+RS (A: soil organic carbon; B: soil nitrogen; C: soil calcium carbonate; D: soil silt; E: soil sand; F: soil clay; G: bulk density; H: soil carbon stock).
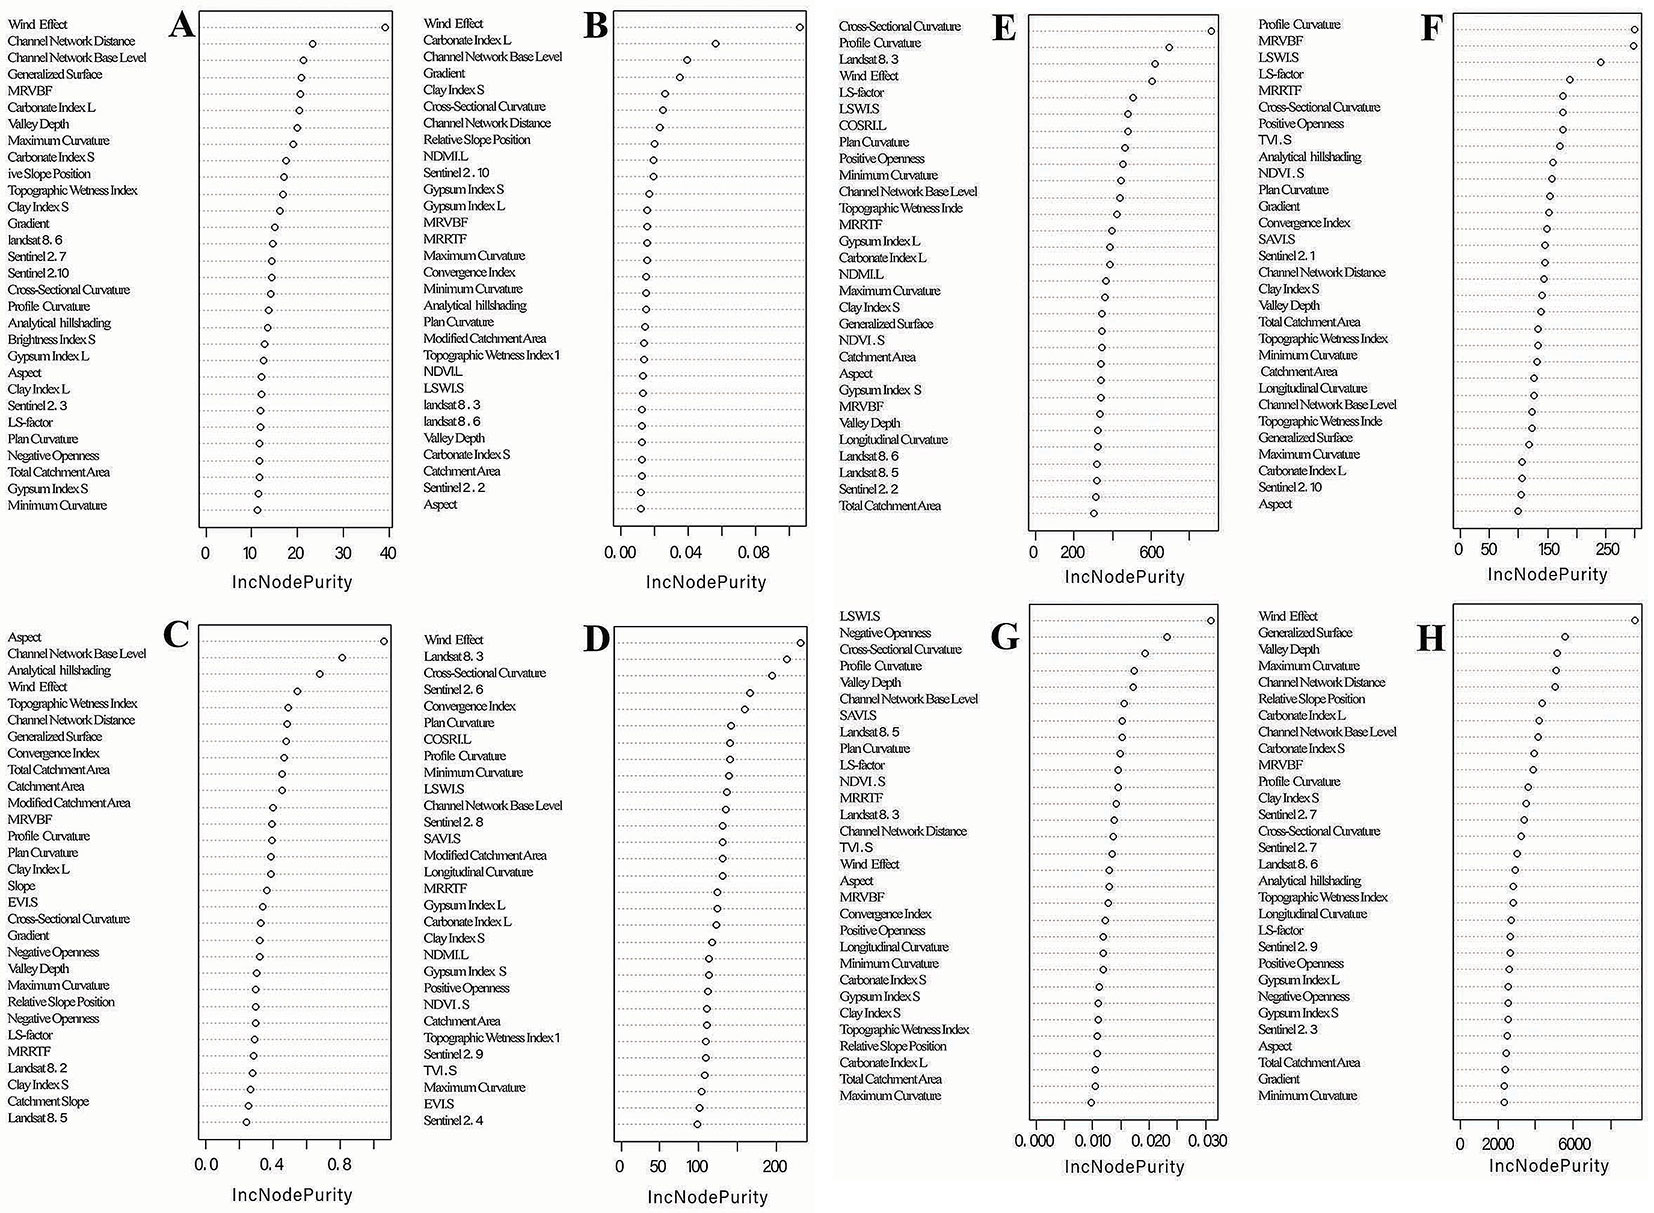
In soil nitrogen (N) prediction, the wind effect remained the most influential variable given its impact on soil nutrient redistribution through erosion and deposition (Fig. 2A). Normalized Difference Moisture Index for Landsat (NDMI.L) and aspect, which represents the directional slope of the terrain, had minimal influence on nitrogen estimation. The channel network base level (CNBL), representing the hierarchical position of streams, and aspect significantly ameliorated the estimation of soil CaCO2 by reflecting landscape drainage and aspect-induced microclimatic variations (Fig. 2A). On the other hand, the modified catchment area (MCA), indicating drainage areas, and profile curvature, measuring slope convexity and concavity, contributed little to error reduction. Sentinel 2.6 and Sentinel 2.9 were identified as the most effective covariates for predicting the soil silt content (Fig. 2A). In contrast, Landsat 8.3 and profile curvature significantly lowered the prediction error for soil sand and clay, as Landsat 8.3 captures soil texture characteristics, whereas profile curvature reflects the erosional and depositional processes affecting soil texture. For soil bulk density estimation, Landsat 8.5 and NDVI.S proved highly effective in reducing prediction error, suggesting that vegetation indices and spectral bands are strong predictors of bulk density. Wind effect and CNBL were the most critical covariates in estimating soil carbon stock, given their influence on nutrient accumulation and landscape drainage patterns (Fig. 2B).
Hybrid model of DEM+Rs+Dis
Integration of the distance variable into the hybrid model further improved predictions of soil properties. For soil organic matter estimation, the wind effect remained the dominant variable, underscoring the significance of erosion and deposition patterns in organic matter distribution. The channel network base level (CNBL) and Sentinel 2.3, a spectral band that captures soil and vegetation characteristics, also significantly contributed to SOC estimation (Fig. 3A). CNBL reflects drainage patterns, while Sentinel 2.3 helps distinguish soil and vegetation types, which are closely related to SOC levels.
Fig. 3 - Variables for soil physiochemical properties in the hybrid model DEM+RS+Dis (I: soil organic carbon; J: soil nitrogen; K: soil calcium carbonate; L: soil silt; M: soil sand; N: soil clay; O: bulk density; P: soil carbon stock).
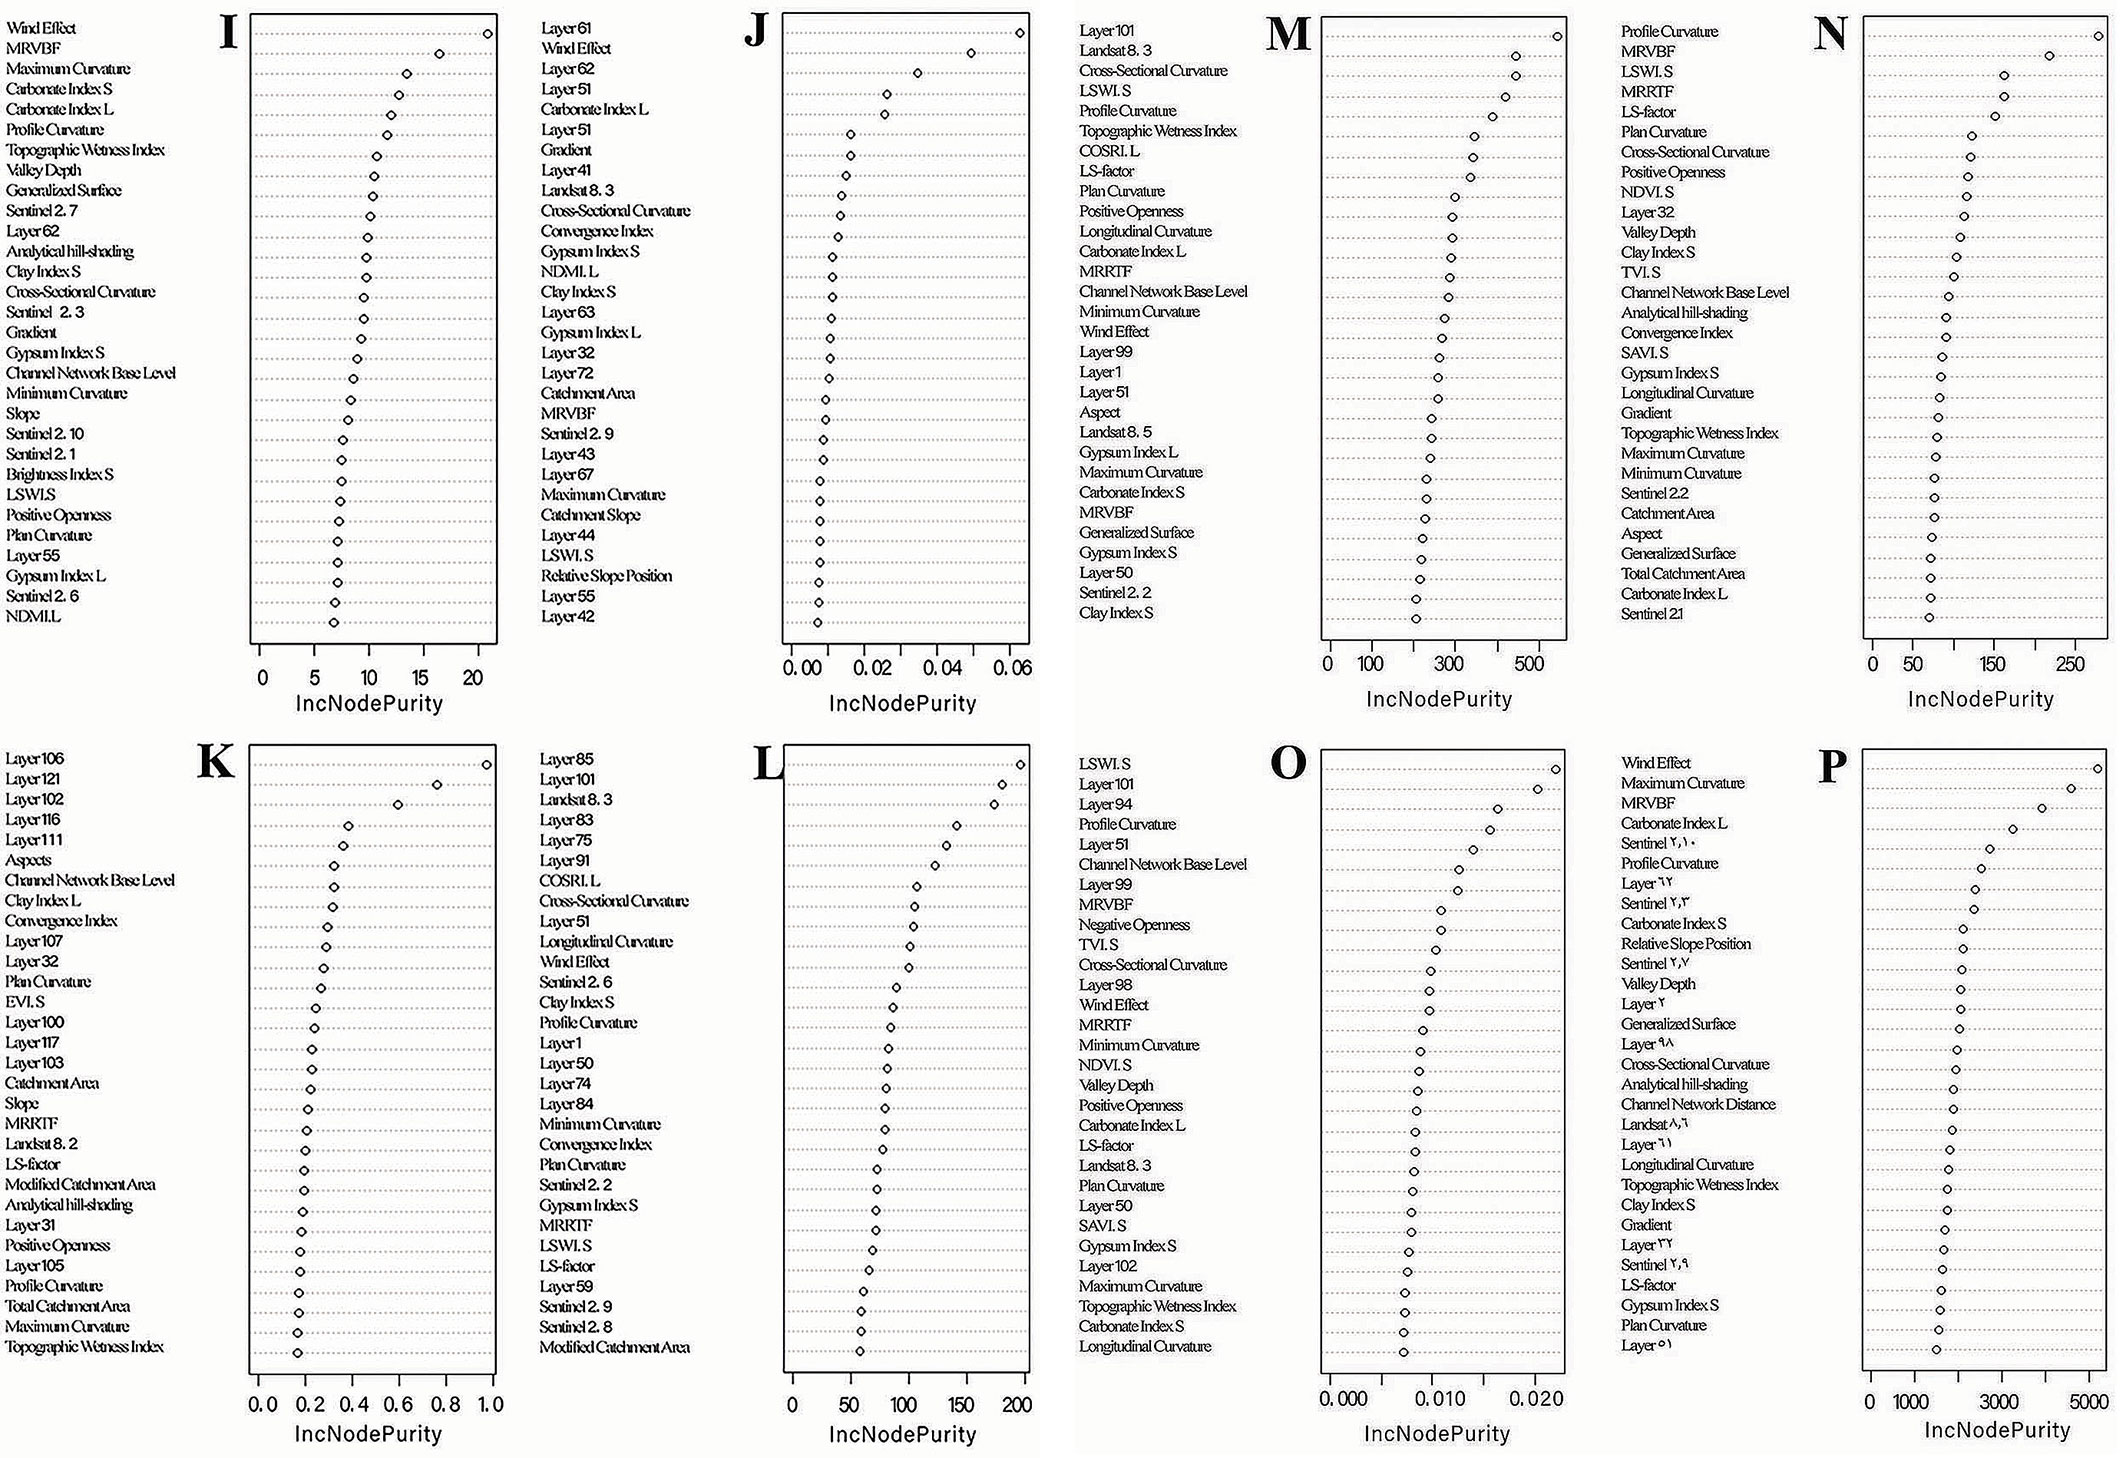
In predicting soil nitrogen, layer 61, layer 56 (spectral bands from remote sensing data), and the wind effect were the best predictors (Fig. 3A). Layers 61 and 56 capture specific spectral signatures associated with the nitrogen content. For soil calcium carbonate estimation, layers 106, 102, and CNBL were the most influential variables (Fig. 3A). Layers 106 and 102 capture mineralogical signatures correlating with CaCO2, whereas CNBL represents landscape drainage, which affects CaCO2 accumulation.
For soil silt estimation, layers 65, 91, and 83 were the most impactful in reducing error (Fig. 3A). These layers, which represent specific spectral bands, are sensitive to soil textural properties. Soil sand estimation benefited most from layer 1, Landsat 8.1, and profile curvature (Fig. 3B). Layer 1 captures soil surface characteristics, Landsat 8.1 provides texture-specific spectral information, and profile curvature reflects erosion and deposition processes that influence soil texture.
In soil clay estimation, Sentinel 2.4, Topographic Wetness Index 1 (TWI1), and CROSRI.L (Cross-Slope Roughness Index for Landsat) were the most effective variables (Fig. 3B). Sentinel 2.4 identifies clay minerals, TWI1 evaluates the soil moisture content, and CROSRI.L reflects surface roughness owing to clay dispersion.
For soil bulk density, negative openness, Landsat 8.1, LSWIS (Landsat Soil Wetness Index Sentinel), and layer 62 were identified as the most important covariates (Fig. 3B). Negative openness measures landscape concavity, affecting soil compaction, while LSWIS and layer 62 capture soil moisture and texture characteristics. For soil carbon stock estimation, layer 62 and the wind effect emerged as the most crucial variables (Fig. 3B). Layer 62 presents spectral data associated with the soil organic content, and the wind effect influences the distribution of soil organic carbon through erosion and deposition processes.
Soil physicochemical spatial estimation
Given the superior predictive performance of the hybrid model incorporating DEM, RS, and Dis variables, comprehensive soil property maps were generated using this approach. The SOC map (Fig. 4A) indicates that the highest organic matter values are found in the southern and southwestern parts of the study area, reaching approximately 12%. In contrast, the northern, central, and eastern regions exhibited the lowest SOC levels, with values below 6%. High SOC values typically represent fertile soils rich in nutrients with better water retention, which can promote healthy plant growth. Conversely, low SOC levels can result in poor soil structure, reduced nutrient availability, and increased susceptibility to erosion.
Fig. 4 - Soil spatial property maps using a hybrid model of DEM+RS+Dis (Soil pH, organic carbon, nitrogen, and calcium carbonate; soil silt, sand, clay; bulk density; and soil carbon stock).
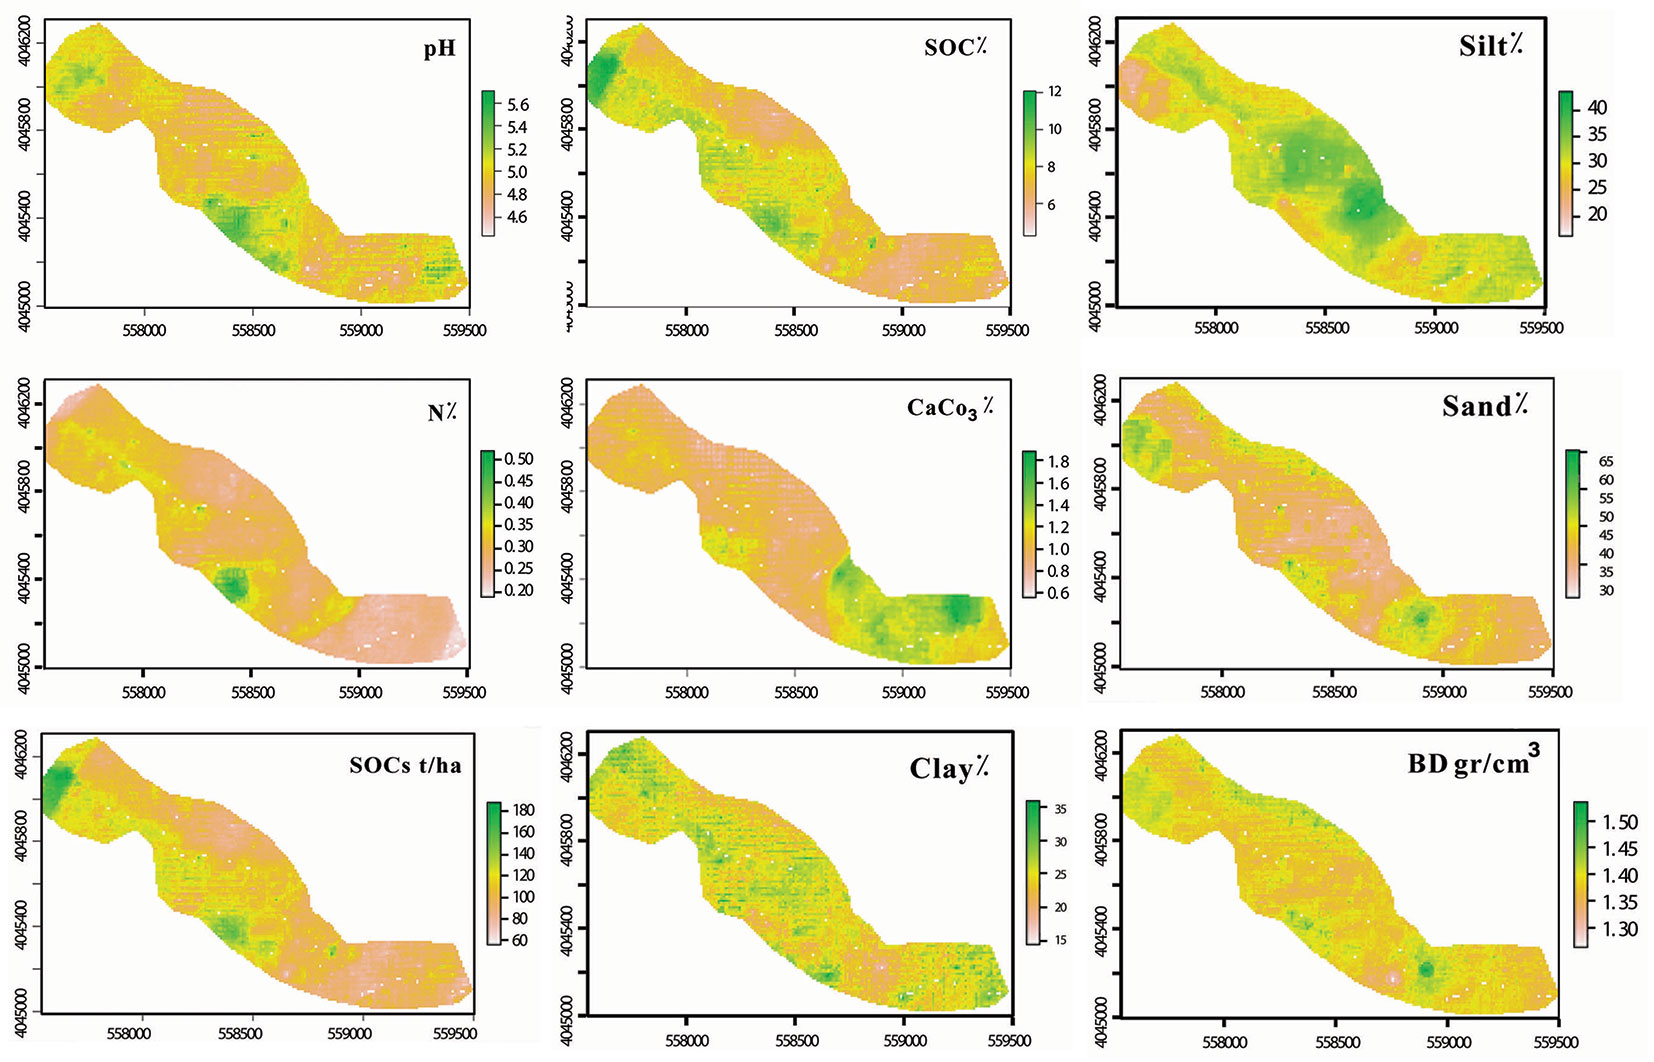
The soil nitrogen map (Fig. 4A) shows that the eastern and northern parts of the study area have the lowest nitrogen values, around 0.2%, whereas the highest levels, approximately 0.6%, are concentrated in the south-central region. High nitrogen concentrations are often linked to greater soil fertility and productivity, supporting vigorous plant growth. Conversely, excessively low nitrogen levels can lead to nutrient deficiencies, resulting in stunted growth and reduced crop yields.
Soil CaCO2 content was highest in the eastern part of the study area, exceeding 1.8% (Fig. 4A). Elevated CaCO2 levels can improve soil structure and buffer acidity, boosting overall soil health. However, excessively high levels may reflect calcareous soils, which can inhibit nutrient availability for certain crops. The soil carbon stock (SCS) map (Fig. 4B) reveals that the southwestern region of the site has had the highest values, reaching up to 180 t ha-1. High carbon stock suggests soils with abundant organic matter, thereby improving fertility, water retention, and climate change mitigation. In contrast, low carbon stock values indicate soils that are less capable of supporting sustainable agricultural practices and may require organic matter amendments.
The soil physical properties map (Fig. 4B) indicates that the central region of the study area contains the highest silt content, whereas the sand content is lowest in the same area. High silt content can improve soil moisture retention and nutrient-holding capacity, though excessive amounts can lead to poor drainage. In contrast, high sand content promotes good drainage but often causes poor nutrient retention. The highest clay content was found across the eastern, western, and central regions of the study area. Soils with high clay content typically have excellent water and nutrient retention but may also experience poor drainage and compaction.
The soil bulk density map (Fig. 4B) reveals that bulk density does not follow a specific spatial pattern, with no extensive, homogeneous areas with similar values. High bulk density generally corresponds to compacted soils, which can impede root growth, reduce water infiltration, and limit soil aeration. Conversely, low bulk density typically signifies well-structured soils that are more conducive to plant growth.
These comprehensive soil property maps, generated using the hybrid model of DEM+RS+Dis, provide critical insights into the spatial distribution of key soil attributes and serve as a valuable tool for precision agriculture, land management, and sustainable environmental practices.
Discussion
In the present study, different machine learning models and hybrid models were employed to provide spatial maps of soil properties in temperate forests. Our results revealed that the hybrid model RF+GA+Dis achieved the best performance in estimating soil properties, as evidenced by a higher coefficient of determination and lower error. Given the high accuracy of machine learning methods, scientists are increasingly applying them to generate soil property maps ([49], [51], [21], [14], [4], [61]). Hybrid models have been widely used to reduce feature dimensionality and overall costs. It seems that even a hybrid model can provide such conditions, but adding the Euclidean distance to the hybrid models can offer more accurate maps. This is because Euclidean distance can introduce spatial autocorrelation into the input data ([25], [3]).
Comparing non-hybrid machine learning models (RF and AG) with hybrid models (RF+GA+Dis and RF+Dis), non-hybrid models produced higher errors and lower coefficients of determination. This indicates the importance of using hybrid models to generate soil property maps. This finding is consistent with other studies highlighting the importance of the hybrid model for generating more accurate soil maps ([8], [52]). The need to generate highly accurate maps has long been recognized to ameliorate soil spatial property maps, and in the present study, using Euclidean distance yields more accurate maps, which is in accordance with the findings of Kim et al. ([25]).
Studies demonstrate that machine learning can generate highly accurate soil spatial properties maps ([21], [4], [61]). However, our results indicated that hybrid models can produce far better outcomes. In the present study, even hybrid models with more parameters generated more accurate maps than the hybrid model with fewer parameters. The hybrid model RF+Dis yielded less accurate results than RF+GA+Dis, but provided better results when compared to the RF and GA as separate models.
Nowadays, ancillary data are considered a significant factor in enhancing the accuracy of soil spatial maps and have been used in many studies ([15], [7]). Further, other studies have highlighted its importance in achieving better results ([30], [45]). In the present study, we used DEM and RS data as ancillary variables to predict soil properties. The best ancillary variable for predicting each soil property differed between the hybrid models. However, the wind effect was the most influential ancillary variable for predicting soil properties in both hybrid machine learning models. Ancillary data contributed to improvements in soil spatial mapping, aligning with findings from other studies ([12], [15]). Meanwhile, using RS and DEM data as ancillary inputs revealed that these datasets can yield different results in forecasting soil properties. Each ancillary variable may behave differently when predicting various soil properties, which is consistent with the findings of Mousavi et al. ([36]).
In our study, soil property mapping was performed using the hybrid model RF+GA+ Dis. According to the maps, the highest levels of soil nitrogen and organic matter were recorded in the western and southwestern parts of the study site, while the lowest levels were observed in the eastern part. This variation is attributed to differences in tree species composition. Pure Fagus orientalis stands are found in the eastern part, whereas mixed stands of Fagus orientalis and Carpinus betulus are present in the western part of the site. The differences in soil nitrogen and organic matter are a consequence of these varying tree species. This finding is consistent with the results of Habashi ([17]), who reported lower organic matter in pure Fagus orientalis stands than in mixed stands of Fagus orientalis and Carpinus betulus. The hybrid model, when combined with appropriate ancillary data, generated accurate maps, even distinguishing among different forest stand types. Our results indicate that a hybrid machine learning model, combined with Euclidean distance, can accurately predict soil properties even in temperate forests, aligning with the findings of Behrens et al. ([3]).
Conclusion
Overall, hybrid models offered significantly higher accuracy than standalone machine learning models such as RF and GA. The inclusion of ancillary data, particularly from DEM and RS, markedly boosted the predictive accuracy of soil physico-chemical properties. Among the hybrid models, those incorporating a broader range of parameters demonstrated a superior performance. Specifically, the hybrid model combining RF, GA, and Dis variables outperformed the RF+Dis model. Further, the RF+Dis hybrid model yielded better results than the individual models. Integrating machine learning models with ancillary data from DEM and RS provided a cost-effective solution for generating high-accuracy soil spatial property maps, enabling precise and sustainable land management practices. The results highlight the value of combining complementary machine learning approaches with a comprehensive set of covariates to optimize soil property predictions, paving the way for improved soil management strategies and better-informed decisions.
References
Gscholar
CrossRef | Gscholar
Authors’ Info
Authors’ Affiliation
Mostafa Moradi 0000-0002-1216-3531
Department of Forestry, Faculty of Natural Resources, Behbahan Khatam Alanbia University of Technology, Behbahan, Khuzestan (Iran)
Faculty of Agriculture and Natural Resources, Ardakan University, Yazd (Iran)
Corresponding author
Paper Info
Citation
Ansari N, Moradi M, Taghizadeh-Mehrjardi R (2026). Application of machine learning models and Euclidean distance to predict soil spatial properties. iForest 19: 186-194. - doi: 10.3832/ifor4758-018
Academic Editor
Lorenzo Mw Rossi
Paper history
Received: Nov 14, 2024
Accepted: Oct 25, 2025
First online: Jun 02, 2026
Publication Date: Jun 30, 2026
Publication Time: 7.33 months
Copyright Information
© SISEF - The Italian Society of Silviculture and Forest Ecology 2026
Open Access
This article is distributed under the terms of the Creative Commons Attribution-Non Commercial 4.0 International (https://creativecommons.org/licenses/by-nc/4.0/), which permits unrestricted use, distribution, and reproduction in any medium, provided you give appropriate credit to the original author(s) and the source, provide a link to the Creative Commons license, and indicate if changes were made.

Web Metrics
Breakdown by View Type
Article Usage
Total Article Views: 1026
(from publication date up to now)
Breakdown by View Type
HTML Page Views: 395
Abstract Page Views: 333
PDF Downloads: 264
Citation/Reference Downloads: 0
XML Downloads: 34
Web Metrics
Days since publication: 47
Overall contacts: 1026
Avg. contacts per week: 152.81
Article Citations
Article citations are based on data periodically collected from the Clarivate Web of Science web site
(last update: Mar 2025)
(No citations were found up to date. Please come back later)
Publication Metrics
by Dimensions ©
Articles citing this article
List of the papers citing this article based on CrossRef Cited-by.
Related Contents
iForest Similar Articles
Short Communications
Estimation of canopy attributes of wild cacao trees using digital cover photography and machine learning algorithms
vol. 14, pp. 517-521 (online: 17 November 2021)
Research Articles
Estimation of above-ground biomass using machine learning approaches with InSAR and LiDAR data in tropical peat swamp forest of Brunei Darussalam
vol. 17, pp. 172-179 (online: 17 June 2024)
Research Articles
Forest fire occurrence modeling in Southwest Turkey using MaxEnt machine learning technique
vol. 17, pp. 10-18 (online: 02 February 2024)
Research Articles
Exploring machine learning modeling approaches for biomass and carbon dioxide weight estimation in Lebanon cedar trees
vol. 17, pp. 19-28 (online: 12 February 2024)
Research Articles
Prediction of stem diameter and biomass at individual tree crown level with advanced machine learning techniques
vol. 12, pp. 323-329 (online: 14 June 2019)
Research Articles
Classification of xeric scrub forest species using machine learning and optical and LiDAR drone data capture
vol. 18, pp. 357-365 (online: 07 December 2025)
Research Articles
Estimating machine impact on strip roads via close-range photogrammetry and soil parameters: a case study in central Italy
vol. 11, pp. 148-154 (online: 07 February 2018)
Research Articles
Above ground biomass estimation from UAV high resolution RGB images and LiDAR data in a pine forest in Southern Italy
vol. 15, pp. 451-457 (online: 03 November 2022)
Research Articles
Local ecological niche modelling to provide suitability maps for 27 forest tree species in edge conditions
vol. 13, pp. 230-237 (online: 19 June 2020)
Research Articles
Yield of forests in Ankara Regional Directory of Forestry in Turkey: comparison of regression and artificial neural network models based on statistical and biological behaviors
vol. 16, pp. 30-37 (online: 22 January 2023)
iForest Database Search
Search By Author
Search By Keyword
Google Scholar Search
Citing Articles
Search By Author
Search By Keywords
PubMed Search
Search By Author
Search By Keyword


