Above ground biomass estimation from UAV high resolution RGB images and LiDAR data in a pine forest in Southern Italy
iForest - Biogeosciences and Forestry, Volume 15, Issue 6, Pages 451-457 (2022)
doi: https://doi.org/10.3832/ifor3781-015
Published: Nov 03, 2022 - Copyright © 2022 SISEF
Research Articles
Collection/Special Issue: Research Project PRIN-MIUR 2015
The forest-wood value chain: biomass supply, traceability, C-footprint. Innovation for bioarchitecture and energy efficiency
Guest Editors: Scarascia Mugnozza G, Maesano M, Romagnoli M
Abstract
Knowledge of forest biomass is an essential parameter for managing the forest in a sustainable way, as forest biomass data availability and reliability are necessary for forestry and forest planning, but also for the carbon market as well as to support the local economy in the mountain and inner areas. However, the accurate quantification of the above-ground biomass (AGB) is still a challenge both at the local and global levels. The use of remote sensing techniques with Unmanned Aerial Vehicle (UAV) platforms can be an excellent trade-off between resolution, scale, and frequency data of AGB estimation. In this study, we evaluated the combined use of RGB images from UAV, LiDAR data and ground truth data to estimate AGB in a forested watershed in Southern Italy. A low-cost AGB estimation method was adopted using a commercial fixed-wing drone equipped with an RGB camera, combined with the canopy information derived by LiDAR and validated by field data. Two modelling methods (stepwise regression, SR and random forest, RF) were used to estimate forest AGB. The output was an accurate maps of AGB for each model. The RF model showed better accuracy than the Steplm model, and the R2 increased from 0.81 to 0.86, and the RMSE and MAE values were decreased from 45.5 to 31.7 Mg ha-1 and from 34.2 to 22.1 Mg ha-1 respectively. We demonstrated that by increasing the computing efficiency through a machine learning algorithm, readily available images can be used to obtain satisfactory results, as proven by the accuracy of the Random forest above biomass estimation model.
Keywords
Above Ground Biomass, UAV, Random Forest, Forest Biomass, Machine Learning
Introduction
Forest biomass is one of the most important indicators of Sustainable Forest Management (SFM - [22]) and its accurate estimation has environmental, economic, and social implications. Nevertheless, its quantification still presents challenges from local to global levels. Indeed, the conventional field-based methods are labour- and time-intensive as well as generally expensive. Above Ground Biomass (AGB) accounts for 70% to 90% of total forest biomass and can be analyzed and correlated with remote sensing data ([15]). Forest inventory data integrated with remote sensing data has become a powerful technique to estimate AGB ([4]). Based on information captured by remote sensors, AGB has been correlated with ground truth for defining biomass estimation models ([20]). Particularly useful is the use of Light Detection and Ranging (LiDAR) data for defining forest attributes like tree height, which is directly linked to forest biomass ([25], [30]). In addition, the use of high-resolution RGB images has emerged as extremely functional ([37]) and highly complementary to LiDAR data ([20]). Many studies estimate AGB using remote sensing data from satellites o airborne equipped with different types of optical sensor data ([1], [20]). However, these technologies have constraints due to spatial and temporal resolution. Unmanned-Aerial-Vehicle (UAV) platforms are viable alternatives to airborne and satellite platforms, as they are characterized by low cost and an excellent trade-off between resolution, scale, and frequency data at the local level ([12]).
Several approaches using various predictor variables derived from remotely sensed images have been developed in order to improve the accuracy of estimation of AGB for different forest types and management goals ([33]). The most common method used for AGB estimation from remote sensing data is the area-based approach (ABA - [8]). The aim of the ABA is to derive a predictive model that links LiDAR metrics (X) to a target attribute measured (Y - e.g., AGB) at a specific ground location. This integrated approach tries to fill the four critical issues in the biomass estimation model from remote sensing data: (i) the sample plot number, (ii) the metrics selection, (iii) the suitable algorithms, and (iv) the model accuracy. Conventional regression techniques are commonly used to estimate AGB from remote sensing, though in the last few years the machine learning techniques are increasingly employed ([23]), as higher accuracy can be generally obtained compared with traditional methods and better ability in identifying the relationships between predictors and the AGB from field data ([2]). A huge variety of machine-learning algorithms has been investigated to estimate forest biomass, such as K-nearest neighbour (KNN - [3]), Support Vector Regression (SVR - [34]), Artificial Neural Networks (ANN - [10]), but the most widely used algorithm is the Random Forest (RF - [4]), as it does not need assumptions about the initial data and the relationships between the response variable and predictive variables.
Some previous studies have estimated forest biomass using the multi-sensor data and machine learning approach for classification and forest biomass estimation ([5]). In this study, a unique combination of LiDAR with high-resolution optical data by UAV was adopted, aiming to evaluate the accuracy of two different predictive models to estimate forest biomass. In particular, we compared the accuracy of AGB estimates obtained with a machine learning algorithm, the Random Forest (RF), with a typical stepwise linear regression model (Steplm). Using remote sensing data derived by the UAV platform we produced spatial maps of AGB for each model. The study was carried out in a forested watershed belonging to the Calabrian Apennine Mountains (southern Italy).
Materials and methods
Study area
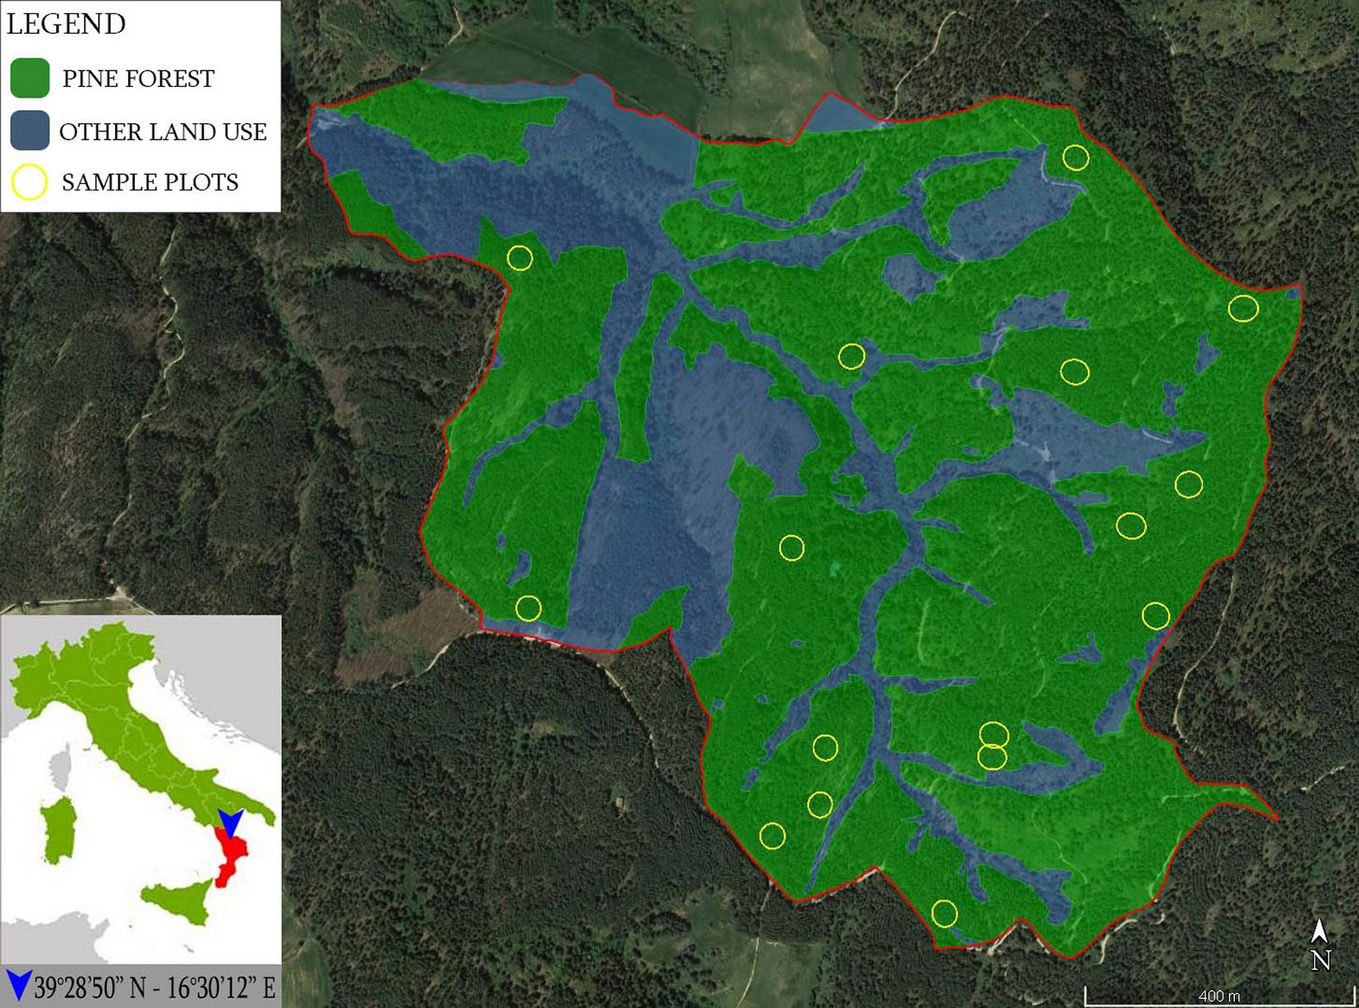
The experimental area is a mountain basin called “Bonis”, located in the Calabria Region, Southern Italy (39° 25′ 15″ N, 16° 12′ 38″ E - WGS 84). The Bonis basin covers 140 hectares with altitude ranging from 975 to 1301 m a.s.l. (average = 1129 m) and a mean slope of 40%. The mean annual precipitation is 1179 mm distributed over 99 rainy days, on average, and the mean annual air temperature is 9 °C. The forest stands in the study area are mostly pure stands of Calabrian pine (Pinus nigra ssp. laricio (Poir.) Maire) planted between 60 and 50 years ago. These stands cover about 95 hectares, while the remaining 45 hectares are composed of riparian vegetation, agricultural fields, roads, bare soil and a small portion of mixed forest, where Calabrian pine is mainly mixed with chestnut (Castanea sativa Mill) and alder (Alnus glutinosa [L.] Gaertn). The study presented in this paper is focused only on the pure pine forests (Fig. 1).
Field data
Field data were collected within 16 circular inventory plots located in the Calabrian pine pure forest. The distribution of the inventory plot was chosen at random. Each plot centre was georeferenced through a global navigation satellite system (GNSS) receiver. Real-Time Kinematic GPS (RTK-GPS) Leica CS10 GNSS® (Leica Geosystems AG, Switzerland) with sub-centimetre precision was employed. Each plot was 20 m in radius (0.13 ha). Within each plot, the following parameters were measured on each individual tree: diameter at breast height (DBH), tree height (H), crown diameter (CD), and the vitality of trees with DBH>5 cm. Tree height and the width of horizontal tree crown projection were recorded using a Vertex III hypsometer and Transponder T3® (Haglöf, Sweden), while callipers were employed to measure diameters. Each sampled tree was positioned using the azimuth-distance approach from the plot center. Field data were collected in June and July 2017. Traditional forest inventory methods to calculate AGB were used, and an allometric model based on the DBH and H developed specifically for Calabrian pine was applied ([36]). The total forest AGB of the sample plots includes stems and branches.
Remote sensing data
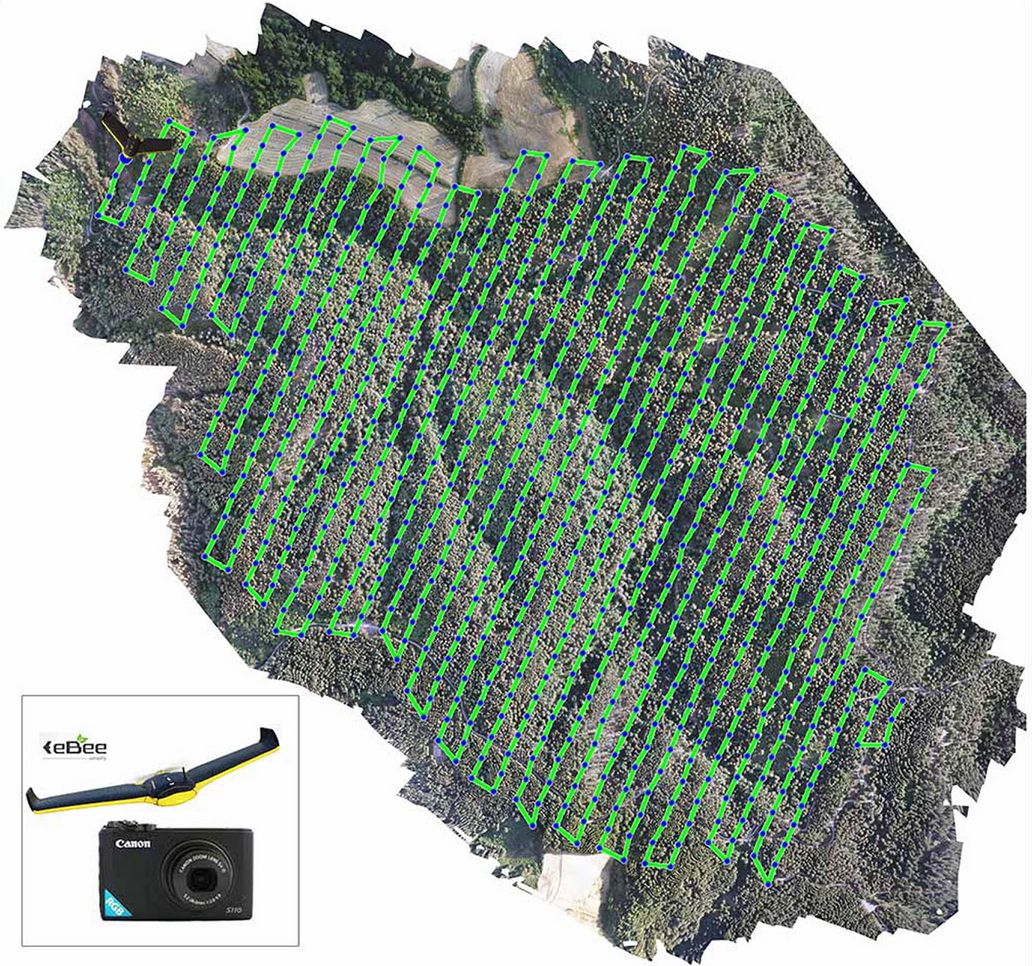
The SenseFly eBee® Ag fixed-wing UAV (Switzerland) was used for image acquisition. UAV images were collected in July 2017 using a Canon PowerShot 110® HS RGB camera (16.1 MP) with an average Ground Sampling Distance (GSD) of 6.59 cm (Fig. 2). Seven Ground Control Points (GCPs) were measured with mean RMSE error = 0.065 m accuracy. The photogrammetric point clouds provide information on the tree-top height of the forest canopy, while the Digital Terrain Model (DTM) was derived by the LiDAR campaign (summer 2017).
Fig. 2 - Flight mission trace of the eBee® drone (SenseFly, Switzerland) equipped with a Canon PowerShot 110® HS RGB camera (16.1 MP) over the study area.
The LiDAR data were acquired by a system mounted on a helicopter; laser points have been captured at angles perpendicular to the terrain (LiDAR full-waveform Riegl LMS-Q560 with frequency 400.000 Hz, FOV 60°, inclination 20°). The system was set to acquire 20 points per square meter flying at 700 meters above ground level (AGL) and geo-referenced to the projection system of the UTM zone 33N, WGS 84. The data were acquired within the ALForLab project (⇒ https://www.alforlab.it/⇒ https://www.alforlab.it/).
Remote Data Processing
Photogrammetric processing of the images was carried out through an automated system based on Structure for Motion (SfM) algorithms. The SfM workflow was implemented in the commercial software package Agisoft PhotoScan® Professional (AgiSoft LLC, Russia) to obtain 3D models from 2D images. For better results, the images were pre-processed improving colour correction, tone scale, edge enhancement and white balance. Based on this, a high-quality orthomosaic and a Digital Surface Model (DSM) were produced. The free and open-source desktop software QGIS version 3.2 ([28]) was used to define the Canopy Height Model (CHM) with a grid cell size of 6.59 × 6.59 cm using the DSM and Digital Terrain Model (DTM). To derive CHM metrics and reduce time-consuming processes, the orthomosaic and CHM layer were clipped over the sixteen sample areas in QGIS. Procedures for images segmentation and classification for extracting forest canopy in the sample areas were carried out by the software Trimble eCognition® developer v. 9.1 (Trimble GeoSpatial, Munich, Germany). Multiresolution segmentation based on Object-Based Image Analysis (OBIA) techniques was used, while a CHM mask and a Green Leaf Index (GLI) mask were employed for the forest vegetation classification. The CHM mask included the segmentation polygons taller than 5 m height, according to the Italian forest definition ([11]), while for the second mask, polygons with GLI>0 were considered. The GLI index was calculated using the following formula ([19] - eqn. 1):
where R, G, and B are the digital number (0 to 255) of red, green and blue channels, respectively. GLI index has values between -1 and +1 and the positive values are related to the green leaves. Afterwards, the classification results by eCognition® were exported in QGis and the LiDAR-derived metrics from the CHM were extracted. For each plot, we calculated twelve CHM metrics (Tab. 1).
Tab. 1 - CHM-derived metrics.
| CHM Metric | Description |
|---|---|
| H_count | Total of the pixels value |
| H_sum | Sum of the pixels value |
| H_mean | Average of the pixels value |
| H_median | Median of the pixels value |
| H_stdev | Standard deviation of the pixels value |
| H_min | Minimum of the pixels value |
| H_max | Maximum of the pixels value |
| H_range | Range of the pixels value |
| H_minority | Minority of the pixels value |
| H_majority | Majority of the pixels value |
| H_variety | Variety of the pixels value |
| H_variance | Variance of pixel values |
Above ground biomass modelling and accuracy assessment
Metric derived by CHM are candidate predictor variables (independent variables) which can be correlated with AGB calculated by field data at plot level (dependent variable in Mg ha-1) using statistical methods such as stepwise regression model (Steplm) and Random Forest (RF).
Steplm was the traditional statistical method used into the study. The stepwise method provides the inclusion of each predictor one-by-one in the model, testing whether the included variable improves the model performance based on AIC method (Akaike Information Criteria). If the addition of the variable worsens the model accuracy, the predictor is then taken out. The multicollinearity between the independent variables was estimated by the Variance Inflation Factor (VIF) using the package “car” in the R environment ([7]), and variables with VIF > 10 were discarded ([26]). Pearson’s correlation coefficient (r) was calculated between predictor variables and AGB. Global validation of linear model assumptions was performed using the package “gvlma” in R environment. To assess the prediction accuracy of the AGB estimation model obtained, the Leave-One-Out Cross-Validation method (LOOCV) was performed.
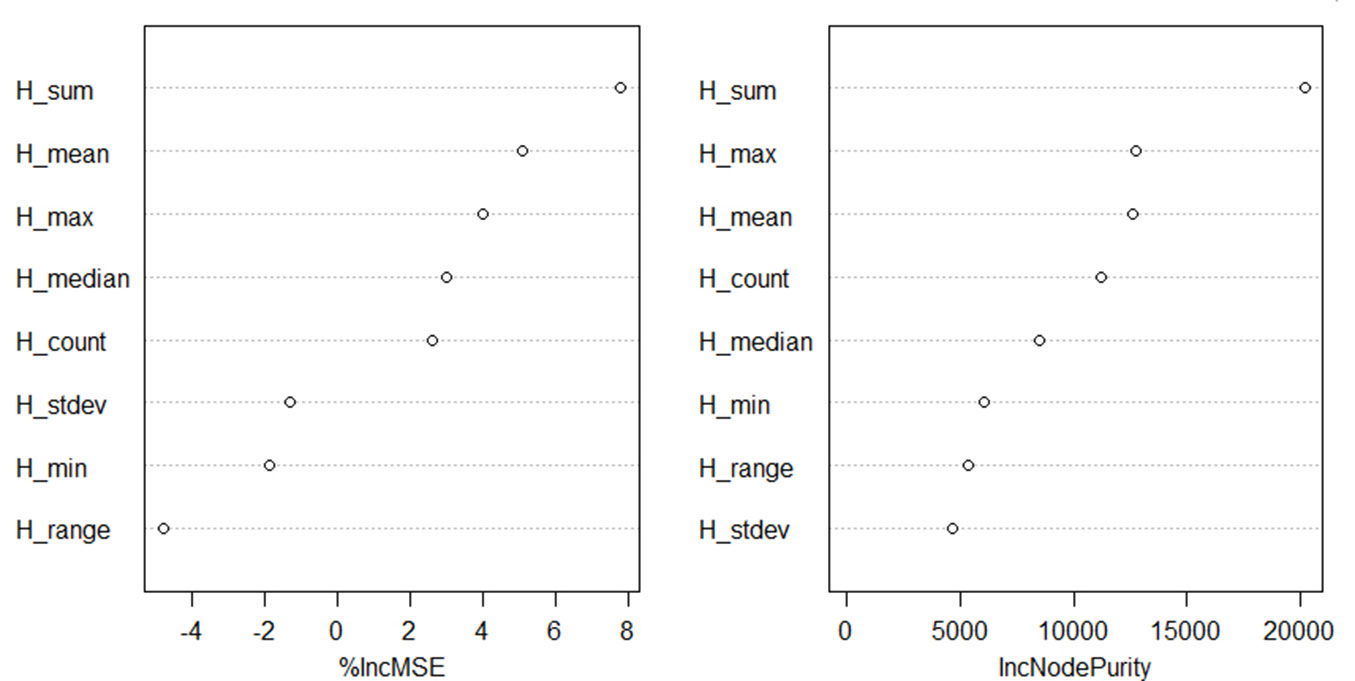
RF is a powerful non-parametric machine learning algorithm that can be used for both regression and classification. As for regression, RF generates an arbitrary number of simple trees (a subset of independent variables - CHM-derived metrics), which are used to obtain an estimate of the dependent variable (AGB). In this context, RF algorithm was applied to predict the AGB from 12 CHM-derived metrics obtained from high-resolution imagery. The 16 inventory plots were randomly split into a training dataset and validation dataset in the ratio of 70:30. The best setting of the RF model had 6 variables, 500 decision trees and 3 as the number of variables per level. In order to improve the accuracy of predicted AGB, the OOB error (out of bag) was used as the minimization criterion. For removing redundant information all CHM-derived metrics were explored and the optimal variables for forest AGB mapping were determined. To this purpose, the percentage increase in the mean-squared error (%IncMSE) and the increase in node purity (IncNodePurity) were calculated to evaluate the variable importance. The larger the %IncMSE and the IncNodePurity of a variable, the more important is the variable (Fig. 3).
Fig. 3 - Importance of variables, percentage of the increase of mean-squared error (%IncMSE, left panel) and the increase in node purity (IncNodePurity, right panel) for AGB estimation using the RF model.
Modelling and accuracy assessment of AGB estimations were conducted by applying the Steplm and RF algorithms in the R open source environment ([29]). Coefficient of determination (R2), Root Mean Square Error (RMSE) and Mean Squared Error (MAE) were calculated to compare the performance of the two algorithms.
Results
In the study site of the Bonis Basin, 1065 trees were measured in the 16 circular plots (sample areas). At the same time, high-resolution RGB images by UAV platform were collected. At the plot level, the DBH ranged from 6 to 80 cm, with an average value of 32 cm, while the tree height ranged from 4.5 to 35 m, with an average value of 24.4 m. The AGB calculated using the species-specific allometric relationships ranged from 189.82 to 527.13 Mg ha-1, with an average value of 383.09 ± 104.16 Mg ha-1 (Tab. 2).
Tab. 2 - Summary information of the sample plots surveyed. (SD): standard deviation.
| Sample Plot |
N Trees | Average DBH ± SD (cm) |
Average Height ± SD (m) |
Above Ground Biomass (Mg ha-1) |
|---|---|---|---|---|
| 1 | 66 | 33 ± 7.1 | 24.1 ± 3.1 | 434.08 |
| 2 | 52 | 35 ± 8.8 | 21.8 ± 3.3 | 376.35 |
| 3 | 51 | 28 ± 5.9 | 17.7 ± 3.1 | 189.82 |
| 4 | 84 | 30 ± 6.7 | 21.0 ± 2.9 | 404.77 |
| 5 | 72 | 34 ± 8.2 | 24.4 ± 3.4 | 527.13 |
| 6 | 45 | 32 ± 7.0 | 23.6 ± 2.3 | 281.12 |
| 7 | 68 | 32 ± 8.2 | 23.5 ± 2.5 | 419.05 |
| 8 | 76 | 30 ± 6.6 | 21.5 ± 2.5 | 372.03 |
| 9 | 81 | 30 ± 5.0 | 23.6 ± 2.3 | 434.16 |
| 10 | 74 | 36 ± 6.5 | 21.7 ± 3.0 | 516.81 |
| 11 | 90 | 30 ± 6.5 | 21.9 ± 2.8 | 466.49 |
| 12 | 48 | 36 ± 7.8 | 22.1 ± 2.5 | 360.40 |
| 13 | 72 | 31 ± 8.4 | 18.8 ± 3.2 | 343.50 |
| 14 | 41 | 32 ± 8.2 | 19.3 ± 8.2 | 222.38 |
| 15 | 51 | 33 ± 9.0 | 16.7 ± 5.4 | 259.79 |
| 16 | 94 | 31 ± 7.0 | 21.9 ± 3.0 | 521.61 |
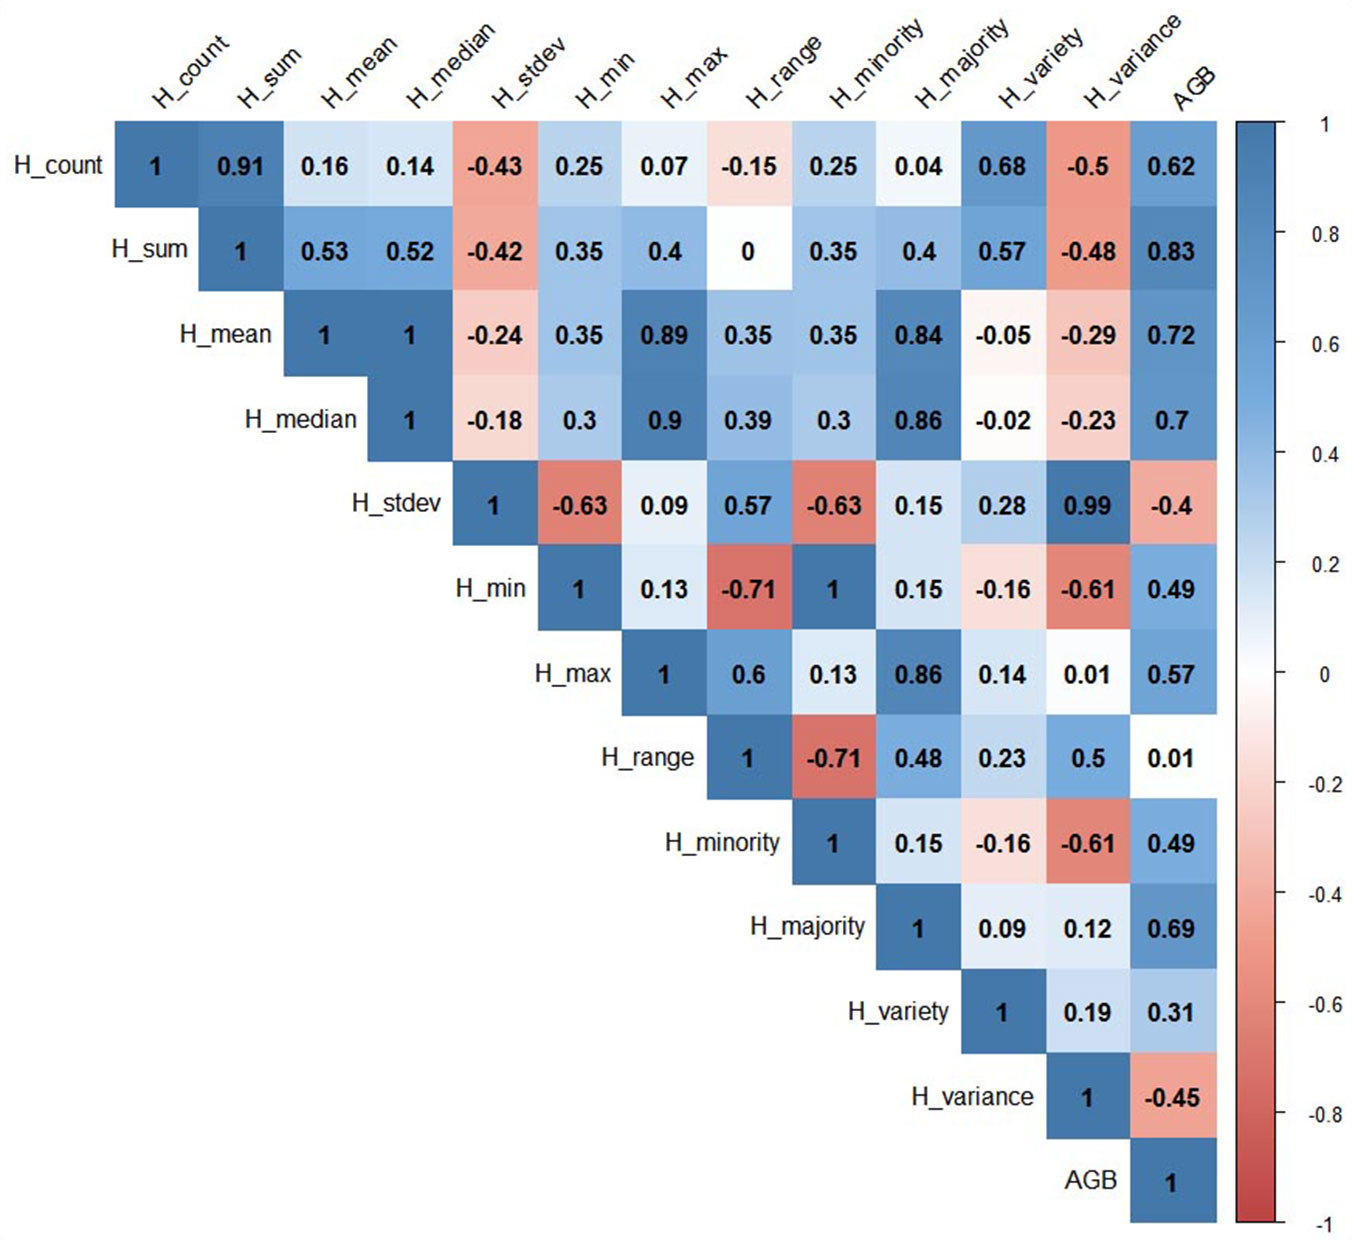
Pearson’s correlation analysis was performed to analyse the relationship between CHM-derived metrics and computed AGB from field data for each sample area. According to the goodness of fit, a strong positive relationship between AGB and H_sum (r=0.83), H_mean (r= 0.72) and H_Median (r=0.70) were found (Fig. 4).
In the first approach, the Steplm algorithm was used for variable selection (CHM-metrics). The Steplm algorithm allowed for the optimal combination among predicted variables that produced the smallest AIC value and the root mean squared error of the estimate (RMSE). CHM metrics, including H_sum, H_majority, H_variance and H_median from CHM were selected to predict total biomass, with an R2 of 0.92 and an RMSE of 27.3 Mg ha-1. The best model selected for AGB estimation was as follows (eqn. 2):
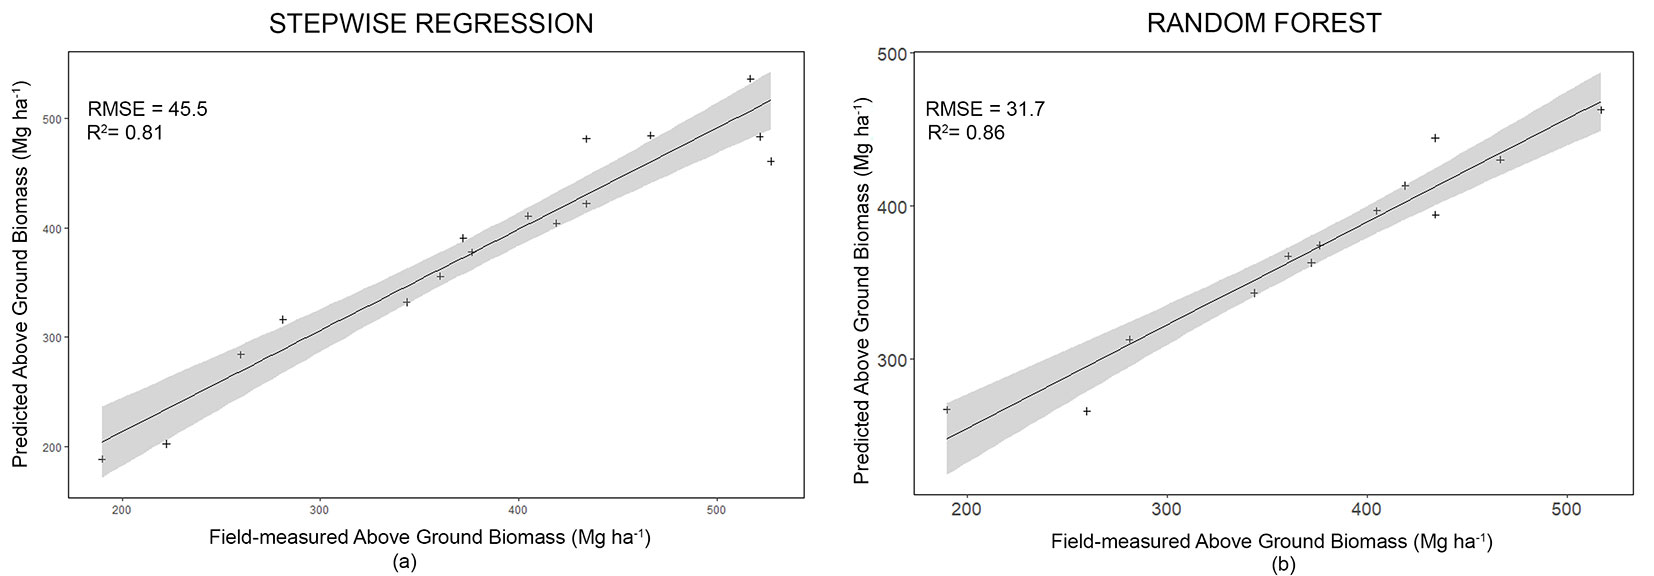
The model validated with LOOCV had an accuracy of R2 of 0.81 and an RMSE of 45.5 Mg ha-1.
In the second approach, the RF model was applied to estimate the AGB based on CHM metrics. The RF model showed better accuracy than the Steplm model (Tab. 3, Fig. 5). The R2 increased from 0.81 to 0.86, and the RMSE and MAE values decreased from 45.5 to 31.7 Mg ha-1 and from 34.2 to 22.1 Mg ha-1, respectively (Tab. 3).
Tab. 3 - Comparison of the stepwise (steplm) and Random Forest (RF) model accuracy.
| Model | R2 | RMSE | MAE |
|---|---|---|---|
| Steplm | 0.81 | 45.5 | 34.2 |
| RF | 0.86 | 31.7 | 22.1 |
Fig. 5 - Scatter plots of field-measured value vs. predicted value obtained by: (a) stepwise regression model; and (b) Random Forest model.
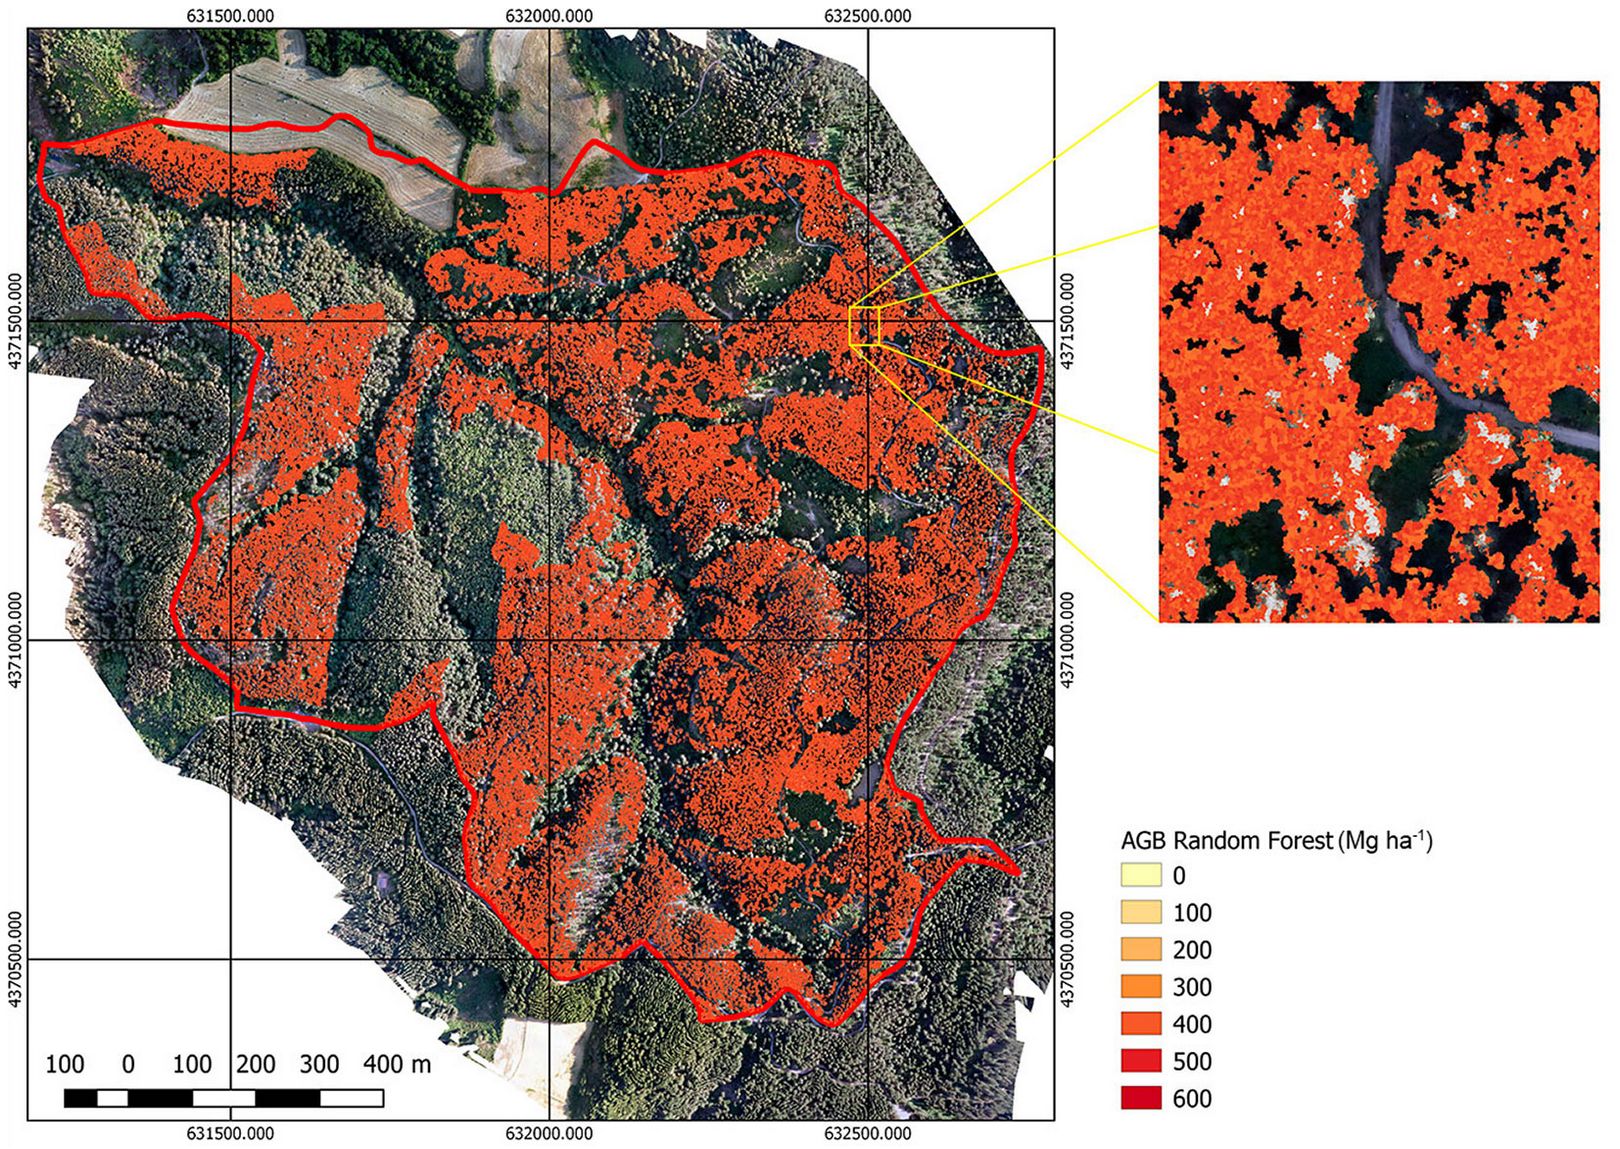
Two maps of the Calabrian pine pure forests in the Bonis Basin have been generated. The Steplm model map showed an AGB mean of 303.18 ± 89.4 Mg ha-1, while the random forest model map resulted in a mean AGB of 314.38 ± 30.2 Mg ha-1.
Discussion
The presented method combines texture and canopy information derived by RGB image and LiDAR, and integrates a forest allometric model to estimate the above-ground biomass. In the literature, several methods have been used to estimate forest biomass and AGB from remote sensing data through LiDAR sensors ([32]), satellite imagery ([17]) or both ([31]), but few studies used RGB images from Unmanned Aerial Vehicles (UAV - [21]). Both AGB maps of the Bonis Basin provide similar AGB mean values but a different distribution of the forest biomass, with lower variability in the random forest model (Fig. 6). The AGB values derived by RF can be considered more reliable than those calculated with Steplm, because all the Calabrian pine pure forest stands are even aged. This is statistically confirmed by the very high accuracy of the RF model and the lower “salt-and-pepper” map obtained.
Fig. 6 - Forest above-ground biomass map obtained using the Random forest model and CHM metric predictors.
For forest biomass models derived from remote sensing data, the RF non-parametric model represents one of the best estimation models in terms of accuracy, with larger R2 and smaller RMSE as compared to other parametric and non-parametric methods ([35]). The linear regression achieved less accuracy of the estimate, probably due to the nonlinear relationship between remote sensing predictors and the observed forest AGB. Therefore, the results obtained in this study can be considered satisfactory with the coefficient of determination of 0.81 and RMSE of 45.5 Mg ha-1 for stepwise regression and 0.86 and 31.7 Mg ha-1 for random forest algorithms, respectively. These values are consistent with those reported by He et al. ([9]) in a coniferous forest (R2 0.73 in the regression model) and by Liu et al. ([18]) in a mixed forest (R2 = 0.95 with the random forest), while Lefsky et al. ([16]) reported a coefficient of determination of 0.81 and an RMSE of 45.8 Mg ha-1 in a deciduous forest.
Moreover, the study area is subject to anthropogenic and natural disturbances such as logging and forest fire that can affect ecosystem dynamics and forest structure ([24]). The produced aboveground biomass maps quantify the biomass inside the forested basin and can be useful to estimate ecosystem services such as carbon stock, canopy status and health of the forest.
Conclusions
A comparative study was conducted for evaluating the forest AGB estimation accuracy using a ready-to-fly UAV to produce very high-resolution images. Recently, the use of UAVs is increasingly used for research purposes. Thanks to the combined use of multi-sensor remote sensing data and ground-truth, the accuracy of AGB estimation of forests has been improved ([21]), though there is still room for further improvements and to increase the estimation accuracy ([13]).
The UAV platforms equipped with various sensors potentially combine the advantage of collecting and delivering data useful for tree parameters estimation and forest monitoring in real-time with high spatial resolutions at reasonable costs. Moreover, remote sensing technology is a non-destructive method to estimate the AGB without negative impacts on the forest ecosystem ([14]) and is applicable to large areas and/or areas that are difficult to access, but it can also be viable for small forest owners ([6]).
Nowadays, the high-resolution acquisition of RGB images is simple, making the use of these technologies less expensive and easy-to-use compared to other remote sensing data. This study demontrated the viability of using machine learning algorithms to predict forest AGB and showed that the Random forest machine learning algorithm led to more accurate AGB estimates than the traditional stepwise regression model.
The presented approach can be considered a relatively low-cost method of forest AGB estimation if DTM and DSM layers or Lidar data are already available. In this context, a commercial fixed-wing drone equipped with an RGB camera was used. Indeed, once the biomass model for AGB estimation is established, new UAV flights can be planned through time to monitor the development of AGB and forest status within the basin. Remote sensing by UAV can be an active monitoring system for forest assessment and management at the local scale to meet specific environmental, economic, social, and cultural objectives ([27]).
This study demonstrated that by applying a machine learning algorithm, readily available images can be used to obtain reliable results, as demonstrated by the accuracy of the above-ground biomass estimation by the Random forest model.
Author Contributions
Conceptualization, M.M.; methodology, M.M., F.V.M.; software, M.M. and G.S.; validation, M.M., F.V.M and G.S.; formal analysis, M.M., G.S.; investigation, M.M., F.V.M and G.S.; resources, G.M., B.L. and G.S.M.; data curation, M.M.; writing and original draft preparation, M.M., G.S.; writing, review and editing, M.M., G.S., F.V.M, G.M., B.L. and G.S.M.; visualization, M.M.; supervision, G.M., G.S.M.; project administration, G.M. and G.S.M.; funding acquisition, G.M. and G.S.M.
Acknowledgements
We would like to thank Dr. Gaetano Pellicone, Dr. Antonella Veltri, Dr. Raffaele Froio for the technical assistance in field data collection.
Funding
This research was funded by: National financial resources (Revolving Fund Cohesion Action Plan (CAP), MIUR; Research Project PRIN-MIUR 2015 “The forest-wood value chain: biomass supply, traceability, C-footprint. Innovation for bioarchitecture and energy efficiency”; and the research project “ALForLab-Chain Value Forest-Wood-Products” (PON03PE_00024_1) co-funded by the Italian National Operational Programme for Research and Competitiveness (PON R&C) 2007-2013, through the European Regional Development Fund (ERDF).
References
Gscholar
CrossRef | Gscholar
Gscholar
Authors’ Info
Authors’ Affiliation
Federico Valerio Moresi 0000-0003-4648-4373
Giuseppe Scarascia Mugnozza 0000-0003-0357-4360
Department of Innovation in Biological, Agro-food and Forest Systems, University of Tuscia, v. San Camillo de Lellis snc 01100 Viterbo (Italy)
Department of Agricultural, Environmental and Food Sciences, University of Molise, v. Francesco de Sanctis, 86100, Campobasso (Italy)
Institute of Bioeconomy, National Research Council of Italy, v. Madonna del Piano 10, I-80056 Sesto Fiorentino, FI (Italy)
Department of Bioscience and Territory, University of Molise, c.da Fonte Lappone, 86090 Pesche, IS (Italy)
Corresponding author
Paper Info
Citation
Maesano M, Santopuoli G, Moresi FV, Matteucci G, Lasserre B, Scarascia Mugnozza G (2022). Above ground biomass estimation from UAV high resolution RGB images and LiDAR data in a pine forest in Southern Italy. iForest 15: 451-457. - doi: 10.3832/ifor3781-015
Academic Editor
Carlotta Ferrara
Paper history
Received: Feb 10, 2021
Accepted: Sep 18, 2022
First online: Nov 03, 2022
Publication Date: Dec 31, 2022
Publication Time: 1.53 months
Copyright Information
© SISEF - The Italian Society of Silviculture and Forest Ecology 2022
Open Access
This article is distributed under the terms of the Creative Commons Attribution-Non Commercial 4.0 International (https://creativecommons.org/licenses/by-nc/4.0/), which permits unrestricted use, distribution, and reproduction in any medium, provided you give appropriate credit to the original author(s) and the source, provide a link to the Creative Commons license, and indicate if changes were made.
Web Metrics
Breakdown by View Type
Article Usage
Total Article Views: 35694
(from publication date up to now)
Breakdown by View Type
HTML Page Views: 27927
Abstract Page Views: 4223
PDF Downloads: 3063
Citation/Reference Downloads: 14
XML Downloads: 467
Web Metrics
Days since publication: 1195
Overall contacts: 35694
Avg. contacts per week: 209.09
Article Citations
Article citations are based on data periodically collected from the Clarivate Web of Science web site
(last update: Mar 2025)
Total number of cites (since 2022): 10
Average cites per year: 2.50
Publication Metrics
by Dimensions ©
Articles citing this article
List of the papers citing this article based on CrossRef Cited-by.
Related Contents
iForest Similar Articles
Short Communications
Estimation of canopy attributes of wild cacao trees using digital cover photography and machine learning algorithms
vol. 14, pp. 517-521 (online: 17 November 2021)
Research Articles
Estimation of above-ground biomass using machine learning approaches with InSAR and LiDAR data in tropical peat swamp forest of Brunei Darussalam
vol. 17, pp. 172-179 (online: 17 June 2024)
Research Articles
Classification of xeric scrub forest species using machine learning and optical and LiDAR drone data capture
vol. 18, pp. 357-365 (online: 07 December 2025)
Research Articles
Prediction of stem diameter and biomass at individual tree crown level with advanced machine learning techniques
vol. 12, pp. 323-329 (online: 14 June 2019)
Review Papers
Remote sensing-supported vegetation parameters for regional climate models: a brief review
vol. 3, pp. 98-101 (online: 15 July 2010)
Research Articles
Exploring machine learning modeling approaches for biomass and carbon dioxide weight estimation in Lebanon cedar trees
vol. 17, pp. 19-28 (online: 12 February 2024)
Review Papers
Accuracy of determining specific parameters of the urban forest using remote sensing
vol. 12, pp. 498-510 (online: 02 December 2019)
Review Papers
Remote sensing of selective logging in tropical forests: current state and future directions
vol. 13, pp. 286-300 (online: 10 July 2020)
Research Articles
Estimation of aboveground forest biomass in Galicia (NW Spain) by the combined use of LiDAR, LANDSAT ETM+ and National Forest Inventory data
vol. 10, pp. 590-596 (online: 15 May 2017)
Research Articles
High resolution biomass mapping in tropical forests with LiDAR-derived Digital Models: Poás Volcano National Park (Costa Rica)
vol. 10, pp. 259-266 (online: 23 February 2017)
iForest Database Search
Search By Author
Search By Keyword
Google Scholar Search
Citing Articles
Search By Author
Search By Keywords
PubMed Search
Search By Author
Search By Keyword

