Colorimetry vs. spectrophotometry: which is better for discrimination of 13 native tree species in Southern Brazil?
iForest - Biogeosciences and Forestry, Volume 19, Issue 1, Pages 45-51 (2026)
doi: https://doi.org/10.3832/ifor4699-018
Published: Feb 12, 2026 - Copyright © 2026 SISEF
Research Articles
Abstract
The application of colorimetric parameters for wood quality control, species discrimination, and property evaluation has been described, but no studies have been published comparing the results obtained by colorimetry and spectrophotometry for the analysis of wood. The objective of this study was to establish spectral parameters for 13 native species from an Araucaria forest stand in Southern Brazil using colorimetric and spectrophotometric methods, and to compare the two methods for species discrimination. For each species, three individuals were collected, from which a disc was removed at breast height and divided into six specimens from pith to bark for analysis. Four parameters were determined for each specimen, two on the transversal surface and two on the radial surface, by each method. The results revealed a variation in the parameters L*, a*, and b*, and PCA results varied with the surface and species evaluated. Measurements of the radial surface, in general, yielded a lower species differentiation using the two methods. When considering the potential use of a technique for species identification in the field, it is necessary to rely on prior data obtained using the same method. In conclusion, colorimetry proved to rapidly discriminate native species in Araucaria forest areas.
Keywords
Araucaria Forest, Colorimetric Parameters, Principal Component Analysis, Species Distinction, Wood
Introduction
Wood is a highly versatile material, with uses including papermaking, civil construction, energy generation, and furniture production, among many others. These uses depend on the physical, mechanical, anatomical, chemical, and organoleptic characteristics of each species. Among the organoleptic properties, color stands out, principally when associated with aspects such as texture and grain pattern ([4]). However, visual classification of materials alone is subjective. It depends on the observer’s experience and sensitivity, and varies with moisture content, temperature, air exposure, anatomical section, and natural degradation ([18], [16]).
Several methods have been successfully employed to determine wood color, especially colorimetry and spectrophotometry. Both techniques allow for quick data collection using simple techniques and portable equipment, providing operational autonomy for field or industrial applications. This makes these methods suitable for wood inspection, helping to enforce commercial and environmental regulations. In particular, portable spectrometers are available, but their high costs often make colorimeters more accessible. Furthermore, they can be transported easily for analysis before or after logging. On the other hand, spectrophotometers have the advantage of providing information about reflectance spectra in the visible wavelength ([11]).
Many studies have characterized or discriminated species based on wood color ([1], [3], [2], [19]). The use of color parameters in practical applications has been described, for example, in studies about consumer preferences regarding hardwood floors ([5]), the influence of climate characteristics on wood for outdoor applications ([10]), the evaluation of color tones for furniture making ([17]), and the suitability of wood for indoor panels ([20]). All these studies indicated that employing this technique is crucial for assessing wood quality parameters and selecting suitable species for specific final uses.
In forestry regulations, the use of color parameters to discriminate species can serve as an auxiliary tool for wood anatomists to analyze specimens in the field or after logging. Studies have applied colorimetry and/or spectrophotometry for wood quality control, species identification, or property evaluation. However, to the best of our knowledge, no studies have compared the results obtained by the two methods for wood analysis. Hence, our objective was to compare the use of colorimetry and spectrophotometry for discriminating 13 wood species native to an Araucaria forest area in Southern Brazil based on colorimetric parameters.
Materials and methods
Species and sample preparation
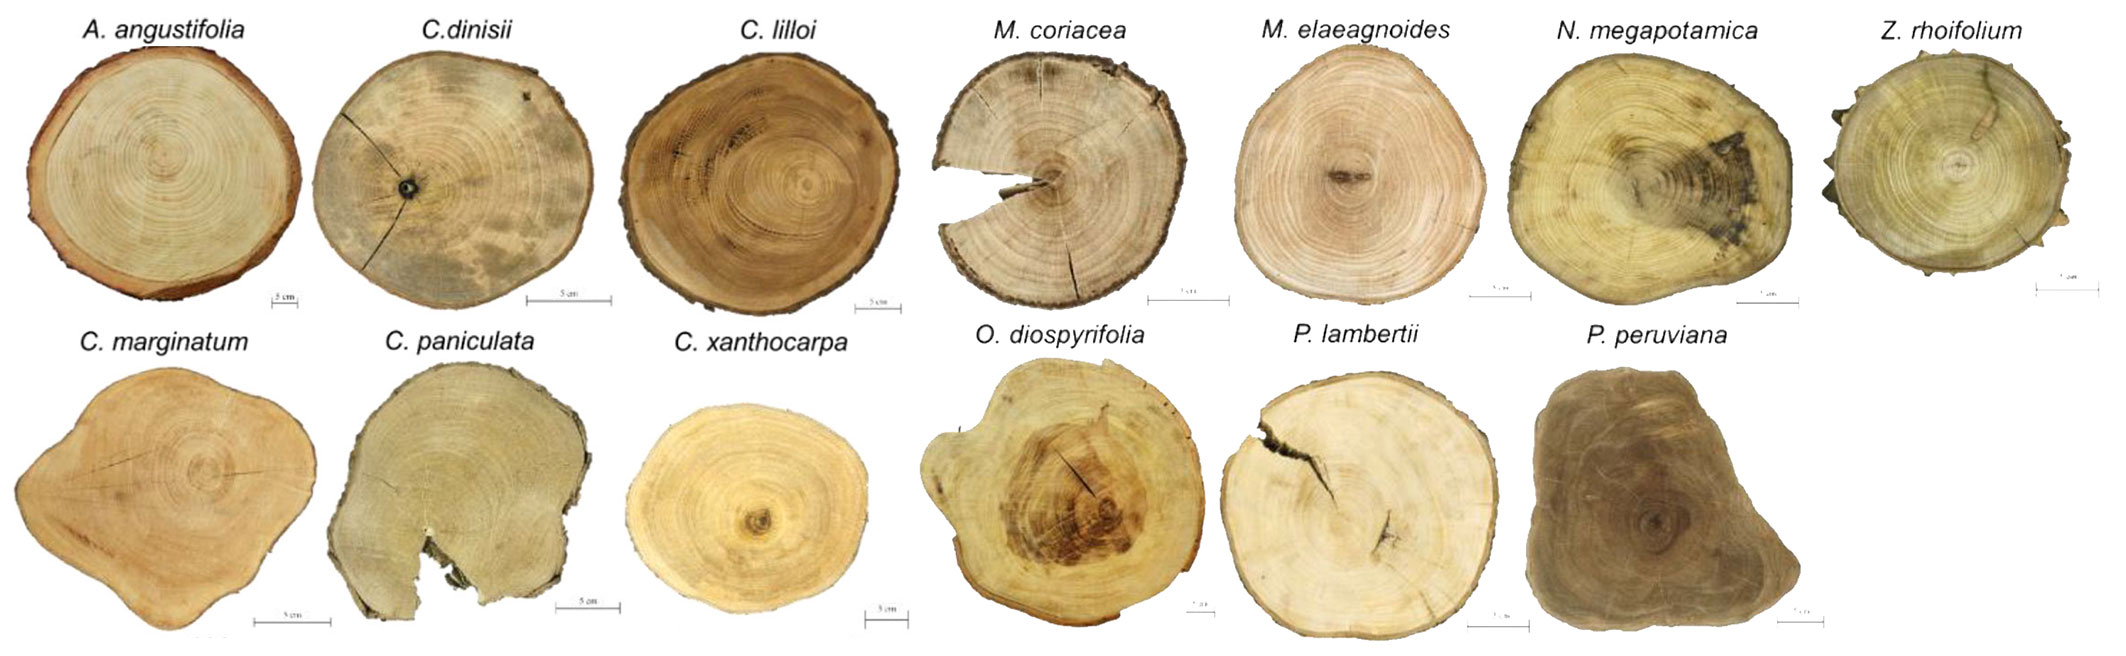
The species evaluated in this study (Tab. 1) are illustrated in Fig. 1. Discs with a thickness of 5 cm were cut at breast height (1.30 m above the ground) from 39 trees, with three individuals per species, in a region where the São Roque Hydroelectric Plant will be constructed in the state of Santa Catarina, Southern Brazil. The use of the material was registered with the Council for Genetic Heritage Management (CGEN/SISGEN) under code AF3EDDC.
Tab. 1 - List of the 13 Brazilian species investigated in this study. (*): No registration; (LUSC): Lages Herbarium of Santa Catarina State University.
| Species | Vernacular name (Portuguese) |
Family | Herbarium registration | Species | Vernacular name (Portuguese) |
Family | Herbarium registration |
|---|---|---|---|---|---|---|---|
| Araucaria angustifolia (Bertol.) Kuntze | Araucária | Araucariaceae | LUSC 6182 | Myrsine coriacea (Sw.) R.Br. ex Roem. & Schult. | Capororoca | Primulaceae | LUSC 6258 |
| LUSC 6183 | LUSC 6259 | ||||||
| LUSC 6184 | LUSC 6260 | ||||||
| Campomanesia xanthocarpa Berg | Guabiroba | Myrtaceae | LUSC 6188 | Nectandra megapotamica (Spreng.) Mez | Canela-imbuia | Lauraceae | LUSC 6264 |
| LUSC 6189 | LUSC 6265 | ||||||
| LUSC 6190 | LUSC 6266 | ||||||
| Cedrela lilloi C.DC. | Cedro (Cedar) | Meliaceae | LUSC 6198 | Ocotea diospyrifolia (Meisn.) Mez | Canela | Lauraceae | LUSC 6270 |
| LUSC 6199 | LUSC 6271 | ||||||
| * | * | ||||||
| Chrysophyllum marginatum (Hook. & Arn.) Radlk. | Guatambu-de-leite | Sapotaceae | LUSC 6201 | Plinia peruviana (Poir.) Govaerts | Jabuticaba | Myrtaceae | LUSC 6324 |
| LUSC 6202 | LUSC 6325 | ||||||
| LUSC 6203 | LUSC 6326 | ||||||
| Cinnamodendron dinisii Schwacke | Pau-pra-tudo | Canellaceae | LUSC 6204 | Podocarpus lambertii Klotzsch ex Endl. | Pinho-bravo | Podocarpaceae | LUSC 6291 |
| LUSC 6205 | LUSC 6292 | ||||||
| LUSC 6206 | LUSC 6293 | ||||||
| Citronella paniculata (Mart.) R.A.Howard | Congonha | Cardiopteridaceae | LUSC 6207 | Zanthoxylum rhoifolium Lam. | Mamica de cadela | Rutaceae | LUSC 6321 |
| LUSC 6208 | LUSC 6322 | ||||||
| LUSC 6209 | LUSC 6323 | ||||||
| Matayba elaeagnoides Radlk. | Camboatá-branco | Sapindaceae | LUSC 6246 | - | |||
| LUSC 6247 | |||||||
| LUSC 6248 | |||||||
Fig. 1 - A wood disc of each evaluated species from the Araucaria forest area.
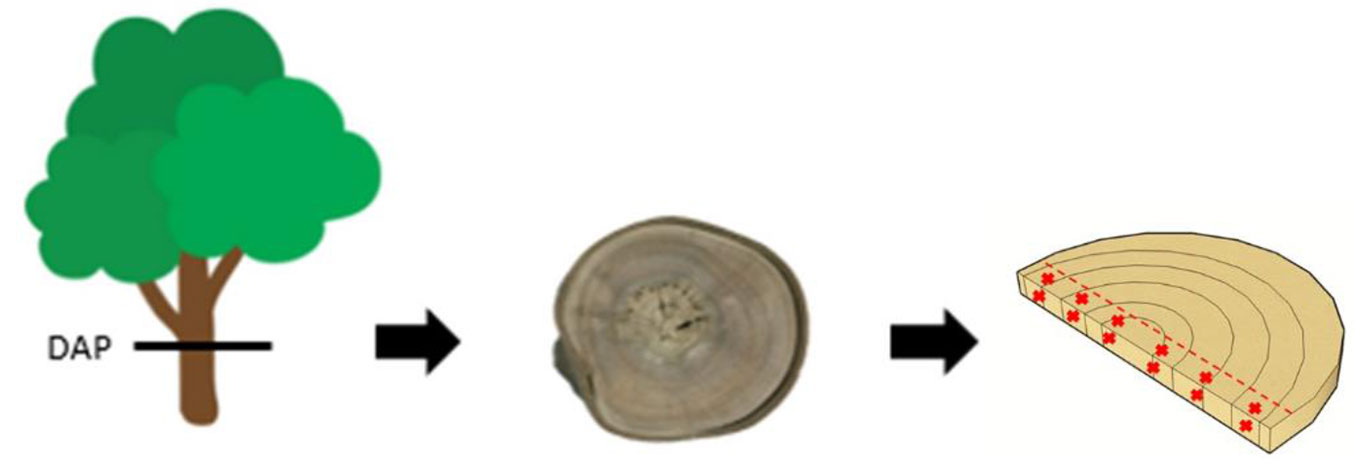
The discs were divided by radial position in six samples: two in the region near the pith, two in intermediate position, and two in the area near the bark (Fig. 2). To ensure consistent analysis, all samples were polished with #100 sandpaper and stored in a room with temperature of 23 ± 2 °C and relative humidity of 60 ± 5% until analysis.
Fig. 2 - Representation of the sampling of test specimens.
Colorimetric parameters
Wood color was evaluated using a CR300® colorimeter (Minolta Co. Ltda., Tokyo, Japan) and a CM-5 spectrophotometer (Konica Minolta), with D65 illuminant and an 8 mm aperture in both instruments. Data on luminosity (L*) and chromatic coordinates from the green-red axis (a*) and blue-yellow axis (b*) were obtained. For each sample, two readings were obtained on the transversal surface (X) and two on the radial surface (R), for a total of 72 readings per species.
Comparison of the means
Mean parameter values for all species across both devices were calculated by averaging each sample and by averaging the readings across the evaluated surfaces (transversal or radial). Analysis of variance was used to assess significant differences between mean values obtained by colorimetry and spectrophotometry at the 95% confidence level.
To verify numerical differences between mean data from colorimetry and spectrophotometry, values of ΔL*, Δa*, Δb*, and ΔE* were calculated based on the methods described by Mazet et al. ([13]), Gonçalez ([6]), and Pastore ([15]), according to equations 1 to 4:
where ΔE* is the total color variation, ΔL* is the luminosity variation (L*), Δa* and Δb* are chromatic coordinate variation (a* Λ b*).
To evaluate total color variation (ΔE*), a table described by Hikita et al. ([8]) was applied. Additionally, color was classified for each technique using cluster analysis, as described by Camargos & Gonçalez ([4]).
Principal component analysis (PCA)
To assess the similarity between colorimetric and spectrophotometric results, principal component analysis was performed. Data were analyzed for each species, considering the mean per sample and the mean per evaluated surface (transversal or radial). The analyses were performed in R (ver. 3.4.3), using the “FactoMineR” and “Factoextra” packages ([12], [9]).
K-nearest neighbors (K-NN) cluster analysis
To assess the accuracy of the methods, 15 models were evaluated using data obtained by colorimetry and spectrophotometry for the two surfaces (radial and transversal) and for all data combined (Tab. 2). Colorimetric parameters were split into two groups: 70% for model training and 30% for testing.
Tab. 2 - Classification model for k-nearest neighbors (k-NN).
| Model | Learning | Testing | Surface |
|---|---|---|---|
| 1 | Spectrophotometry | Spectrophotometry | All |
| 2 | Spectrophotometry | Spectrophotometry | Transversal |
| 3 | Spectrophotometry | Spectrophotometry | Radial |
| 4 | Colorimetry | Colorimetry | All |
| 5 | Colorimetry | Colorimetry | Transversal |
| 6 | Colorimetry | Colorimetry | Radial |
| 7 | Spectrophotometry and Colorimetry | Spectrophotometry and Colorimetry | All |
| 8 | Spectrophotometry and Colorimetry | Spectrophotometry and Colorimetry | Transversal |
| 9 | Spectrophotometry and Colorimetry | Spectrophotometry and Colorimetry | Radial |
| 10 | Colorimetry | Spectrophotometry | All |
| 11 | Colorimetry | Spectrophotometry | Transversal |
| 12 | Colorimetry | Spectrophotometry | Radial |
| 13 | Spectrophotometry | Colorimetry | All |
| 14 | Spectrophotometry | Colorimetry | Transversal |
| 15 | Spectrophotometry | Colorimetry | Radial |
Ten-fold cross-validation was applied to estimate the models’ performance. Accuracy was computed using the “confusionMatrix” function of the “caret” package in the R environment.
Results and discussion
Colorimetric parameters
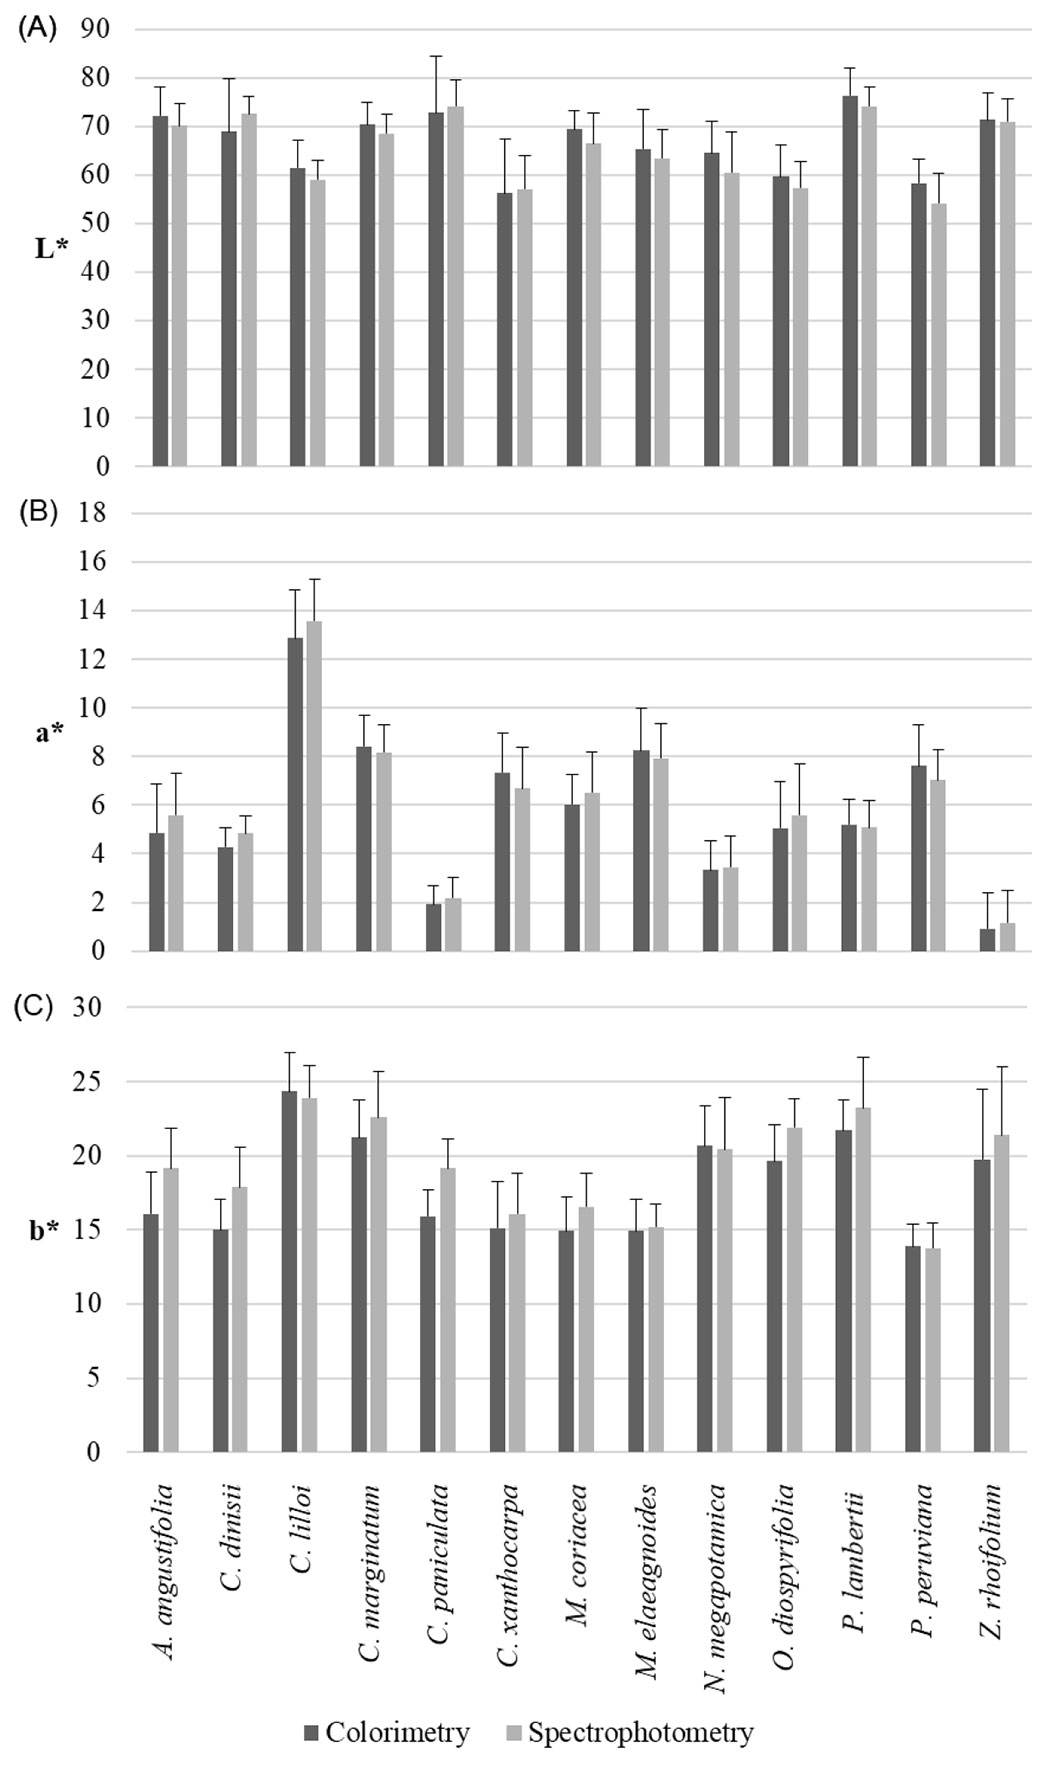
The colorimetric parameters (L*, a*, b*) were analyzed using mean values across all surfaces (Fig. 3) and separately for the radial (R) and transversal (X) surfaces (Fig. S1 in Supplementary material). To identify statistically significant results, p-values were evaluated (Tab. 3).
Fig. 3 - Mean colorimetric parameters for wood from species in an Araucaria forest area. Bars indicate upper standard deviation.
Tab. 3 - Total color variation by species considering differences between colorimetry and spectrophotometry for mean data and for each surface. (X): mean only of transversal surface; (R): mean only of radial surface.
| Species | ΔL* | Δa* | Δb* | ΔE* | ||||||||
|---|---|---|---|---|---|---|---|---|---|---|---|---|
| Mean | R | X | Mean | R | X | Mean | R | X | Mean | R | X | |
| A. angustifolia | 0.03 | 0.03 | 0.04 | -0.11 | -0.04 | -0.19 | -0.16 | -0.19 | -0.14 | 0.32 | 0.32 | 0.33 |
| C. dinisii | -0.05 | -0.01 | -0.09 | -0.10 | -0.06 | -0.15 | -0.16 | -0.13 | -0.19 | 0.28 | 0.25 | 0.30 |
| C. lilloi | 0.04 | 0.05 | 0.04 | -0.04 | -0.02 | -0.06 | 0.02 | 0.01 | 0.03 | 0.19 | 0.20 | 0.17 |
| C. marginatum | 0.03 | 0.04 | 0.02 | 0.05 | -0.01 | 0.11 | -0.06 | -0.08 | -0.04 | 0.20 | 0.21 | 0.19 |
| C. paniculata | -0.01 | 0.00 | -0.03 | 0.17 | 0.33 | 0.02 | -0.17 | -0.17 | -0.17 | 0.96 | 1.40 | 0.51 |
| C. xanthocarpa | -0.01 | 0.02 | -0.05 | 0.16 | 0.16 | 0.17 | -0.06 | -0.05 | -0.08 | 0.37 | 0.41 | 0.32 |
| M. coriacea | 0.05 | 0.03 | 0.08 | -0.04 | 0.00 | -0.08 | -0.10 | -0.10 | -0.10 | 0.25 | 0.21 | 0.28 |
| M. elaeagnoides | 0.04 | 0.05 | 0.02 | 0.05 | 0.01 | 0.08 | -0.02 | -0.02 | -0.01 | 0.20 | 0.18 | 0.21 |
| N. megapotamica | 0.08 | 0.07 | 0.10 | 0.09 | 0.22 | -0.05 | 0.02 | -0.02 | 0.06 | 0.46 | 0.45 | 0.47 |
| O. diospyrifolia | 0.05 | 0.04 | 0.06 | 0.02 | 0.08 | -0.04 | -0.11 | -0.10 | -0.12 | 0.44 | 0.46 | 0.42 |
| P. lambertii | 0.03 | 0.04 | 0.03 | 0.06 | 0.02 | 0.10 | -0.06 | -0.09 | -0.03 | 0.25 | 0.28 | 0.23 |
| P. peruviana | 0.09 | 0.06 | 0.11 | 0.11 | 0.06 | 0.15 | 0.01 | -0.04 | 0.07 | 0.29 | 0.25 | 0.34 |
| Z. rhoifolium | 0.01 | 0.02 | -0.01 | -0.05 | 0.57 | -0.68 | -0.08 | -0.09 | -0.07 | 1.63 | 1.98 | 1.28 |
For mean data, considering differences between methods for the L* parameter (Fig. 3a), only C. dinisii showed higher values using spectrophotometry. For A. angustifolia, C. lilloi, C. marginatum, M. coriacea, N. megapotamica, O. diospyrifolia, P. lambertii, and P. peruviana, higher values were detected using the colorimetric method, while for the other five species (C. paniculata, C. xanthocarpa, M. elaeagnoides, Z. rhoifolium), the data were not significantly different between the two techniques.
For chromatic coordinate a* (Fig. 3b), no significant differences were detected between the methods in C. marginatum, M. elaeagnoides, O. diospyrifolia, N. megapotamica, P. lambertii, and Z. rhoifolium. The species with more reddish color (C. xanthocarpa, P. peruviana) had higher values from colorimetry, and the other species had higher values of a* from spectrophotometry (A. angustifolia, C. dinisii, C. lilloi, C. paniculata, M. coriacea).
Regarding the parameter b* (Fig. 3c), eight species showed higher values when measured using spectrophotometry (A. angustifolia, C. dinisii, C. marginatum, C. paniculata, M. coriacea, O. diospyrifolia, P. lambertii, Z. rhoifolium). In contrast, the other species showed statistically similar results when compared between colorimetry and spectrophotometry. Notably, the colorimetric measurement for the parameter b* was the only one that yielded a higher value.
The luminosity results (L*) obtained through the two methods varied across different surfaces (Fig. S1a in Supplementary material). On the radial surface, three species (C. marginatum, P. lambertii, and P. peruviana) exhibited higher colorimetric values, while the other species showed no difference between the methods (A. angustifolia, C. dinisii, C. lilloi, C. paniculata, C. xanthocarpa, M. coriacea, M. elaeagnoides, N. megapotamica, O. diospyrifolia, Z. rhoifolium). On the transversal surface, the comparison of the methods gave heterogeneous results. In six species, the data from colorimetry and spectrophotometry were similar (C. marginatum, C. paniculata, C. xanthocarpa, M. elaeagnoides, P. lambertii, Z. rhoifolium), while in six species, higher values were obtained by colorimetry (A. angustifolia, C. lilloi, M. coriacea, N. megapotamica, O. diospyrifolia, P. peruviana). For this parameter, only C. dinisii showed spectrophotometric values higher than those obtained by colorimetry.
For the parameter a* on the radial surface, a significantly higher value was found only for C. dinisii using spectrophotometry (Fig. S1b in Supplementary material). In contrast, the results for the other 12 species (A. angustifolia, C. lilloi, C. marginatum, C. paniculata, C. xanthocarpa, M. coriacea, M. elaeagnoides, N. megapotamica, O. diospyrifolia, P. lambertii, P. peruviana, Z. rhoifolium) were not statistically different between colorimetry and spectrophotometry. On the transversal surface, heterogeneous behavior was observed for the parameters a* and L*. For the latter parameter, the values from five species were not significantly different across methods (C. paniculata, C. xanthocarpa, M. elaeagnoides, N. megapotamica, O. diospyrifolia, P. lambertii), while for five species the results were higher using spectrophotometry (A. angustifolia, C. dinisii, C. lilloi, M. coriacea, Z. rhoifolium) and for three species using colorimetry (C. marginatum, C. xanthocarpa, P. peruviana).
In general, the values of parameter b* from radial and transversal surfaces were higher using spectrophotometry (Fig. S1c in Supplementary material): for nine species on the radial surface (A. angustifolia, C. dinisii, C. marginatum, C. paniculata, C. xanthocarpa, M. coriacea, O. diospyrifolia, P. lambertii, and P. peruviana) and six on the transversal surface (A. angustifolia, C. dinisii, C. marginatum, C. paniculata, M. coriacea, O. diospyrifolia). The transversal surface of P. peruviana showed higher colorimetric values, whereas the other species showed no differences between the transversal and radial sections.
Regarding total color variation, we recorded fairly low values for parameters ΔL*, Δa*, and Δb* (Tab. 4). With respect to ΔE*, based on the table presented by Hikita et al. ([8]), the species A. angustifolia, C. dinisii, C. lilloi, C. marginatum, C. xanthocarpa, P. peruviana, O. diospyrifolia, N. megapotamica, P. lambertii, M. elaeagnoides, and M. coriacea showed ΔE* values classified as negligible, while C. paniculata was classified as having slightly perceptible color variation. For Z. rhoifolium, color variation on the transversal surface was somewhat noticeable, and the others were classified as only perceptible.
Tab. 4 - Accuracy of trained k-NN for all tested models.
| Model # | Accuracy |
|---|---|
| 1 | 0.63 |
| 2 | 0.68 |
| 3 | 0.73 |
| 4 | 0.67 |
| 5 | 0.75 |
| 6 | 0.75 |
| 7 | 0.63 |
| 8 | 0.70 |
| 9 | 0.68 |
| 10 | 0.47 |
| 11 | 0.52 |
| 12 | 0.55 |
| 13 | 0.49 |
| 14 | 0.52 |
| 15 | 0.48 |
The species C. paniculata and Z. rhoifolium, both characterized by wood with a similar olive coloration (Fig. 1), showed higher ΔE* values. This may be due to the differences in illumination geometry inherent to the equipment used; we compared colorimetry at a d/0° angle to spectrophotometry at a d/8° angle, resulting in variations in the angle at which the sensor collects data.
In a study of color variations in wood species from Central Europe, including characterization and intensification of color by the CIELAB system, Meints et al. ([14]) indicated that the species Acer pseudoplatanus/platanoides, Fraxinus excelsior, and Populus alba had only slight color variation, with ΔE ~ 10 after surface wetting. In contrast, the species Pyrus communis, Juglans regia, and Sorbus torminalis showed significant variation, with ΔE values up to 41. These differences indicated that the analysis of wood anatomical characteristics can explain the variations.
Based on the results described, it is possible to infer that data from both techniques can be applied to discriminate the Araucaria forest species analyzed.
Color classification
We used color determination for each method, based on the clusters described by Camargos & Gonçalez ([4]), to assess whether the results differed across the two data acquisition techniques.
As expected, we obtained the same color classification using both methods for nine species. This is an important positive result for the practical application of colorimetry, since both methods provided the same color names. Still, colorimetry was more convenient due to the device’s portability and ease of handling, both for regulatory supervision and field quality control.
On the other hand, data for the species C. marginatum, C. paniculata, O. diospyrifolia, and P. peruviana yielded different classifications using colorimetry and spectrophotometry. This indicates the need for a reference database for each method used to discriminate species’ wood.
Principal component analysis
To assess the effectiveness of each method, we performed principal component analysis of data for all species (not shown). Colorimetry resulted in the misidentification of some samples of Matayba elaeagnoides and Araucaria angustifolia. This can pose a problem for species identification in the field, as logging of A. angustifolia is restricted, while logging of the other species is not. Visual observation of wood from A. angustifolia and M. elaeagnoides (Fig. 1) indicated substantial similarity between them. This is confirmed by the proximity of colorimetric parameters.
Araucaria species are protected and subject to restricted use. Observing wood color characteristics before cutting is important to distinguish these trees. Additionally, it is important to note that M. elaeagnoides is not a commercial species; it is only occasionally found in carbonized material, where the usual techniques cannot be applied. Further, in this study, a large overlap in the spectrophotometric data was observed in the spectrophotometric values of several species, particularly with mixed samples of Ocotea diospyrifolia and Nectandra megapotamica. In contrast, Cedrela lilloi samples, listed on the CITES list, were distinctly different from other species, showing similar coloration across both techniques. Therefore, it is essential to assess each species individually to establish whether the results from both techniques are comparable, and whether either field colorimetry can be recommended for preliminary identification or wood samples must be submitted to a laboratory for further investigation.
Fig. 4shows the results of principal component analysis of the average colorimetric parameters L*, a*, and b* for the samples on the radial and transversal surfaces. In general, most species showed similar sample distributions in the space of the first two components, with overlapping ellipses (i.e., 95% confidence intervals) between colorimetric and spectrophotometric values. The most similar results across the two techniques were recorded for C. xanthocarpa and Z. rhoifolium. In contrast, C. dinisii and M. coriacea showed fairly distinct distributions of the values obtained using the two methods (Fig. 4).
Fig. 4 - Principal component analysis score graph using average colorimetric parameters of wood (based on both radial and transversal surfaces) from each of thirteen species of the Araucaria forest in Brazil. The ellipses represent the 95% confidence intervals for colorimetric (red dots) and spectrophotometric (green triangles) values.
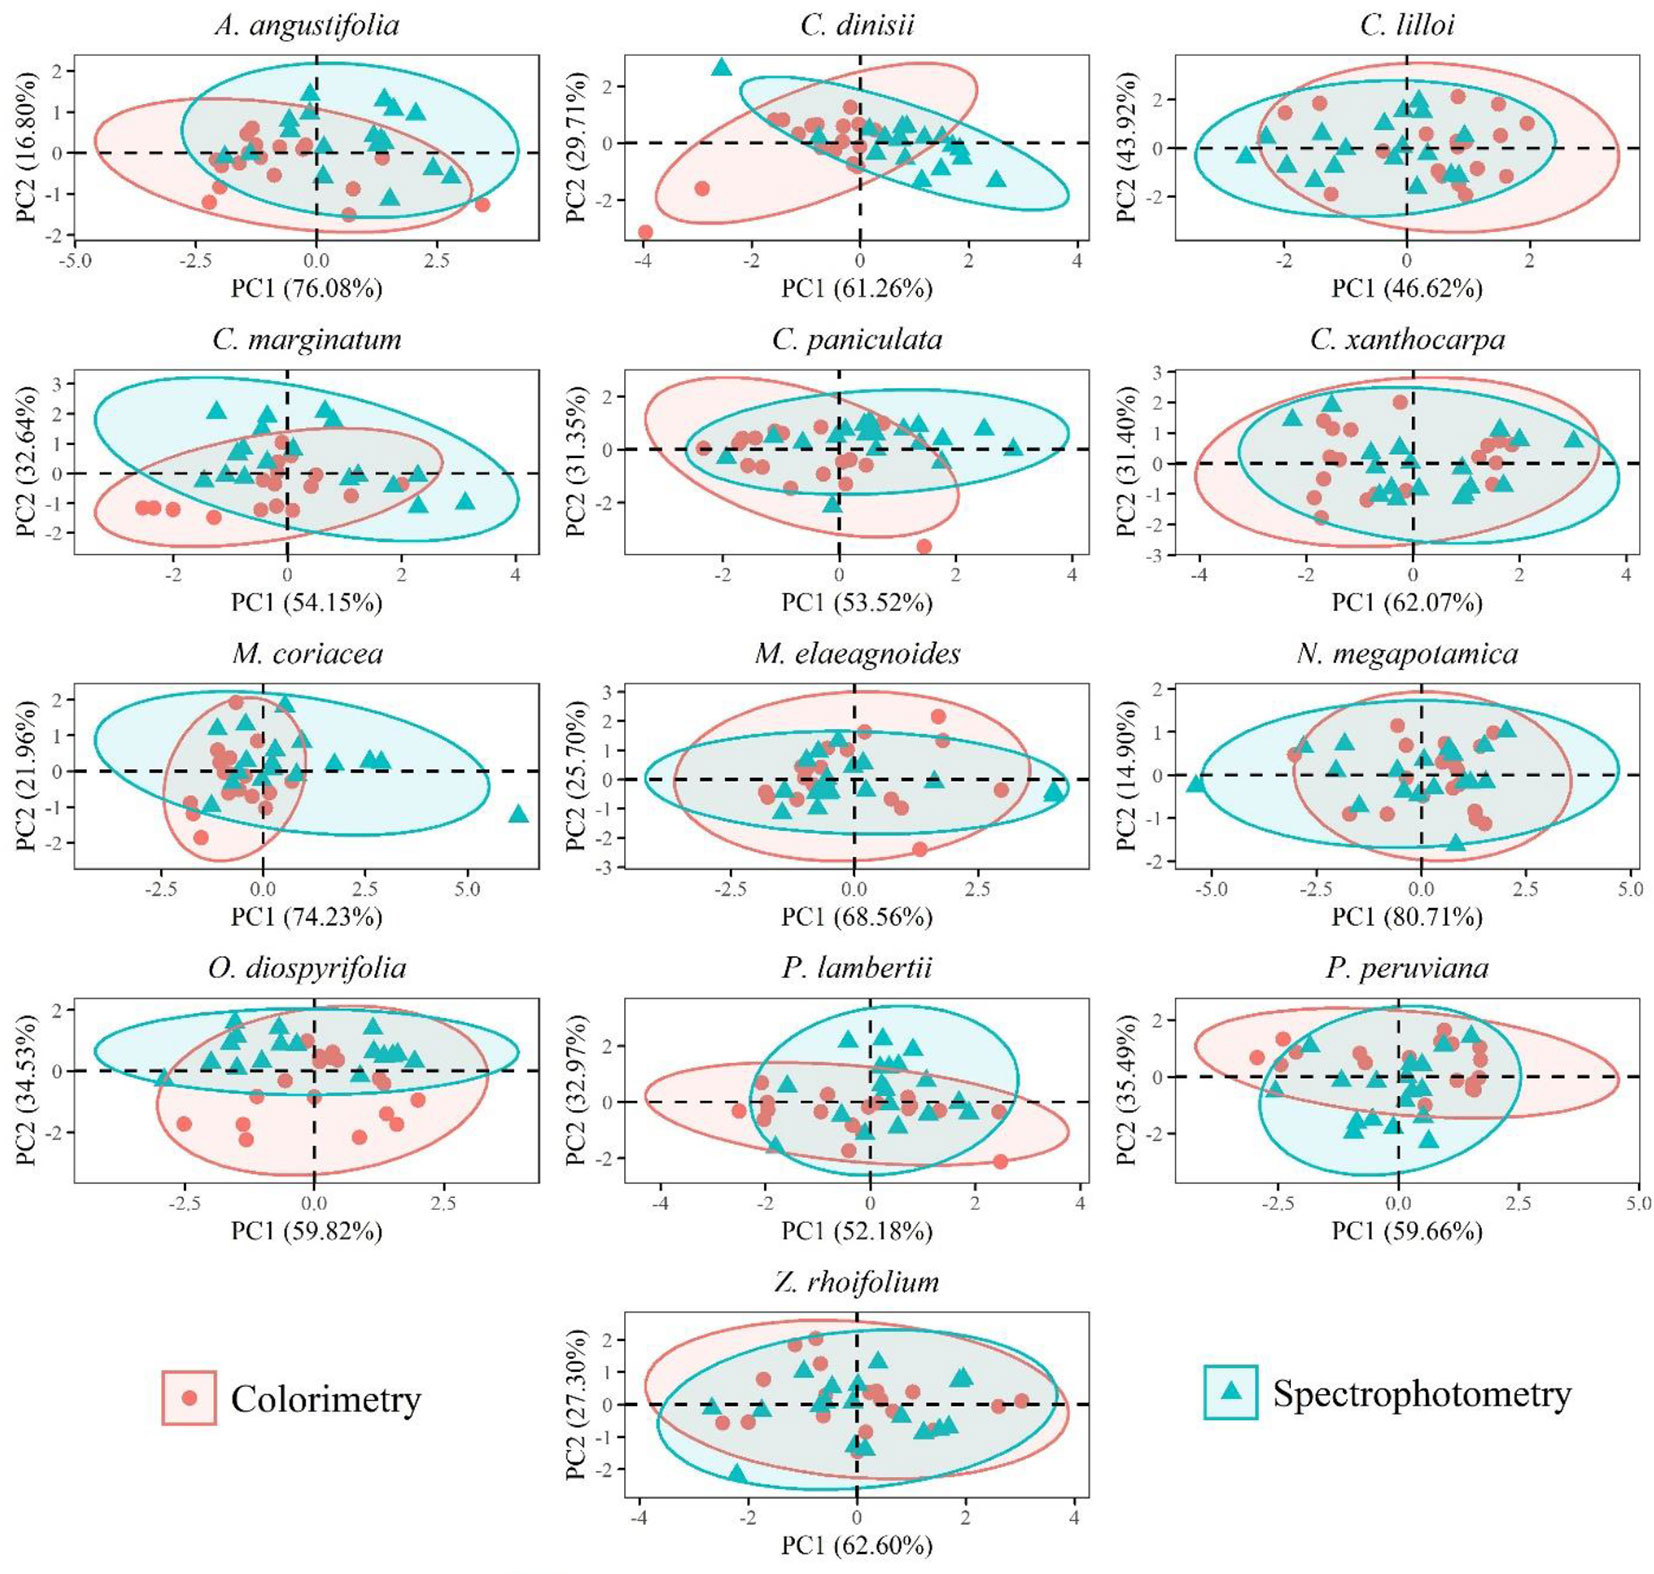
To evaluate the influence of different anatomical surfaces on colorimetric and spectrophotometric records, PC analysis was conducted separately using data from radial (Fig. S2 in Supplementary material) and transversal surfaces (Fig. S3). The results showed that samples of C. dinisii and M. coriacea were more visually distinct between methods across both surfaces, whereas M. elaeagnoides showed the most overlapping ellipses.
Cluster analysis
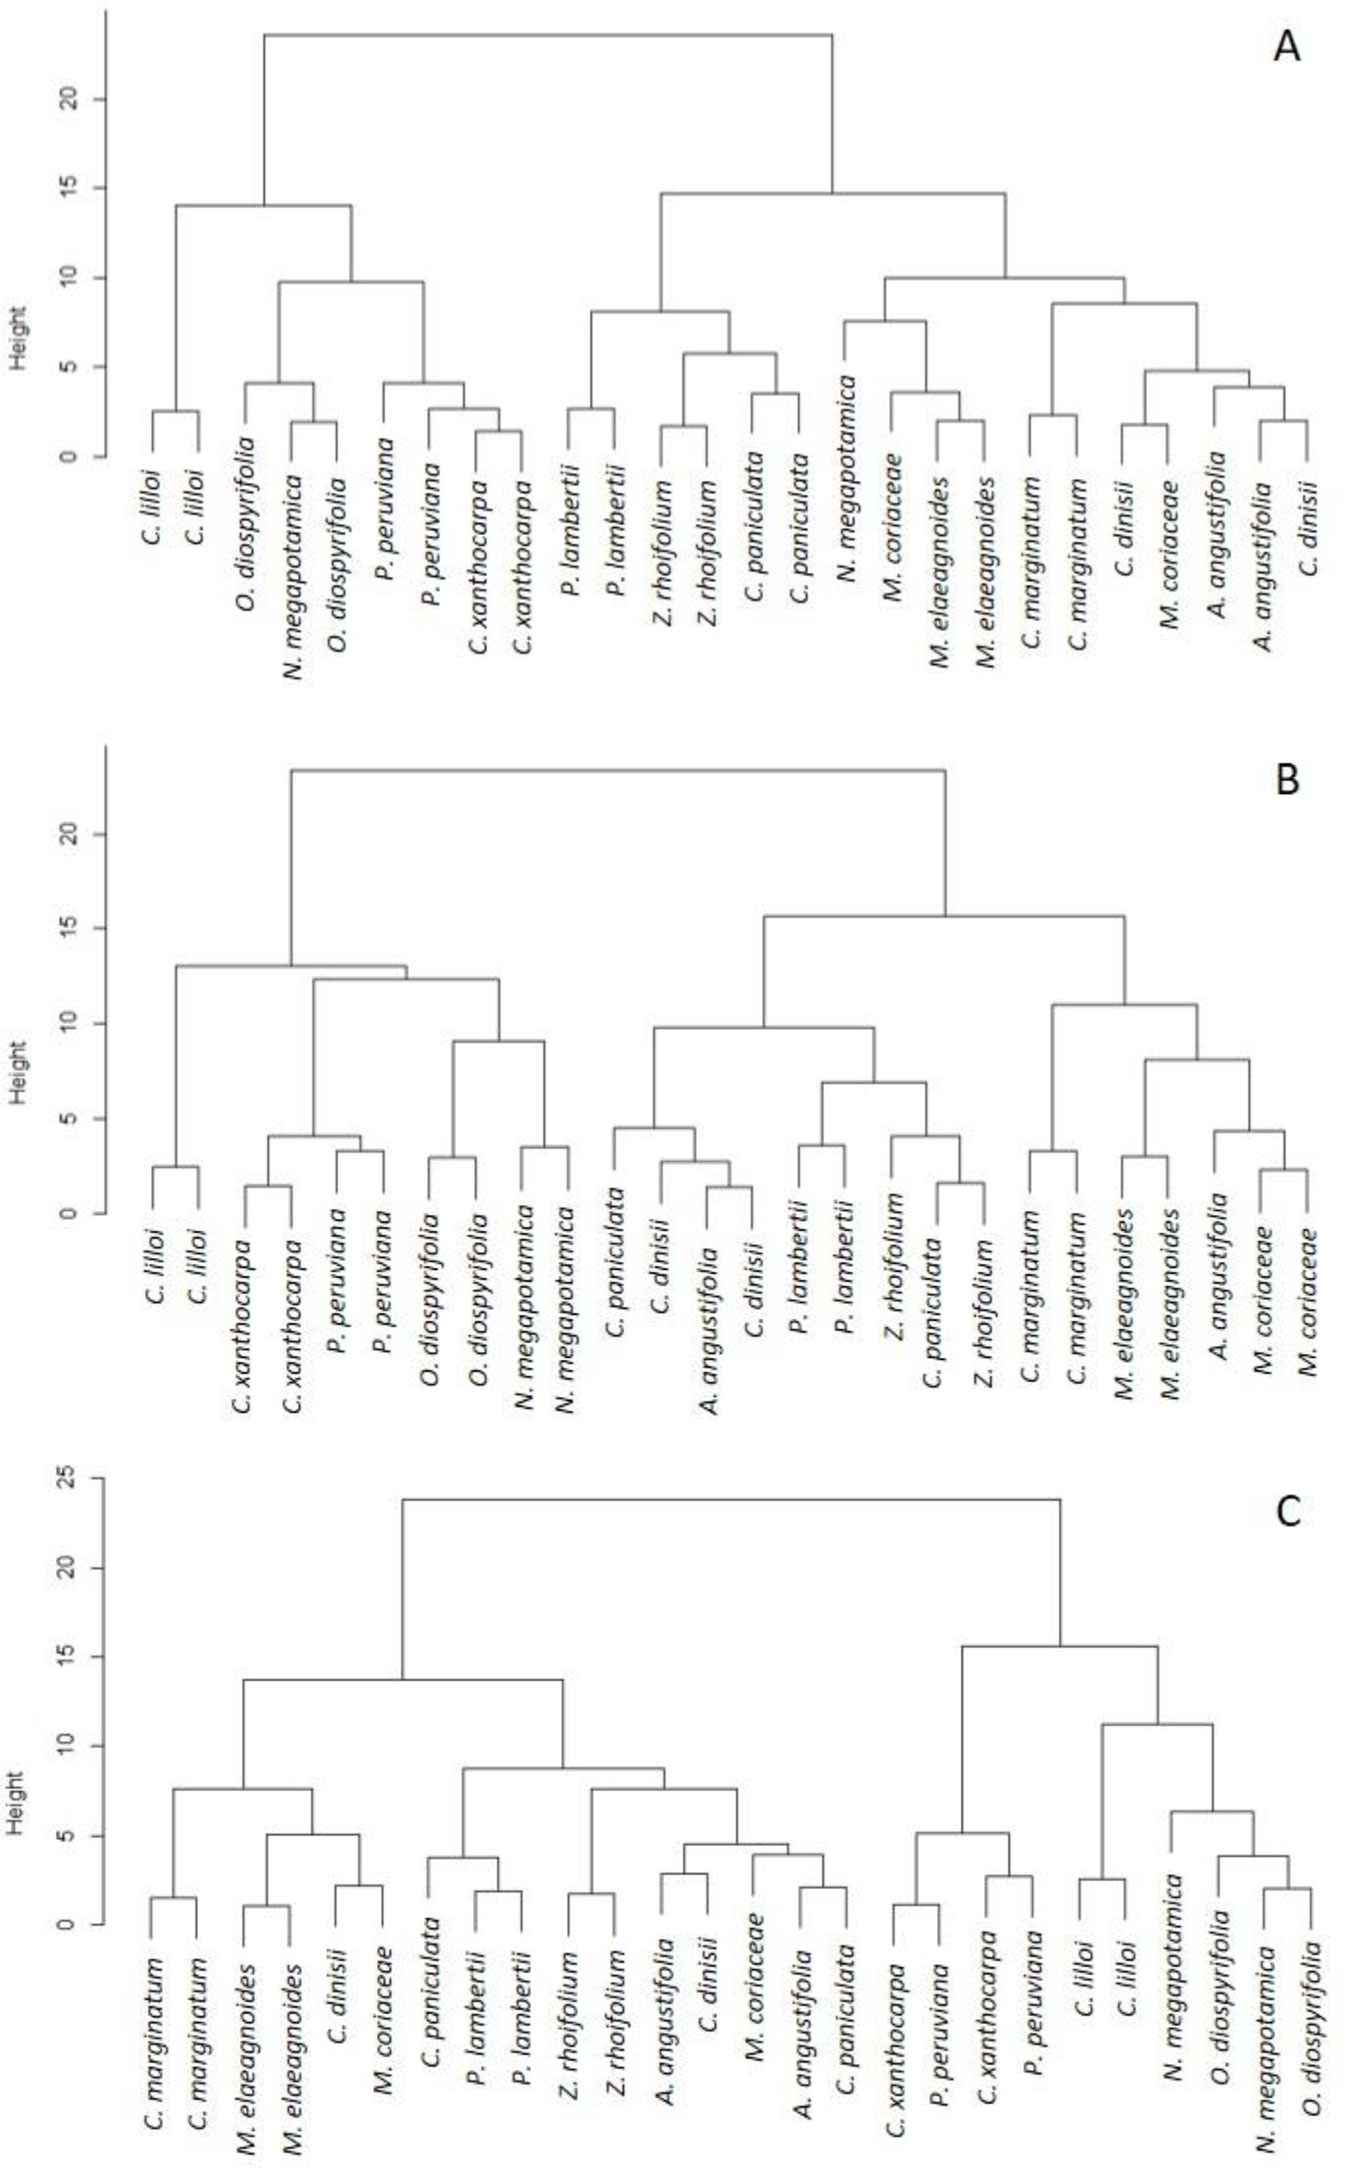
To determine if wood samples could be accurately identified regardless of the method used, we conducted cluster analysis using data averaged by species (Fig. 5a), and separately using mean data for the radial and transversal surfaces (Fig. 5b and Fig. 5c, respectively). Our findings indicate that data from transversal surfaces have a lower separation ability to distinguish between five species: C. marginatum, M. elaeagnoides, P. lambertii, Z. rhoifolium, and C. lilloi. We obtained intermediate results using mean data for seven species: C. lilloi, P. peruviana, C. xanthocarpa, P. lambertii, Z. rhoifolium, C. paniculata, M. elaeagnoides, and C. marginatum. In contrast, data from the radial surface provided better distinction among nine species: C. lilloi, C. xanthocarpa, P. peruviana, O. diospyrifolia, N. megapotamica, P. lambertii, C. marginatum, M. elaeagnoides, and M. coriacea. Therefore, for the species evaluated, identification based on radial surface data provided better results. Furthermore, only C. dinisii, was not correctly grouped by cluster analysis (Fig. 5). On the other hand, C. marginatum, M. elaeagnoides, P. lambertii, and C. lilloi were grouped correctly, regardless of the dataset used (all, radial, or transversal surface).
Fig. 5 - Results of the cluster analysis using general mean data (A), mean data from radial surface (B), and mean data from transversal surface (C), obtained for colorimetric parameters of wood from 13 Araucaria forest species.
Halalisan et al. ([7]) applied cluster analysis to evaluate color variation in wood from Quercus species in Romania. They concluded that at least five species could be distinguished in the studied forests. They also verified that the main differences were in luminosity (L*) and yellow parameter (b*).
K-NN
To assess the influence of each technique on species’ wood discrimination, we evaluated accuracy across different K-NN methods (Tab. S2 in Supplementary material). The combined data from all models yielded a mean accuracy of 0.62, with higher accuracy achieved by colorimetric analysis of radial and transverse surfaces (Tab. 4). It is important to note that when evaluating different anatomical surfaces, we obtained better results with models that analyzed the radial and transverse surfaces independently. The only exception was model #13, for which the averaged data provided superior performance compared to data from the radial surface alone. Accuracy values decreased when parameters from one method were used for the learning group and parameters from a different method were used for the test group. This finding is significant and emphasizes the need to develop a distinct reference database for each technique employed in species identification.
Our results suggest that both colorimetry and spectrophotometry can effectively differentiate the wood of Araucaria forest species, enabling initial field segregation and subsequent laboratory validation. Exploring alternative algorithms is crucial for improving the accuracy of classification models.
Conclusions
Overall, thirteen tree species native to the Brazilian Araucaria forest did not differ in wood parameters measured using colorimetric and spectrophotometric techniques. Additionally, the wood surface considered for the evaluation (either radial or transversal) did not significantly affect species characterization and identification.
Principal component analysis yielded a similar distribution of samples across data obtained by colorimetry and spectrophotometry. Moreover, the application of K-NN models indicated reduced accuracy when using data from different methods for learning and testing.
Colorimetric parameters can be used to distinguish timbers of Araucaria forest species during field inspections; however, comparisons of measurements obtained with the two techniques should be conducted with caution, as wood is a highly variable material that can influence the collected data.
Both colorimetry and spectrophotometry are used in practice, but colorimetry is more practical due to its smaller equipment size. Finally, it is necessary to develop a reference database for each native species to improve the accuracy and precision of wood identification using colorimetric methods.
Acknowledgements
We thank Santa Catarina State University (UDESC) for materials, Federal University of Paraná (UFPR) for physical structure, Federal University of Rio Grande do Sul (URGS) for colorimetry, the Office to Coordinate Improvement of University Personnel (CAPES - Financial Code 01) and the National Council for Scientific and Technological Development (CNPq, PQ 306082/2019-5) for funding.
Author’s contribution
HCV: responsible for the study, laboratory measurements, statistical analyses, manuscript writing; RS: manuscript writing, manuscript formatting; JXS: manuscript writing, laboratory measurements; DVS: statistical analyses; PDR: manuscript proofreading; GIBM: manuscript proofreading; SRM: manuscript proofreading; SN: translation of the manuscript into English, manuscript proofreading, study advisor.
References
Gscholar
Gscholar
CrossRef | Gscholar
Authors’ Info
Authors’ Affiliation
Federal Rural University of Pernambuco, Department of Forest Science, Recife, Pernambuco (Brazil)
Polliana D’Angelo Rios 0000-0002-3700-7084
University of Santa Catarina State, Department of Forest Engineering, Lages, Santa Catarina (Brazil)
Graciela Inés Bolzon De Muñiz 0000-0003-4417-0178
Simone Ribeiro Morrone 0000-0002-3872-7198
Silvana Nisgoski 0000-0001-9595-9131
Federal University of Paraná, Postgraduate Program in Forest Engineering, Department of Forestry Engineering, Curitiba, Paraná (Brazil)
Federal University of Pará, Faculty of Forestry Engineering, Altamira, Pará (Brazil)
Corresponding author
Paper Info
Citation
Vieira HC, Stange R, Dos Santos JX, Souza DV, Rios PDA, De Muñiz GIB, Morrone SR, Nisgoski S (2026). Colorimetry vs. spectrophotometry: which is better for discrimination of 13 native tree species in Southern Brazil?. iForest 19: 45-51. - doi: 10.3832/ifor4699-018
Academic Editor
Marco Borghetti
Paper history
Received: Jul 30, 2024
Accepted: Feb 07, 2026
First online: Feb 12, 2026
Publication Date: Feb 28, 2026
Publication Time: 0.17 months
Copyright Information
© SISEF - The Italian Society of Silviculture and Forest Ecology 2026
Open Access
This article is distributed under the terms of the Creative Commons Attribution-Non Commercial 4.0 International (https://creativecommons.org/licenses/by-nc/4.0/), which permits unrestricted use, distribution, and reproduction in any medium, provided you give appropriate credit to the original author(s) and the source, provide a link to the Creative Commons license, and indicate if changes were made.

Web Metrics
Breakdown by View Type
Article Usage
Total Article Views: 2125
(from publication date up to now)
Breakdown by View Type
HTML Page Views: 682
Abstract Page Views: 764
PDF Downloads: 587
Citation/Reference Downloads: 0
XML Downloads: 92
Web Metrics
Days since publication: 149
Overall contacts: 2125
Avg. contacts per week: 99.83
Article Citations
Article citations are based on data periodically collected from the Clarivate Web of Science web site
(last update: Mar 2025)
(No citations were found up to date. Please come back later)
Publication Metrics
by Dimensions ©
Articles citing this article
List of the papers citing this article based on CrossRef Cited-by.
Related Contents
iForest Similar Articles
Research Articles
Estimation of total extractive content of wood from planted and native forests by near infrared spectroscopy
vol. 14, pp. 18-25 (online: 09 January 2021)
Research Articles
NIR-based models for estimating selected physical and chemical wood properties from fast-growing plantations
vol. 15, pp. 372-380 (online: 05 October 2022)
Research Articles
Examining the evolution and convergence of wood modification and environmental impact assessment in research
vol. 10, pp. 879-885 (online: 06 November 2017)
Research Articles
Identification of wood from the Amazon by characteristics of Haralick and Neural Network: image segmentation and polishing of the surface
vol. 15, pp. 234-239 (online: 14 July 2022)
Research Articles
Characterization of VOC emission profile of different wood species during moisture cycles
vol. 10, pp. 576-584 (online: 08 May 2017)
Research Articles
Dielectric properties of paraffin wax emulsion/copper azole compound system treated wood
vol. 12, pp. 199-206 (online: 10 April 2019)
Research Articles
Physical, chemical and mechanical properties of Pinus sylvestris wood at five sites in Portugal
vol. 10, pp. 669-679 (online: 11 July 2017)
Research Articles
Mechanical and physical properties of Cunninghamia lanceolata wood decayed by brown rot
vol. 12, pp. 317-322 (online: 06 June 2019)
Research Articles
Improving sustainability in wood coating: testing lignin and cellulose nanocrystals as additives to commercial acrylic wood coatings for bio-building
vol. 14, pp. 499-507 (online: 11 November 2021)
Research Articles
The potential of using xylarium wood samples for wood density calculations: a comparison of approaches for volume measurement
vol. 4, pp. 150-159 (online: 11 August 2011)
iForest Database Search
Search By Author
Search By Keyword
Google Scholar Search
Citing Articles
Search By Author
Search By Keywords
PubMed Search
Search By Author
Search By Keyword


